Open Access
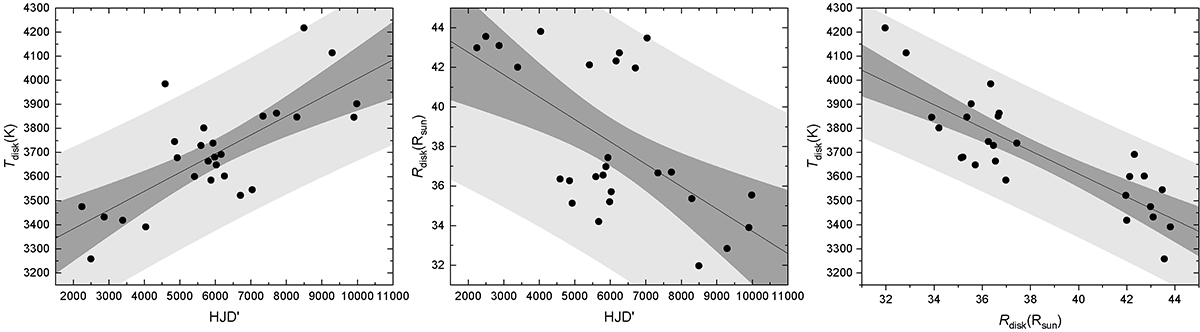
Fig. 8.
Download original image
Behavior of some disk parameters according to our models. Typical errors are 60 K and 0.1 R⊙. Best linear fits are shown along with gray light and dark gray regions indicating 95% prediction and confidence bands, respectively. Parameters for these fits are given in Table 4.
Current usage metrics show cumulative count of Article Views (full-text article views including HTML views, PDF and ePub downloads, according to the available data) and Abstracts Views on Vision4Press platform.
Data correspond to usage on the plateform after 2015. The current usage metrics is available 48-96 hours after online publication and is updated daily on week days.
Initial download of the metrics may take a while.