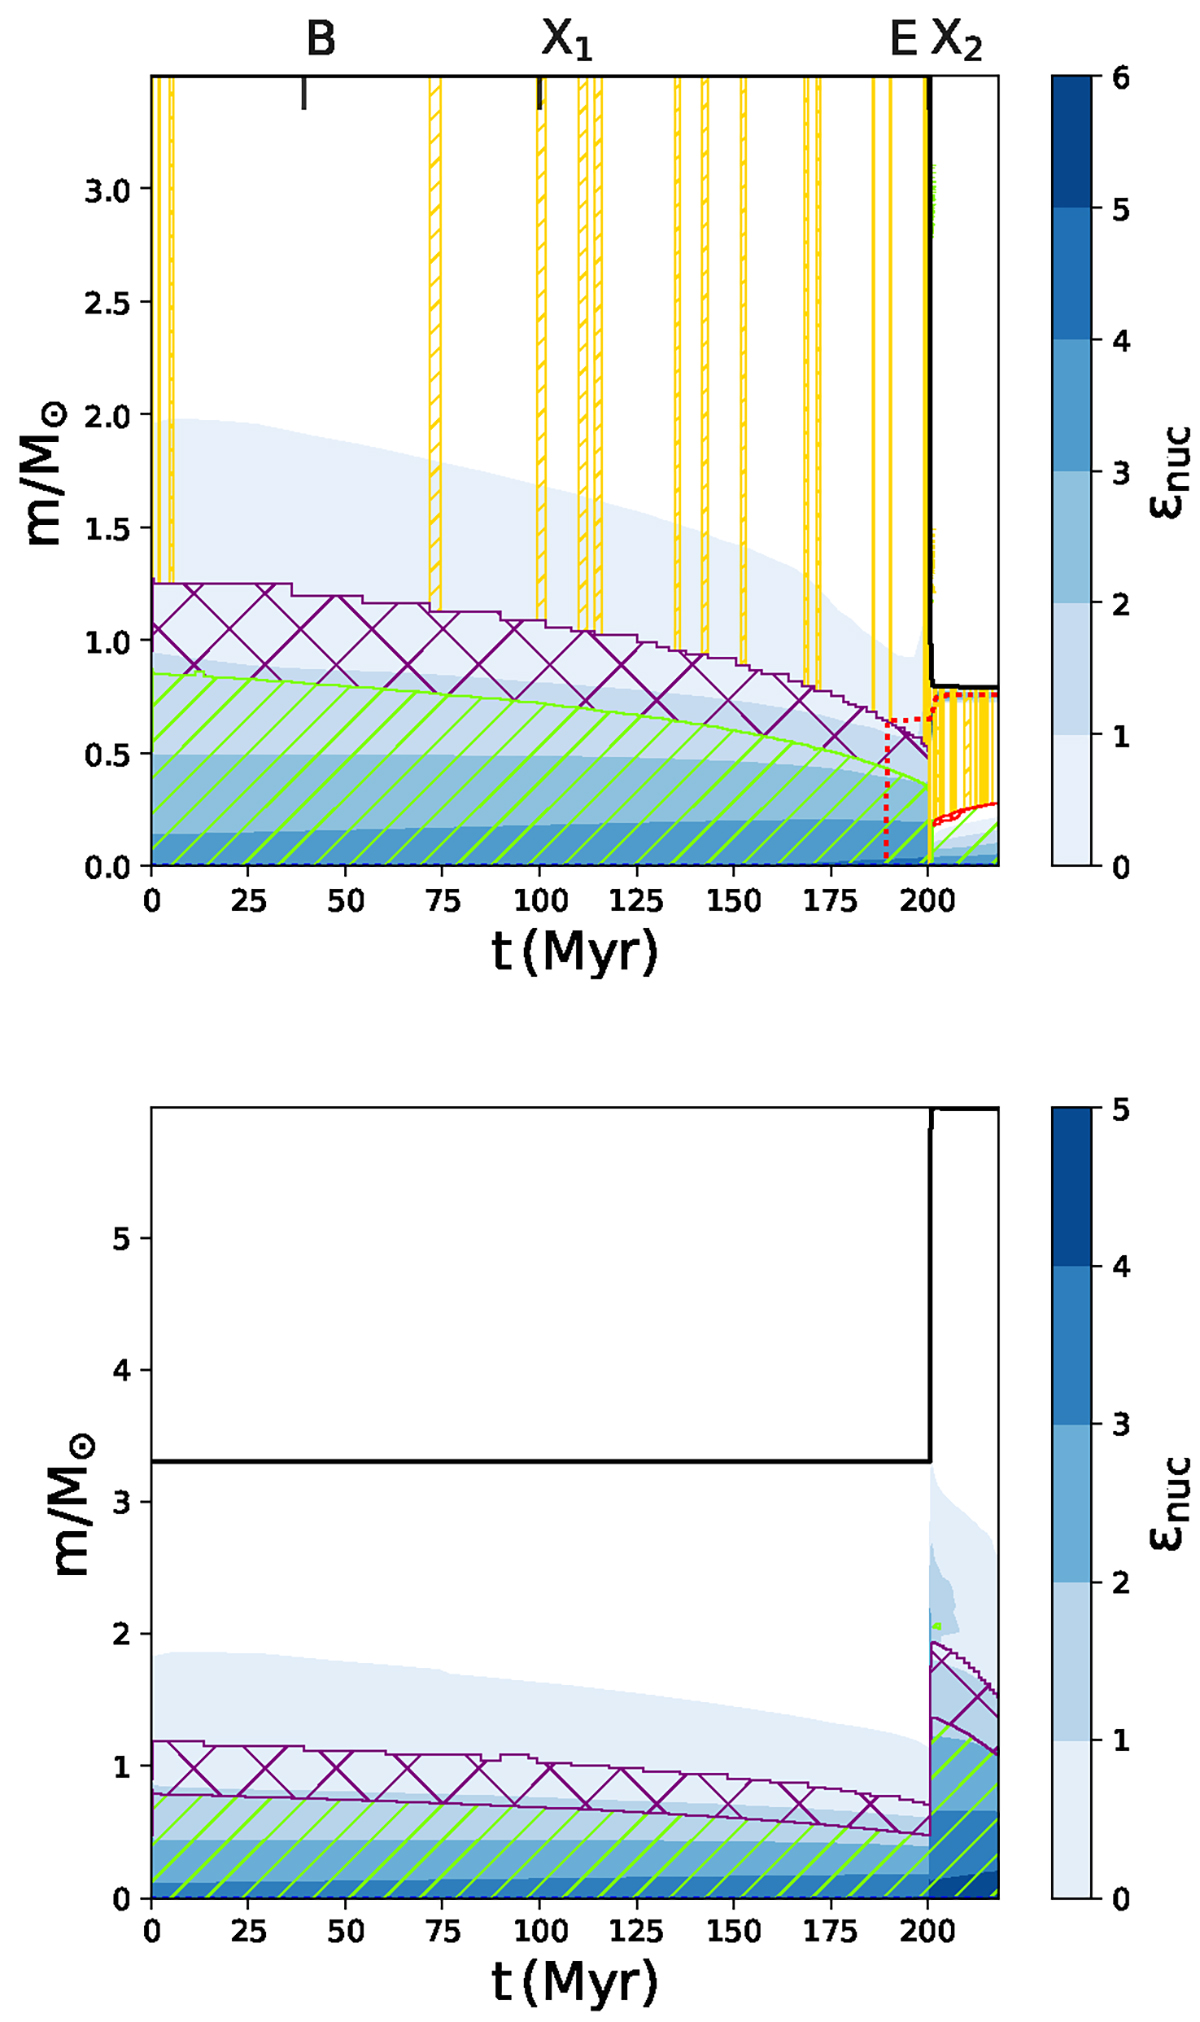
Fig. 17.
Download original image
Kippenhahn diagrams showing the internal structure of the donor (up) and gainer (down) stars. Diagrams with initial masses 3.5 and 3.3 M⊙ are shown. The evolutionary calculations were stopped when the donor star reached core helium depletion X(Hec) < 0.2. The x axis gives the age after ignition of hydrogen in units of Myr. The different layers are characterized by their values of M/M⊙. The convection mixing region is represented by hatched green, semi convection mixing region in red and the overshooting mixing region in crosshatched purple. The red dots represent the He core mass, while the thermohaline mixing region is represented in hatched yellow. The solid black lines show the surfaces of the stars.
Current usage metrics show cumulative count of Article Views (full-text article views including HTML views, PDF and ePub downloads, according to the available data) and Abstracts Views on Vision4Press platform.
Data correspond to usage on the plateform after 2015. The current usage metrics is available 48-96 hours after online publication and is updated daily on week days.
Initial download of the metrics may take a while.