Fig. 9
Download original image
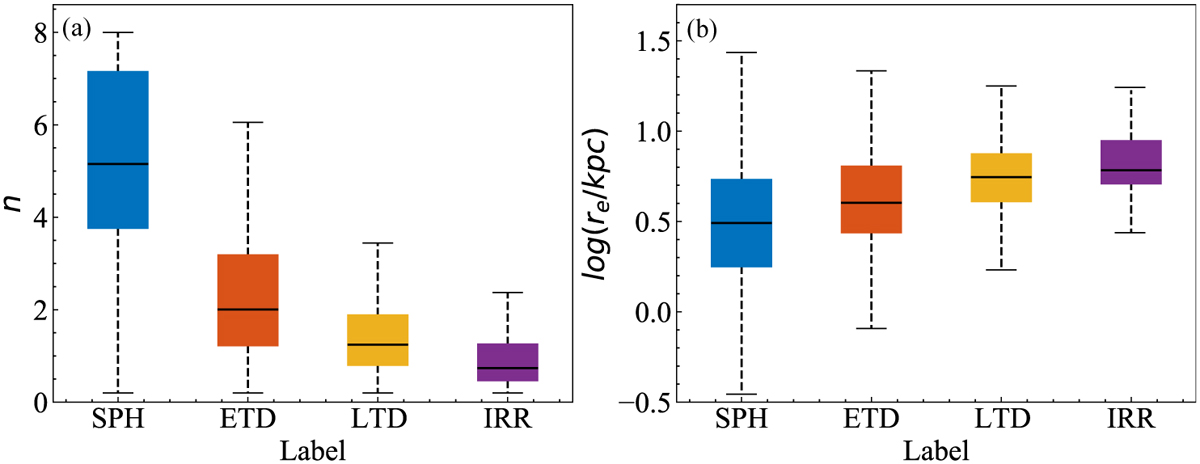
Box plots of Sérsic index (left) and effective radii (right) for different morphological types of massive galaxies. The bar chart represents the values of Sérsic index and effective radii for different galaxy types. It can be seen that from SPHs to IRRs, the galaxy Sérsic index gradually decreases, and effective radii gradually increase, which further indicates the reliability of our classification results. The end of each box represents the 40% upper and lower quartiles respectively, the ends of the dotted lines represent the maximum and minimum values, and the black horizontal line in the middle of the box represents the median.
Current usage metrics show cumulative count of Article Views (full-text article views including HTML views, PDF and ePub downloads, according to the available data) and Abstracts Views on Vision4Press platform.
Data correspond to usage on the plateform after 2015. The current usage metrics is available 48-96 hours after online publication and is updated daily on week days.
Initial download of the metrics may take a while.