| Issue |
A&A
Volume 683, March 2024
|
|
|---|---|---|
| Article Number | A42 | |
| Number of page(s) | 11 | |
| Section | Numerical methods and codes | |
| DOI | https://doi.org/10.1051/0004-6361/202348544 | |
| Published online | 05 March 2024 | |
Galaxy morphology classification based on Convolutional vision Transformer (CvT)★
1
School of Mathematics and Computer Science, Yunnan Minzu University, Kunming, Yunnan 650504, PR China
e-mail: This email address is being protected from spambots. You need JavaScript enabled to view it.
; This email address is being protected from spambots. You need JavaScript enabled to view it.
; This email address is being protected from spambots. You need JavaScript enabled to view it.
2
Key Laboratory for the Structure and Evolution of Celestial Objects, Chinese Academy China of Sciences, Kunming, Yunnan 650011, PR China
Received:
10
November
2023
Accepted:
2
January
2024
Abstract
Context. The classification of galaxy morphology is among the most active fields in astronomical research today. With the development of artificial intelligence technology, deep learning is a useful tool in the classification of the morphology of galaxies and significant progress has been made in this domain. However, there is still some room for improvement in terms of classification accuracy, automation, and related issues.
Aims. Convolutional vision Transformer (CvT) is an improved version of the Vision Transformer (ViT) model. It improves the performance of the ViT model by introducing a convolutional neural network (CNN). This study explores the performance of the CvT model in the area of galaxy morphology classification.
Methods. In this work, the CvT model was applied, for the first time, in a five-class classification task of galaxy morphology. We added different types and degrees of noise to the original galaxy images to verify that the CvT model achieves good classification performance, even in galaxy images with low signal-to-noise ratios (S/Ns). Then, we also validated the classification performance of the CvT model for galaxy images at different redshifts based on the low-redshift dataset GZ2 and the high-redshift dataset Galaxy Zoo CANDELS. In addition, we visualized and analyzed the classification results of the CvT model based on the t-distributed stochastic neighborhood -embedding (t-SNE) algorithm.
Results. We find that (1) compared with other five-class classification models of galaxy morphology based on CNN models, the average accuracy, precision, recall, and F1_score evaluation metrics of the CvT classification model are all higher than 98%, which is an improvement of at least 1% compared with those based on CNNs; (2) the classification visualization results show that different categories of galaxies are separated from each other in multi-dimensional space.
Conclusions. The application of the CvT model to the classification study of galaxy morphology is a novel undertaking that carries important implications for future studies.
Key words: methods: data analysis / techniques: image processing / Galaxy: general
Details on how to access these can be found at https://github.com/C-JIe123/Galaxy-Morphology
© The Authors 2024
 Open Access article, published by EDP Sciences, under the terms of the Creative Commons Attribution License (https://creativecommons.org/licenses/by/4.0), which permits unrestricted use, distribution, and reproduction in any medium, provided the original work is properly cited.
This article is published in open access under the Subscribe to Open model. This email address is being protected from spambots. You need JavaScript enabled to view it. to support open access publication.
1 Introduction
Galaxies are the fundamental units making up the Universe, consisting mainly of stars, stellar remnants, interstellar gas, dust, and dark matter. One of the important goals of galaxy research is to explain how galaxies evolved over time from their early stages to the large, diverse types of galaxies that can be seen today (Wen et al. 2014). In particular, studies of the morphology and structure of galaxies are crucial in understanding their evolution, as the morphology and structure of galaxies are not only closely related to the evolutionary history of the galaxy, but also one of the characteristics of exploring the physical parameters of the galaxy. By studying the formation and evolution of galaxies, astronomers can gain a comprehensive understanding of the formation history of the universe. At the same time, the morphology and characteristics of galaxies vary greatly in different evolutionary processes. Early-type galaxies in their photometry tend to have a reddish color, older stellar populations, and most of them feature bulges dominated by velocity dispersion in their centers. They also have shell structures left behind by multiple galaxy mergers. High-mass early-type galaxies are mostly located in dense environments and appear as elliptical galaxies in morphology. Late-type galaxies exhibit a bluish color in photometry, with a relatively young stellar population composition, containing a large amount of cold gas and exhibiting intense star formation activity. The motion state of stars in late-type galaxies is dominated by rotation around the center and is manifested as a disk-like galaxy with a stellar disk and spiral arm structure in terms of its morphology (Colless et al. 2001). Therefore, accurately classifying galaxies based on their morphological characteristics is the foundation for subsequent data analysis and mining.
There are different classification standards for galaxy morphology and the Hubble sequence proposed by Hubble in 1926 is the most famous early classification standard for galaxy morphology. Due to its significant correlation with physical parameters such as the mass of neutral hydrogen, integral color of galaxies, galaxy luminosity, and environment, it still exhibits a high reference value to this day. Based on the Hubble sequence, the Galaxy Zoo (GZ; Lintott et al. 2008) has provided a classification standard for galaxy morphology since 2007.
In recent years, the survey depth and detection efficiency of astronomical observation equipment have been continuously improved. The observation of Sloan Digital Sky Survey (SDSS; York et al. 2000, LAMOST (Cui et al. 2012), and James Webb Space Telescope (JWST; Gardner et al. 2023) as well as other survey projects have produced massive galaxy spectral data and image data, Thus, there is an urgent need for more automated and intelligent classification methods to meet the processing needs of large-scale galaxy image data. With the continuous development of deep learning technology, deep learning-related algorithms have been widely applied in the field of astronomy. The study of galaxy morphology classification based on deep learning algorithms is one of the hotspots in this research.
Machine learning techniques achieve very good results in the binary classification task of galaxy morphology. Domínguez Sánchez et al. (2018) used a convolutional neural network (CNN) to obtain classifications by a deep learning algorithm and classified the morphological catalog of 670 000 galaxies from the SDSS into two types, T-type and Galaxy Zoo 2 (GZ2), associated with the Hubble sequence and obtained good classification results: T-type with smaller offsets and scatter and GZ2 with a higher accuracy (>97%), precision, and recall (>90%). Cheng et al. (2020) employed various machine learning and deep learning models to classify the morphology of a sample of 2800 galaxies in the GZ dataset, including support vector machine (SVM), random forest, and CNNs, and compared the differences in the classification performance and efficiency among these models. The results show that CNN is the most successful method among these methods, with a morphological classification accuracy of 0.99 for elliptical and spiral galaxies, and they improve the average classification accuracy of CNN to 0.994 after correcting for labels. Walmsley et al. (2020) proposed a Bayesian CNN-based approach to handle uncertainties in morphological classification by introducing a probabilistic model. These authors used the GZ dataset for experimental evaluations and comparisons with other classification methods. The experimental results show that the Bayesian CNN and active learning-based approach show better performance in terms of morphological classification accuracy and uncertainty estimation.
Secondly, machine learning techniques have also been very widely used in tasks based on classes of three, five, and ten in terms of galaxy morphology. The multi-class classification task of galaxy morphology is intended to categorize galaxies into multiple classes based on their appearance and structural features, it helps to reveal relationships among different types of galaxies and provides a deeper understanding of the structure and evolution of the universe. Multi-class classification tasks are more complex and varied than binary classification tasks and the classification results often depend on the diversity and complexity of the galaxy images to be classified. Zhu et al. (2019) obtained the deep residual network model ResNet-26 by improving the residual unit of the residual network (ResNet). They extracted and analyzed the morphological features of galaxies, and verified the effectiveness of the model in classifying galaxy morphology with a classification accuracy of 95.12%. Gupta et al. (2022) used the NODE method to classify galaxy morphology based on galaxy images from the GZ2 dataset and obtained an accuracy of 91–95%. The results show that the accuracy of NODE is comparable to that of the ResNet model, but the advantage of this method is that the classification process has fewer parameters and consumes less memory. Ai et al. (2022) applied the EfficientNet model to the classification research of galaxy data morphology. The experimental results show that the average accuracy, precision, recall, and F1_score based on EfficientNet-B5 model are all above 96.6%, which shows a great improvement compared with the classification results of ResNet-26 model in the residual network (ResNet). Wei et al. (2022) proposed a method based on contrastive learning. With the aim of characterizing galaxy images with sparse semantic information and dominated contour, vision transformers and CNNs were used coherently in the feature extraction layer to provide rich semantic representation by fusing multi-level features. The method was trained and tested on GZ2 and other data sets, and the accuracy rates reached 94.7%, 96.5%, and 89.9% respectively. He et al. (2023) designed a multi-channel depth residual network framework ResNet-Core based on the ResNet-50 network structure. By respectively targeting the characteristics of spectral images and galaxy images by incorporating convolutional kernel variance control technology to extract contour and detail features, the average accuracy was effectively improved, surpassing the highest performance ResNet-50 at the time. The results showed that the ResNet-Core model had better classification performance and better robustness. Hui et al. (2022) proposed applying the DenseNet algorithm to galaxy morphology classification. The experimental results showed that the accuracy obtained using the DenseNet-121 model was 91.79%, which means that out of 3044 test images, 2794 galaxy images can be accurately classified; in addition, the accuracy of the model is 79.92%, the recall is 73.20%, and the F1_Score is 75.48%. Li et al. (2023) proposed a multi-scale convolutional capsule network (MSCCN) model for galaxy morphology classification research and this model uses a multi-branch structure to extract multi-scale hidden features of galaxy images, and is trained and tested on the GZ2 dataset. The experimental results show that the model achieves a macroscopic averaging accuracy of 97%, 96%, and 98% recall and a 97% F1_score. It is worth noting that the MSCCN 5-class classification model based on the GZ2 dataset has achieved the best classification performance so far.
Since 2021, the transformer model (Vaswani et al. 2017) in deep learning has achieved great success in natural language processing (NLP). At the same time, the Google team has developed a new image classification architecture, called Vision Transformer (ViT; Dosovitskiy et al. 2021). The ViT model has been widely used in various fields of classification tasks since its release. Gheflati & Rivaz (2022) applied the ViT model to the medical field and classified breast ultrasound images. The results showed that the ViT model had better classification performance than the CNN model for breast ultrasound images. Gao et al. (2021) participated in the MIA-COV19 challenge with the ViT model. They classified COVID-19 and non COVID-19 according to CT lung images. The result of the ViT model was better than that of DenseNet model in the same period, with an F1_score of 0.76. Tanzi et al. (2022) used the ViT architecture to classify images of different fracture types and compared it with classic CNN and multi-stage architecture composed of successive CNNs. The results showed that the ViT model was able to accurately predict 83% of test images, with better performance than the CNN model. Yao-Yu Lin et al. (2021) explored the use of ViT on GZ2 for galaxy morphology classification into eight categories and the ViT model obtained the best overall accuracy is 80.55%. Their results illustrate that the ViT models do not outperform CNN over the entire sample, but they do find that ViT reaches a higher classification accuracy in classifying smaller and fainter galaxies. Karpoor (2022) present the results for the classification of galaxies between spirals, ellipticals, and irregulars using a supervised deep learning model based on the ViT architecture and they find that the ViT-based deep-learning model performs a very well, offering an accurate classification of different types of galaxy morphologies.
After the release of ViT types, many researchers made improvements to the model. For example, Chu et al. (2023) proposed a conditional position encodings visual transformer (CPVT) structure that replaces predefined position embeddings in ViT with conditional position encodings (CPE), enabling transformers to process images of any size without interpolation. Han et al. (2021) proposed the Transformer-iN-Transformer (TNT) model, which utilizes outer transformer blocks that handle patch embedding and inner transformer blocks that model the relationship between pixel embeddings to model patch-level and pixel-level representations. Yuan et al. (2021) proposed the Tokens-To-Token (T2T) model, which mainly improves the ViT model by connecting multiple tokens within a sliding window into one token. Wang et al. (2021) proposed the Pyramid Vision Transformer (PVT), which adopts a multi-stage design (without convolutions) for the transformer, similar to multi-scales in CNNs, which is beneficial for dense prediction tasks. Wu et al. (2021) proposed a Convolutional vision Transformer (CvT) model, which introduces convolution into the ViT model to improve its performance. The CvT model achieved a top-1 accuracy of 87.7% on the public dataset ImageNet-1k, surpassing the ViT model's accuracy of 76% on that dataset.
Thanks to the powerful advantages of the CvT model in image classification tasks, this work is the first to apply the CvT model to galaxy image morphology classification. The organizational structure of this article is as follows. In Sect. 2, the traditional ViT network structure is discussed, followed by a dis-cusion of CvT, which introduces CNNs into ViT. In Sect. 3, we introduce the dataset used in this work and also augmente the data for categories with fewer data samples. In the Sect. 4, we present and analyze the classification results of the CvT model, and compared our work with other similar works. In addition, we also visualize the classification results of the CvT model. Finally, we summarize our findings in Sect. 5.
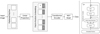 |
Fig. 1 Vision Transformer (ViT) structure. |
2 Methods
2.1 Vision Transformer (ViT)
In 2017, Google's machine translation team in the field of sequence transduction, completely abandoned CNN and RNN models and relied solely on attention structures, which became known as transformers (Vaswani et al. 2017). In 2021, inspired by transformers' tremendous success in NLP, the Google team developed a new image classification architecture and named Vision Transformer (ViT; Dosovitskiy et al. 2021), with its basic structure shown in Fig. 1. The input image of the model is first cut into fixed-size patches and then the flattened patches are linear projections (the dimension is transformed by matrix multiplication). In order to preserve the position information of each patch, position encoding is added to each patch before it is sent to the Transformer encoder. The Transformer encoder consists of L standard Transformer blocks, each of which is composed of layer normalization (LN), multi-head self-attention (MHSA), multi-layer perceptron (MLP), and residual connection (RC). Specifically, LN is a normalization technique that helps the model training process to stabilize for better gradient propagation and model convergence. In particular, MHSA is one of the core components of ViT, which allows the model to make global associations and interactions within the input sequence to capture the dependencies between different features. Then, MLP is used to help models extract and transform features in the input data to better understand and process complex patterns, while RC improves the information transfer and training effectiveness by directly connecting inputs and outputs.
It is worth noting that for ViT to achieve a level of performance that is comparable to that of the state-of-the-art convolutional structures, it had to be pre-trained on large-scale datasets before being migrated to small and medium-sized datasets.
2.2 Convolutional vision Transformer (CvT)
The CvT model (Wu et al. 2021) is a new model architecture proposed based on the ViT model. The CvT model introduces convolutional neural networks into the ViT architecture to improve performance and robustness, while maintaining a high degree of computational and memory efficiency.
The overall structure of CvT is shown in Fig. 2. First, it introduces convolution into two core parts of the ViT architecture: a transformer hierarchy containing convolutional token embeddings, and a convolutional transformer block utilizing convolutional projection. Among them: (i) the main function of convolutional token embedding is to simulate the downsam-pling design of CNN and increase the width of the token while reducing the number of tokens; (ii) Convolutional Transformer Blocks use depth-wise separable convolutional operations called convolutional projection, which is used for query, key, and value embeddings, rather than the standard position-wise linear projection in ViT. For convolutional projection, 1D tokens are first reshaped to 2D features. Then, the convolution is used to extract token features for each position separately. Finally, tokens are flattened to get 1D features, that is, Q, K, and V. At last, added the classification token to the sequence, then MLP Head is used to predict the results on the classification token output. More detailed descriptions of the principles of the CvT model can be found in Wu et al. (2021).
By adjusting different parameters such as the number of Transformer blocks and the feature dimensions in the CvT model, several different versions of the CVT model have come about. In these different versions of the CvT model, CvT-13, and CvT-21 as the basic models, and CvT-X represents a Convolutional Vision Transformer with a total of X Transformer blocks. In addition, there are models with larger token dimensions and wider widths, namely, CvT-W24 (where W represents width). In this study, we also compare the classification performance of different versions of the CvT model.
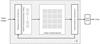 |
Fig. 2 Convolutional vision Transformer (CvT) structure. |
3 Data
3.1 Galaxy Zoo sample
The Galaxy Zoo project invited a large number of volunteers to classify galaxies based on the morphology of the given color images (Lintott et al. 2008). This paper uses data and classification standards provided by GZ2 (Willett et al. 2013). This dataset is from the Galaxy Zoo-the Galaxy Challenge competition held by the GZ on the Kaggle platform. The training set for this competition includes 61 578 labeled color RGB images of galaxy observations from SDSS DR7 (Abazajian et al. 2009), with a size of 424 × 424 × 3.
The observation of galaxies by SDSS includes 5 optical bands (u, g, r, i, and z), and in related research work, data from the first u, g, and r bands are usually taken to synthesize corresponding RGB galaxy images. The vector labeled 1 × 37 for each image is derived from the corrected cumulative frequency value of GZ2 volunteer voting scores. GZ2 divides galaxy morphology into 11 questions and 37 answers. With reference to the current research, we selected five types of galaxy data: completely round smooth galaxies, in-between smooth galaxies, cigar-shaped smooth galaxies, edge-on galaxies, and spiral galaxies. We then applied the CvT model to classify and study them.
The GZ2 data release has a clear threshold selection rule for well-sampled galaxies, which means that for the same galaxy image, the number of volunteers to classify it must be greater than 20, and the calculated cumulative voting score correction value must meet a certain threshold before the image can be classified into a certain galaxy category. For example, an image must meet three threshold conditions (ƒſeatures/disk ≥ 0.430, ƒedge–on,no ≥ 0.715, ƒspirai,yes ≥ 0.619) to be classified as a spiral galaxy. Due to the strict threshold selection rules for well-sampled galaxies in GZ2, the number of data samples that can be selected for smooth galaxies (completely round smooth galaxies, in-between smooth galaxies and cigar-shaped smooth galaxies) in the above five categories is slightly insufficient. In order to obtain a sufficient number of samples for model training and testing, this paper appropriately widens the threshold selection standard for smooth galaxies from 0.8 to 0.5, while the threshold selection rules for edge-on galaxies and spiral galaxies still refer to the default values in the GZ2 data release white papers. The well-sampled galaxies obtained based on the above rules include a total of 28 790 galaxy images, this data set is consistent with another work (Li et al. 2023). Figure 3 shows five types of galaxy image data randomly selected from the well-sampled original dataset.
The work then divides the 28 790 well-sampled galaxies into a training and a test set in a ratio of 9:1. Table 1 shows the number of images for each type of galaxy in each training and test set. It can be seen that the number of images for the five types of galaxies matches the same distribution and proportion.
In addition, to maintain a balance between the number of sample data in each category, this study has enhanced the training set data by rotating a relatively small number of cigar-shaped galaxy data. We rotated the image data of cigar-shaped galaxies by 45°, 90°, 120°, and 180°, respectively. The rotated galaxy images are shown in Fig. 4.
It should be noted that when the rotation angle is not 90° the corners of the image will produce empty pixels that will affect the final classification. Therefore, to eliminate the effect of empty pixels we used nearest-neighbour interpolation to fill these empty pixels. The basic steps of the nearest-neighbor interpolation are as follows: (i) Determine the location of the empty pixel, namely, the pixel location in the corner. (ii) Calculate the transformed position of the empty pixel location with respect to the original image. (iii) Find the nearest original pixel position to the transformed position. (iv) Assign the value of the nearest original pixel to the empty pixel position.
Thanks to this method, pixels can be filled at the corners to make the image appear more complete.
Sample statistics of galaxy images in the training and validation sets.
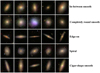 |
Fig. 3 Images of a randomly selected galaxy from GZ2. |
3.2 High-redshift sample
To verify the model's classification performance for different redshift samples, we tried to use an additional high redshift dataset for the purposes of this study.
Redshift is an astronomical phenomenon caused by the expansion of the Universe, which results in a change in the wavelength of light emitted by celestial objects. As the object moves away from the observer, its light is shifted towards the red end of the spectrum. Different redshift values correspond to different cosmic epochs, and by categorizing images of galaxies in different redshift ranges, astronomers can study the evolution of the Universe at different times. For example, by comparing early and late galaxies, we can understand the changes in galaxy formation and evolution throughout the Universe. At the same time, the nature and morphology of galaxies change as the universe evolves. Studying the results of the same classification model at different redshifts helps us to understand the evolutionary trend of galaxies and the characteristics of different evolutionary stages. In addition, redshift is related to the distance of galaxies. By studying how the same classification model classifies galaxy images at different redshifts, we can determine the redshift values of galaxies and infer the distance distribution of galaxies in the universe.
In our study, we utilized the GZ2 dataset, which encompasses a low-redshift range of 0.0005 ≤ z ≤ 0.25. For a more comprehensive analysis, we extended our experiments to incorporate the Galaxy Zoo CANDELS dataset, cited from Simmons et al. (2016), which surveys high-redshift galaxies within the range of 1 ≤ z ≤ 3. The CANDELS dataset, a key subset of the GZ project, encompasses approximately 800 square arcminutes across five significant astronomical fields, providing the most profound infrared imaging available to date.
Hocking et al. (2017) employed a robust unsupervised machine learning algorithm combining growing neural gas (GNG), hierarchical clustering (HC), and connected component labeling. This approach facilitated the identification of similar galactic structures within the CANDELS dataset, leading to the categorization of roughly 60 000 galaxies into 200 distinct clusters. Each galaxy's unique vector representation, coupled with the Pearson correlation coefficient, enabled the precise matching of galaxies within the dataset based on their similarities. This methodology adeptly segregated galaxies into classifications of "early" and "late" types, delineated by the reddish hues of older galaxies and the bluish tones of younger ones. To test the efficacy of the CvT model in classifying high-redshift imagery, we selected five groups from the CANDELS catalog, constructed by Hocking et al. (2017), which exhibits a high Pearson similarity and encompasses diverse morphological characteristics and developmental stages. The selected galaxy images are shown in Fig. 5.
Among the five selected groups, there is Group 6, which is characterized by elliptical galaxies devoid of conspicuous spiral arms, exhibiting a radial gradient in luminosity that fades from a central yellow to a pale yellow-white, indicative of galactic antiquity. Group 8 comprises spiral galaxies with luminous cores and dimmer spiral arms, rendered in shades of blue, signaling the presence of younger galactic formations. Group 11 includes spiral galaxies as well, with pronounced arms and luminous centers, yet their reddish palette points to the older, early-type galactic forms. Group 16 consists of irregular galaxies, whose blue coloring denotes active star formation typically associated with late-type galaxies. Group 45 also presents irregular galaxies, but their reddish tint suggests classification as early-type galaxies. The catalog used for this experiment can be searched online1.
4 Galaxy morphology classification results based on the CvT-13 model
4.1 Computer set-up
This work is based on a server with a V100-SXM2-32GB GPU and a 12 vCPU Intel (R) Xeon (R) Platinum 8255C CPU. The compiler is Pycharm-professional version 2021.1 and CUDA version 11.3. In addition, this work was implemented using Python language based on the Pytorch 1.11.0 framework (Paszke et al. 2019), utilizing Python libraries such as sklearn (Pedregosa et al. 2011), Scikit image (van der Walt et al. 2014), and transforms (Wolf et al. 2019).
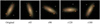 |
Fig. 4 Images of a cigar-shaped galaxy after rotation. |
Classification performance in five classes of galaxies based on the CvT-13 model.
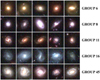 |
Fig. 5 Images of five types of galaxies selected in the Galaxy Zoo CANDELS dataset. |
4.2 Result analysis
To verify the classification performance of the CvT model, we based this work on the basic CvT-13 model and using evaluation indicators, such as accuracy, precision, recall, and F1_score to measure the classification performance of the model. Table 2 shows the best classification results of CvT among various galaxies. We can see that (except for cigar-shaped smooth galaxies) the classification accuracy of all types is above 98%, while the precision, recall, and F1_score are also above 99% except for cigar-shaped smooth galaxies. This is mainly due to the limited data volume of cigar-shaped smooth galaxies. At the same time, under the average classification of five types of galaxies, the accuracy is 98.8%, the precision is 98.1%, the recall is 98.0%, and the F1_score is 98.0%, which verifies the robustness of the CvT model for morphological galaxy classification.
Subsequently, we analyzed the problem of poor classification results for cigar-shaped smooth galaxies in detail. In addition to the limited amount of image data for this class of galaxies, other potential factors that may make this class of galaxies difficult to classify have also been considered. Firstly, cigar-shaped smooth galaxies can make it relatively difficult for automatic classification algorithms to accurately identify and classify them due to their elongated shape or special structural properties; specifically, the morphological features of cigar-shaped smooth galaxies can affect their performance in classification tasks. Due to the smooth appearance of cigar-shaped smooth galaxies and the absence of prominent features such as spiral arms, they may show higher similarity to other morphological types (e.g., spiral galaxies, edge-on galaxies), which can lead to lower classification accuracy. This is particularly true in the case of unbalanced datasets or poor feature selection, where machine learning automatic classifiers may misclassify spheroidal galaxies as other types or have other difficulties in accurately distinguishing them from other morphologies. Another reason to consider is the possible contamination caused by GZ volunteers. GZ is a citizen science project which allows volunteers to help classify galaxies. While the project produces valuable data, there is always the potential for human error or subjectivity in the classification process. In some cases, misclassifications or category inconsistencies contributed by volunteers may affect the overall classification results. Given that the GZ2 dataset establishes clear classification threshold criteria for each galaxy image, its cumulatively voted positive assessments must exceed a specific threshold to be formally categorized as a galaxy. Hence, to effectively address the issue of inconsistent volunteer categorization, we can resolve it by implementing a more stringent threshold selection criterion. The precise threshold criteria employed in this study are elaborated in detail in Sect. 3.1.
Furthermore, in this work, we also compare different versions of the CvT model. The results of the comparison are shown in Table 3. The various classification performance metrics of the different versions of the CvT model for five-class classifications of the GZ2 dataset are not very different, but those of CvT-21 and CvT-W24 are much higher than CvT-13 for Params and FLOPs, which evaluate the computational resources and the number of parameters. Therefore, we used the CvT-13 model for other comparisons in our subsequent experiments.
In Fig. 6, we use ROC curves to calculate AUC values to evaluate the model performance. The outcome indicates that the model exhibits a good classification result for each category of galaxies. Except for cigar-shaped smooth galaxies with a small number of data samples, which have an AUC value of 0.977, the AUC value of each category of galaxies is above 0.99.
Figure 7 presents the confusion matrix of the testing dataset on the CvT-13 model, which uses indicators of 0 to 4 represent galaxy classes, corresponding to Table 1. In the figure, the number of completely round smooth galaxies and in-between smooth and spiral galaxies is 827, 791, and 781, respectively, and when these three types of galaxies were misclassified, they were all misclassified with respect to each other – and not misclassified as cigar-shaped smooth and edge-on galaxies. For cigar-shaped smooth galaxies and edge-on galaxies, the correct number of classifications is 51 and 389, respectively. Among them, 2 and 4 cigar-shaped smooth galaxies are misclassified as in-between smooth and edge-on galaxies, while 1 and 4 edge-on galaxies are misclassified as in-between smooth and cigar-shaped smooth galaxies, respectively. This is mainly because completely round smooth galaxies (in-between smooth galaxies and spiral galaxies) do have certain similarities in terms of their morphology. In addition, for cigar-shaped smooth galaxies and edge-on galaxies, the classification results may be poor due to the relatively small amount of data for these two types of galaxies and the failure to adequately learn their morphological features during the model training.
In addition, the generalization capability of the model is verified in this work for low signal-to-noise ratio (S/N) galaxy image data. Table 4 shows the specifics of adding Gaussian noise and salt-and-pepper noise to the original galaxy images.
By adjusting the size of the Gaussian distribution standard deviation (sigma) to control the level of Gaussian noise addition, the sigma values of 5, 15, and 25 were set in this work; salt-and-pepper noise refers to adding black and white noisy points to an image and controlling the proportion of noise added by setting the amount. In the experiment, the amount s were set to 0.05, 0.1, and 0.2, respectively. The larger the values of Sigma and amount, the more noise added, and the more severe the image damage. The galaxy image with added noise is shown in Fig. 8, and the classification results based on the CvT model in the galaxy morphology with added noise are shown in Table 4. From the perspective of classification performance, the overall classification performance of galaxy images has decreased compared to those without noise. However, the overall classification accuracy with the addition of noise is stable at over 80%, indicating that the CvT-13 model comparison with EfficientNet-B5 model (Ai et al. 2022) has stable classification performance for low S/N galaxy images and has relatively good generalization ability. Here, we chose to compare our results with the EfficientNet-B5 model primarily because this was the only study that featured similar noise experiments and provided these results in their work. It should be noted that this work by EfficientNet-B5 only adds different degrees of Gaussian noise to the images, so we only based our comparison on the Gaussian noise correlation results.
In astronomical observations, images with different S/Ns are usually obtained due to the differences in equipment and observation conditions, and so on. Therefore, it is very important in astronomical research that automatic classification models for image data with different S/N can achieve better classification performance. Firstly, astronomical images usually have varying degrees of noise and background interference. Therefore the model's ability to classify images with different S/Ns allows astronomers to obtain reliable and consistent results across observations. It ensures that classification algorithms can accurately identify and distinguish astronomical objects or phenomena even in the presence of noise. Secondly, in the field of astronomical research, researchers are constantly pursuing the detection of faint or distant objects, such as distant galaxies, faint stars, or exoplanets. These objects may have low signal levels compared to the background noise. Through the ability to classify low S/N images, astronomers can increase the chances of detecting and identifying these elusive objects, which may hold important scientific insights. Astronomers can then quantify the uncertainty associated with the classification by classifying images with different S/Ns. Also, by understanding the effect of noise on the classification process, they can assign probabilities or confidence levels to their classification tasks, thus providing a more complete and accurate representation of the data. Finally, astronomers are better able to study transient or variable objects. Observations of transient objects such as supernovae, stellar flares, or gamma-ray bursts, whose brightness or spectral properties change rapidly, often involve images with different S/Ns due to the temporal conditions or intrinsic properties of the object. The ability to classify images with different S/Ns allows astronomers to follow and study the temporal evolution and behavior of these transient or variable objects. In summary, the ability to classify astronomical images with different S/Ns is crucial in astronomical observations. It ensures the reliability and robustness of classification results, aids in the detection of faint or distant objects, allows for the quantification of uncertainties, and facilitates the study of transient or variable phenomena.
Additionally, we have conducted experiments with images of galaxies at different resolutions based on the CvT-13 model. Astronomical observations often require capturing images of large areas of the sky at different resolutions. Classifying images of different resolutions helps to optimize observing strategies and data analysis. By understanding the characteristics and limitations of different resolutions, astronomers can design sky surveys that take into account the coverage of large-scale structures and the need for detailed information on specific regions or specific objects. On the other hand, different telescopes, instruments or observing techniques may produce images with different resolutions. Astronomers must have the ability to classify images acquired by different instruments or observations to ensure consistency and comparability between different data sets. With such a capability, data from different sources can be integrated and analyzed to enhance the scientific understanding of celestial bodies and celestial processes. In this work, we set different resolutions of the galaxy images by adjusting the dots per inch (DPI) parameter, which is a unit of measurement for image resolution that describes the number of pixels per inch in an image. The larger the DPI value, the higher the resolution of the image, and the clearer the image. The galaxy images after adjusting the resolution are shown in Fig. 9, and the average classification accuracies of galaxy images with different DPI values are shown in Table 5.
Furthermore, we used the CvT-13 model to classify images of galaxies at high redshifts. We used the datasets Galaxy zoo CANDELS introduced in Sect. 3.2, based on the high-redshift datasets we investigated the classification of galaxy images with high-redshift ranges using the CvT-13 model. The experimental results are shown in Table 6, where we can see that the CvT-13 model also has a good classification effect on high-redshift galaxy images.
Classification performance of different versions of CvT models.
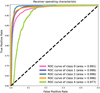 |
Fig. 6 ROC curves of CvT-13 in the classification of galaxies of different morphologies. |
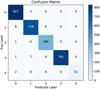 |
Fig. 7 Confusion matrix of CvT-13 in the classification of galaxies of different morphologies. |
Comparison of classification results under different levels of Gaussian noise and salt-and-pepper noise by different models.
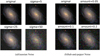 |
Fig. 8 Adding images of galaxies with different types and levels of noise. |
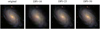 |
Fig. 9 Images of galaxies at different resolutions. |
Comparison of classification results at different resolutions.
4.3 Performance comparison and analysis of different models
In this section, we compare the classification performance of the CvT-13 model with other works, including ResNet-26 (Zhu et al. 2019), NODE (Gupta et al. 2022), EfficientNet-B5 (Ai et al. 2022), MSCCN (Li et al. 2023), and ViT B/16 (Dosovitskiy et al. 2021). The data sources used in these works are the same and the division ratio between the training dataset and the testing dataset is consistent. The specific comparison of classification results is shown in Table 7. From the comparison results, the accuracy obtained with the CvT-13 model used in this work exceeds that of the classification models used in other works, indicating that the CvT model is very effective in classifying galaxy morphology. Meanwhile, as can be seen from the comparison results, the MSCCN model (Li et al. 2023) also shows impressive efficacy in the galaxy morphology classification task, especially on the GZ2 dataset. However, the CvT model we have adopted stands out with its cutting-edge transformer-based technology. This model not only excels in the same classification tasks, showcasing exceptional performance but also brings to the table unique and advanced features. These distinguishing characteristics of the CvT model not only complement its high-level performance but also highlight its significant advantages and potential for broader applications in the field of galaxy morphology classification.
In addition, we have also compared ViT B/16 and CvT-13, which are the two models based on the transformer structure, and these two models are the most basic versions of all of them. As shown in Table 8, the results of the comparison experiments show that the CvT-13 model has a large improvement over the ViT B/16 model in two aspects: computational resources and memory use. Meanwhile, the basic structure of the ViT has been used in related works on eight and three classifications of galaxy morphology (Yao-Yu Lin et al. 2021; Karpoor 2022), their results are superior to traditional CNN-based classification networks. In the subsequent work, we will use the CVT model to classify galaxy images at levels 3 and 8, comparing them with the ViT model.
4.4 Visualization of classification results
To explore the information on galaxy morphology features from the classification results, we visualized the classification results of the testing dataset. In this part of the study, we used the t-SNE algorithm to visualize and analyze the classification results of the CvT model. The t-SNE algorithm is a nonlinear dimensionality reduction algorithm used for multidimensional data scaling (Devassy & George 2020), which can preserve the local structure of data samples and obtain low-dimensional data that is more similar to the original high-dimensional data. Due to its significant performance in scaling high-dimensional data to lower dimensional data, it is widely used in machine learning. The t-SNE algorithm converts the similarity between data points into probability and the similarity in the original high-dimensional space is represented by a Gaussian distribution. The probability of embedding space is represented by a T-distribution, which projects data from high-dimensional space to low-dimensional space and visualizes it.
Figure 10 shows a visualization of the results of galaxy morphology classification using the CvT model, from which it can be seen that clusters of various galaxies have clear and distinct boundaries, indicating that the CvT model performs well in classifying galaxy morphology. The boundary between smooth galaxies and completely round smooth galaxies has a very small overlap because these two types of galaxies are smooth galaxies with very similar shapes, which leads to some images of these two types of galaxies being misclassified. In addition, cigar-shaped smooth galaxies have been partially misclassifled as spiral galaxies due to limited data samples.
Classification performance of five classes of galaxies based on the CvT-13 model under the Galaxy Zoo CANDELS dataset.
Comparison results of classification evaluation indexes of five models.
Comparison of computational and memory use between CvT-13 and ViT B/16.
5 Summary and prospects
With the continuous improvement of the depth and detection efficiency of large-scale sky surveys, the accumulated massive astronomical data poses new challenges to their processing methods. Given the widespread application of deep learning in astronomical data and the tremendous success of the transformer method in the NLP field, this work applies the CvT model to the classification of galaxy morphology. Our study novelty resides in the use, for the first time, of CvTs to the classification of galaxy images and the performance of the model is also validated across various aspects. We also compared a number of different classification methods and demonstrated that the CvT model's performance for a quintuple classification of galaxy morphology is by far the best.
Among them, transformer-based classification models have achieved high accuracy in galaxy morphology classification. In CvT, the overall highest accuracy reached 98.8%, average precision reached 98.1%, average recall reached 98.0%, and average Fl_score reached 98.0%. This has shown a significant improvement compared to CNN-based classification models, proving that transformer-based classification models can be applied to galaxy morphology classification. Meanwhile, the classification accuracy of CvT for low-S/N galaxy images is above 80%, indicating that the model also has good generalization ability for low-S/N galaxy images. In addition, the t-SNE algorithm is also used in this work to visualize the classification results of the model, which can more intuitively demonstrate the effectiveness of the CvT model in classifying galaxy morphology.
The CvT model used in this article provides more possibilities for subsequent data analysis of more large-scale sky survey telescopes in the future, such as the China Space Station Telescope (CSST) and the Large Synthetic Survey Telescope (LSST), which China plans to launch in 2024. In future works, we plan to use CvT to conduct galaxy image classification research that extends beyond the morphology presented in this paper. We will investigate the impact of the network structure in CvT on its morphology classification performance and further verify its effectiveness in galaxy morphology classification.
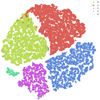 |
Fig. 10 Visualization of CvT classification results. |
Acknowledgements
We thank the anonymous referee for valuable and helpful comments and suggestions. This work is supported by the National Nature Science Foundation of China (61561053), the Scientific Research Foundation Project of Yunnan Education Department (2023J0624), the Yunnan Fundamental Research Projects (grant no. 202301AV070007), and the "Yunnan Revitalization Talent Support Program" Innovation Team Project.
References
- Abazajian, K. N., Adelman-McCarthy, J. K., Agüeros, M. A., et al. 2009, ApJS, 182, 543 [Google Scholar]
- Ai, L. P., Xu, Q. F., Du, L. T., et al. 2022, Acta Astron. Sin., 63, 42 [Google Scholar]
- Cheng, T.-Y., Conselice, C. J., Aragón-Salamanca, A., et al. 2020, MNRAS, 493, 4209 [Google Scholar]
- Chu, X., Tian, Z., Zhang, B., Wang, X., & Shen, C. 2023, in The Eleventh International Conference on Learning Representations [Google Scholar]
- Colless, M., Dalton, G., Maddox, S., et al. 2001, MNRAS, 328, 1039 [Google Scholar]
- Cui, X.-Q., Zhao, Y.-H., Chu, Y.-Q., et al. 2012, Res. Astron. Astrophys., 12, 1197 [Google Scholar]
- Devassy, B. M., & George, S. 2020, Forensic Sci. Int., 311, 110194 [CrossRef] [Google Scholar]
- Domínguez Sánchez, H., Huertas-Company, M., Bernardi, M., Tuccillo, D., & Fischer, J. L. 2018, MNRAS, 476, 3661 [Google Scholar]
- Dosovitskiy, A., Beyer, L., Kolesnikov, A., et al. 2021, in International Conference on Learning Representations [Google Scholar]
- Gao, X., Qian, Y., & Gao, A. 2021, ArXiv e-prints [arXiv:2187.81682] [Google Scholar]
- Gardner, J. P., Mather, J. C., Abbott, R., et al. 2023, PASP, 135, 068001 [NASA ADS] [CrossRef] [Google Scholar]
- Gheflati, B., & Rivaz, H. 2022, in 2022 44th Annual International Conference of the IEEE Engineering in Medicine & Biology Society (EMBC), 480 [Google Scholar]
- Gupta, R., Srijith, P. K., & Desai, S. 2022, Astron. Comput., 38, 100543 [NASA ADS] [CrossRef] [Google Scholar]
- Han, K., Xiao, A., Wu, E., et al. 2021, in Advances in Neural Information Processing Systems, 34, eds. M. Ranzato, A. Beygelzimer, Y. Dauphin, P. Liang, & J. W. Vaughan (Curran Associates, Inc.), 15908 [Google Scholar]
- He, Y., Zhang, Y., Chen, S., & Hu, Y. 2023, in 2023 IEEE 6th Information Tech-nology,Networking,Electronic and Automation Control Conference (ITNEC), 6, 1648 [CrossRef] [Google Scholar]
- Hocking, A., Geach, J. E., Sun, Y., & Davey, N. 2017, MNRAS, 473, 1108 [Google Scholar]
- Hui, W., Robert Jia, Z., Li, H., & Wang, Z. 2022, in J. Phys. Conf. Ser., 2402, 012009 [NASA ADS] [CrossRef] [Google Scholar]
- Karpoor, P. 2022, in Am. Astron. Soc. Meeting Abstracts, 54, 201.13 [NASA ADS] [Google Scholar]
- Li, G., Xu, T., Li, L., et al. 2023, MNRAS, 523, 488 [NASA ADS] [CrossRef] [Google Scholar]
- Lintott, C. J., Schawinski, K., Slosar, A., et al. 2008, MNRAS, 389, 1179 [NASA ADS] [CrossRef] [Google Scholar]
- Paszke, A., Gross, S., Massa, F., et al. 2019, Advances in Neural Information Processing Systems, eds. H. Wallach, H. Larochelle, A. Beygelzimer, et al. (Curran Associates, Inc.), 32 [Google Scholar]
- Pedregosa, F., Varoquaux, G., Gramfort, A., et al. 2011, J. Mach. Learn. Res., 12, 2825 [Google Scholar]
- Simmons, B. D., Lintott, C., Willett, K. W., et al. 2016, MNRAS, 464, 4420 [Google Scholar]
- Tanzi, L., Audisio, A., Cirrincione, G., Aprato, A., & Vezzetti, E. 2022, Injury, 53, 2625 [CrossRef] [Google Scholar]
- van der Walt, S., Schönberger, J. L., Nunez-Iglesias, J., et al. 2014, PeerJ, 2, e453 [Google Scholar]
- Vaswani, A., Shazeer, N., Parmar, N., et al. 2017, in Advances in Neural Information Processing Systems (Curran Associates, Inc.) [Google Scholar]
- Walmsley, M., Smith, L., Lintott, C., et al. 2020, MNRAS, 491, 1554 [Google Scholar]
- Wang, W., Xie, E., Li, X., et al. 2021, in 2021 IEEE/CVF International Conference on Computer Vision (ICCV), 548 [CrossRef] [Google Scholar]
- Wei, S., Li, Y., Lu, W., et al. 2022, PASP, 134, 114508 [CrossRef] [Google Scholar]
- Wen, Z. Z., Zheng, X. Z., & An, F. X. 2014, ApJ, 787, 130 [NASA ADS] [CrossRef] [Google Scholar]
- Willett, K. W., Lintott, C. J., Bamford, S. P., et al. 2013, MNRAS, 435, 2835 [Google Scholar]
- Wolf, T., Debut, L., Sanh, V., et al. 2019, ArXiv e-prints [arXiv:1910.03771] [Google Scholar]
- Wu, H., Xiao, B., Codella, N., et al. 2021, 2021 IEEE/CVF International Conference on Computer Vision (ICCV), 22 [CrossRef] [Google Scholar]
- Yao-Yu Lin, J., Liao, S.-M., Huang, H.-J., Kuo, W.-T., & Hsuan-Min Ou O., 2021, ArXiv e-prints [arXiv:2110.01824] [Google Scholar]
- York, D. G., Adelman, J., Anderson, John E., J., et al. 2000, AJ, 120, 1579 [NASA ADS] [CrossRef] [Google Scholar]
- Yuan, L., Chen, Y., Wang, T., et al. 2021, Proceedings of the IEEE/CVF International Conference on Computer Vision (ICCV), 558 [Google Scholar]
- Zhu, X.-P., Dai, J.-M., Bian, C.-J., et al. 2019, Ap&SS, 364, 55 [NASA ADS] [CrossRef] [Google Scholar]
All Tables
Classification performance in five classes of galaxies based on the CvT-13 model.
Comparison of classification results under different levels of Gaussian noise and salt-and-pepper noise by different models.
Classification performance of five classes of galaxies based on the CvT-13 model under the Galaxy Zoo CANDELS dataset.
All Figures
|
Fig. 1 Vision Transformer (ViT) structure. |
| In the text | |
|
Fig. 2 Convolutional vision Transformer (CvT) structure. |
| In the text | |
|
Fig. 3 Images of a randomly selected galaxy from GZ2. |
| In the text | |
|
Fig. 4 Images of a cigar-shaped galaxy after rotation. |
| In the text | |
|
Fig. 5 Images of five types of galaxies selected in the Galaxy Zoo CANDELS dataset. |
| In the text | |
|
Fig. 6 ROC curves of CvT-13 in the classification of galaxies of different morphologies. |
| In the text | |
|
Fig. 7 Confusion matrix of CvT-13 in the classification of galaxies of different morphologies. |
| In the text | |
|
Fig. 8 Adding images of galaxies with different types and levels of noise. |
| In the text | |
|
Fig. 9 Images of galaxies at different resolutions. |
| In the text | |
|
Fig. 10 Visualization of CvT classification results. |
| In the text | |
Current usage metrics show cumulative count of Article Views (full-text article views including HTML views, PDF and ePub downloads, according to the available data) and Abstracts Views on Vision4Press platform.
Data correspond to usage on the plateform after 2015. The current usage metrics is available 48-96 hours after online publication and is updated daily on week days.
Initial download of the metrics may take a while.