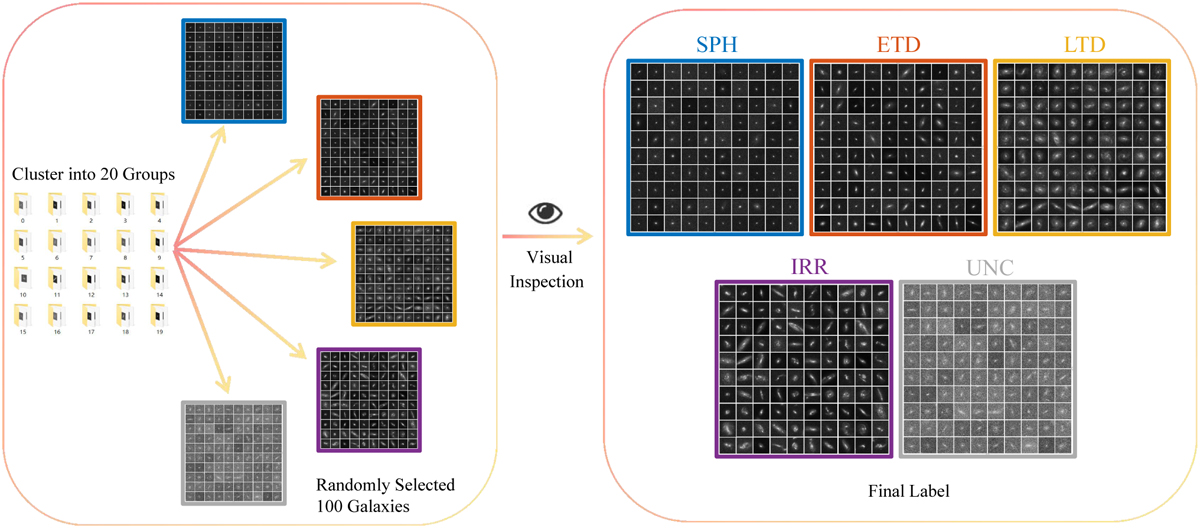
Fig. 6
Download original image
Visual categorization process diagram. From 20 machine clustering groups, we randomly selected 100 images from each group and placed them on a single canvas. Three experts voted on the classification, ultimately categorizing them into five physically meaningful categories. Within the randomly selected images, there was high similarity within each group and significant differences between different groups. This process demonstrated the high efficiency and convenience of our machine learning method, significantly saving time and effort.
Current usage metrics show cumulative count of Article Views (full-text article views including HTML views, PDF and ePub downloads, according to the available data) and Abstracts Views on Vision4Press platform.
Data correspond to usage on the plateform after 2015. The current usage metrics is available 48-96 hours after online publication and is updated daily on week days.
Initial download of the metrics may take a while.