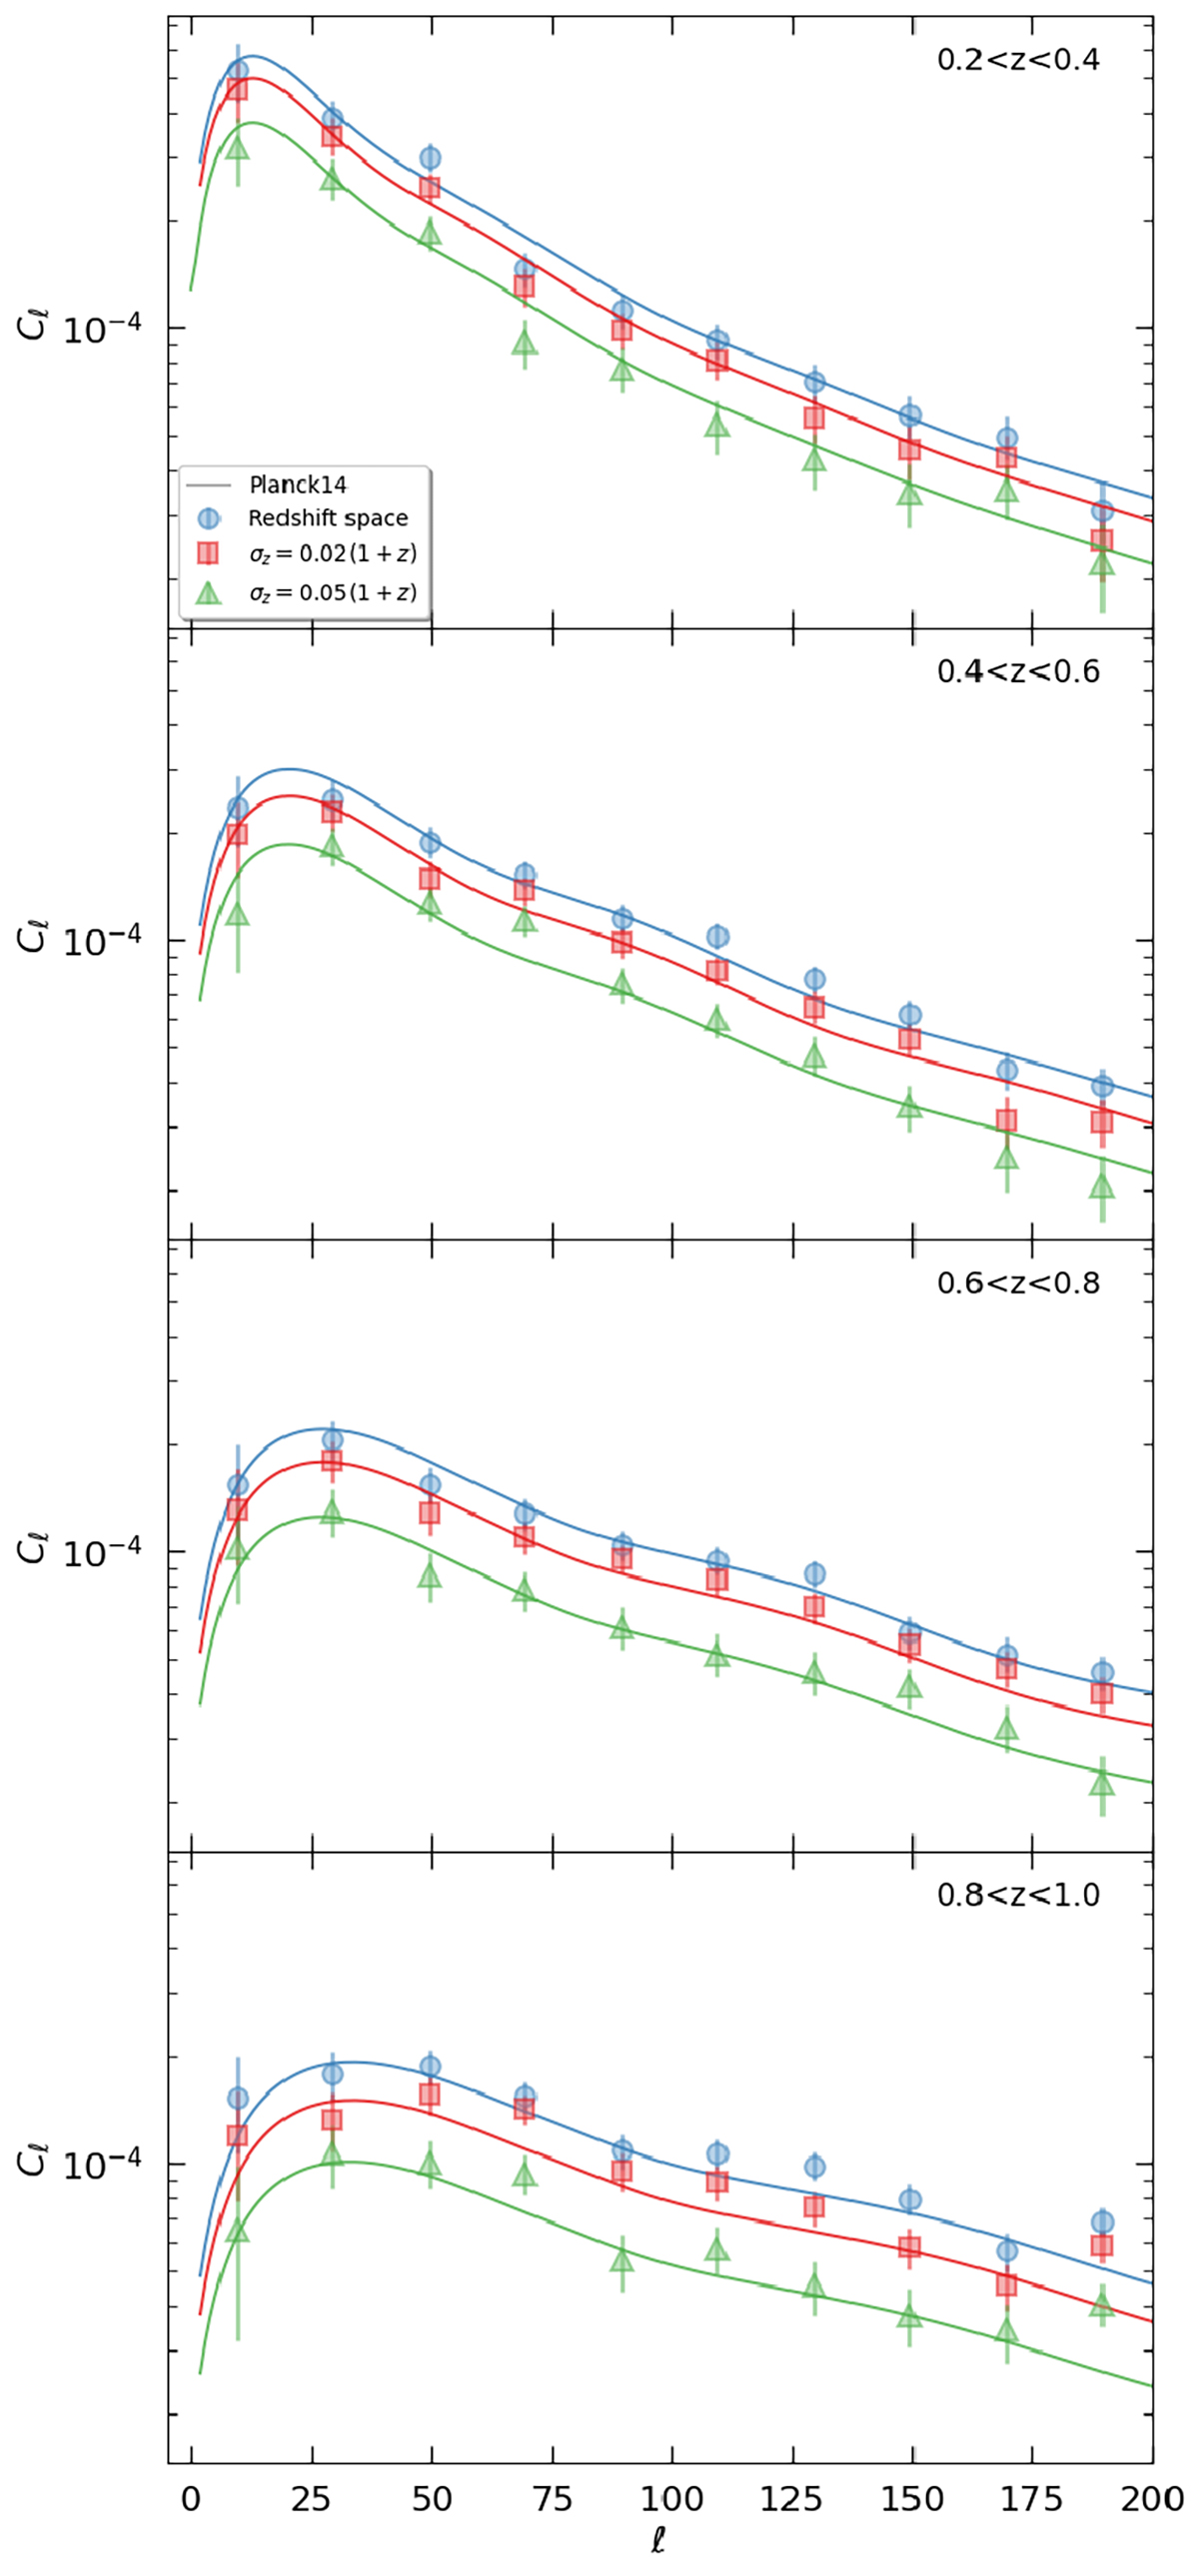
Fig. 6.
Download original image
Angular power spectrum, measured from one PINOCCHIO PLC. The errors are computed as the square root of the diagonal elements of the covariance matrix. We show results for redshift space with σz = 0 (blue circles), and photo-z space with RSDs for photo-z errors equal to σz = 0.02(1 + z) (red squares) and σz = 0.05(1 + z) (green triangles). The solid lines show the theoretical angular power spectrum, computed from the power spectrum estimated with CAMB, assuming a linear model with ΣNL = 0 (i.e. without non-linear damping effects at the BAO scale). They include RSDs, and their colours correspond to the photo-z damping indicated by the symbols.
Current usage metrics show cumulative count of Article Views (full-text article views including HTML views, PDF and ePub downloads, according to the available data) and Abstracts Views on Vision4Press platform.
Data correspond to usage on the plateform after 2015. The current usage metrics is available 48-96 hours after online publication and is updated daily on week days.
Initial download of the metrics may take a while.