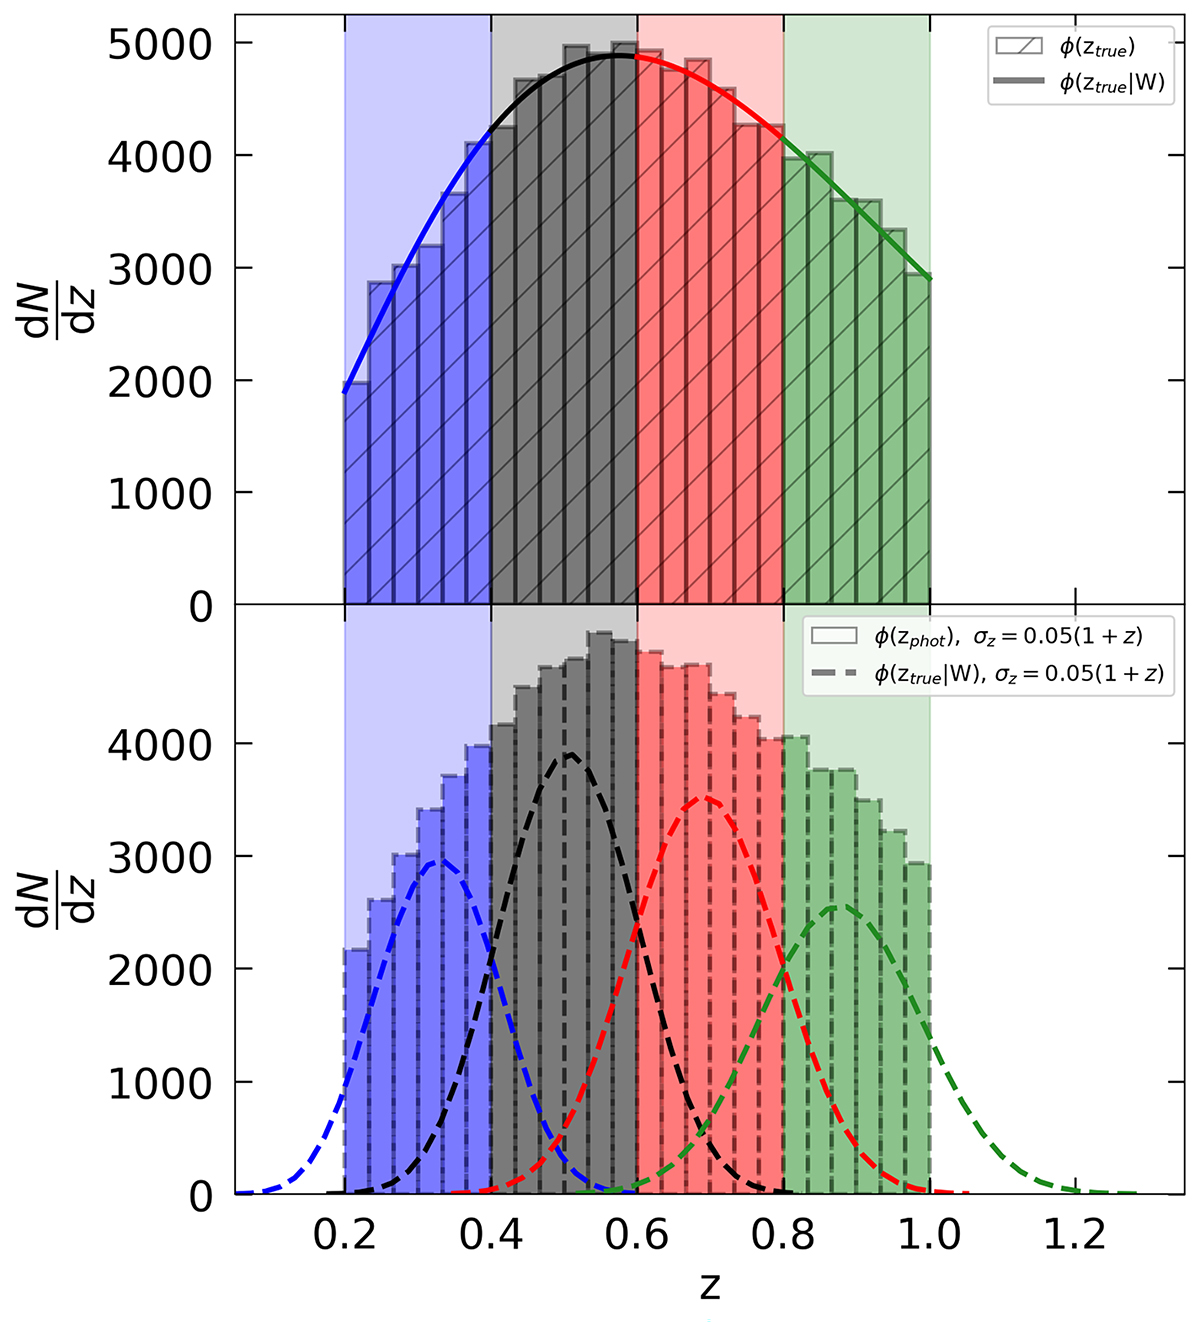
Fig. 5.
Download original image
Redshift distribution of dark matter haloes, dN/dz, from a single realisation of PINOCCHIO PLC, with an angular radius of approximately 60 deg, in the redshift range 0.2 < z < 1.0. The coloured hatched histogram represented with a solid line shows the real-space redshift distribution, while the dashed histogram shows the photometric distribution, after the introduction of a Gaussian perturbation with σz = 0.05(1 + z). The light shaded regions give the limits of the photometric redshift bins of our tomographic analysis, with Δz = 0.2. The solid line gives the true dN/dz in the window function W, derived by integrating the halo mass function of Despali et al. (2016), assuming the cosmological parameters of the simulation. The dashed lines are derived through Eq. (38) and show the expected halo distribution in the ith redshift bin, selected by W.
Current usage metrics show cumulative count of Article Views (full-text article views including HTML views, PDF and ePub downloads, according to the available data) and Abstracts Views on Vision4Press platform.
Data correspond to usage on the plateform after 2015. The current usage metrics is available 48-96 hours after online publication and is updated daily on week days.
Initial download of the metrics may take a while.