Fig. 4.
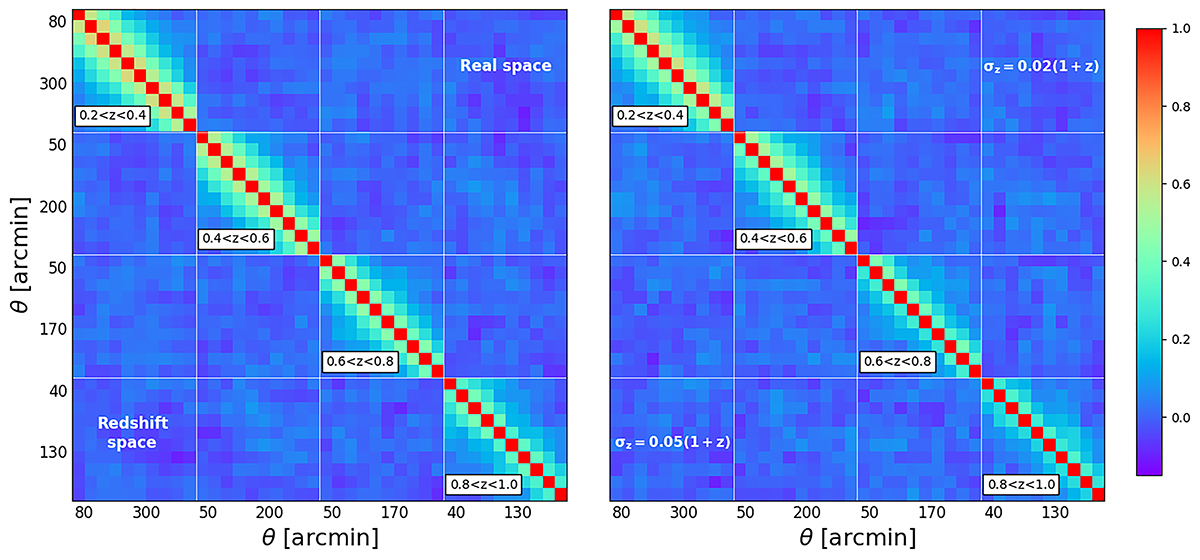
Download original image
Numerical correlation matrices of the angular two-point correlation function derived from 1000 PLCs (see colour-bar on the right). Left: results for real space (upper triangle) and redshift space, with σz = 0 (lower triangle). Right: results in photo-z space, where RSDs are included, for photo-z errors given by σz = 0.02(1 + z) (upper triangle) and σz = 0.05(1 + z) (lower triangle). In each panel the horizontal and vertical white solid lines separate the cross-correlation sub-matrices measured between different redshift bins.
Current usage metrics show cumulative count of Article Views (full-text article views including HTML views, PDF and ePub downloads, according to the available data) and Abstracts Views on Vision4Press platform.
Data correspond to usage on the plateform after 2015. The current usage metrics is available 48-96 hours after online publication and is updated daily on week days.
Initial download of the metrics may take a while.