Fig. B.2.
Download original image
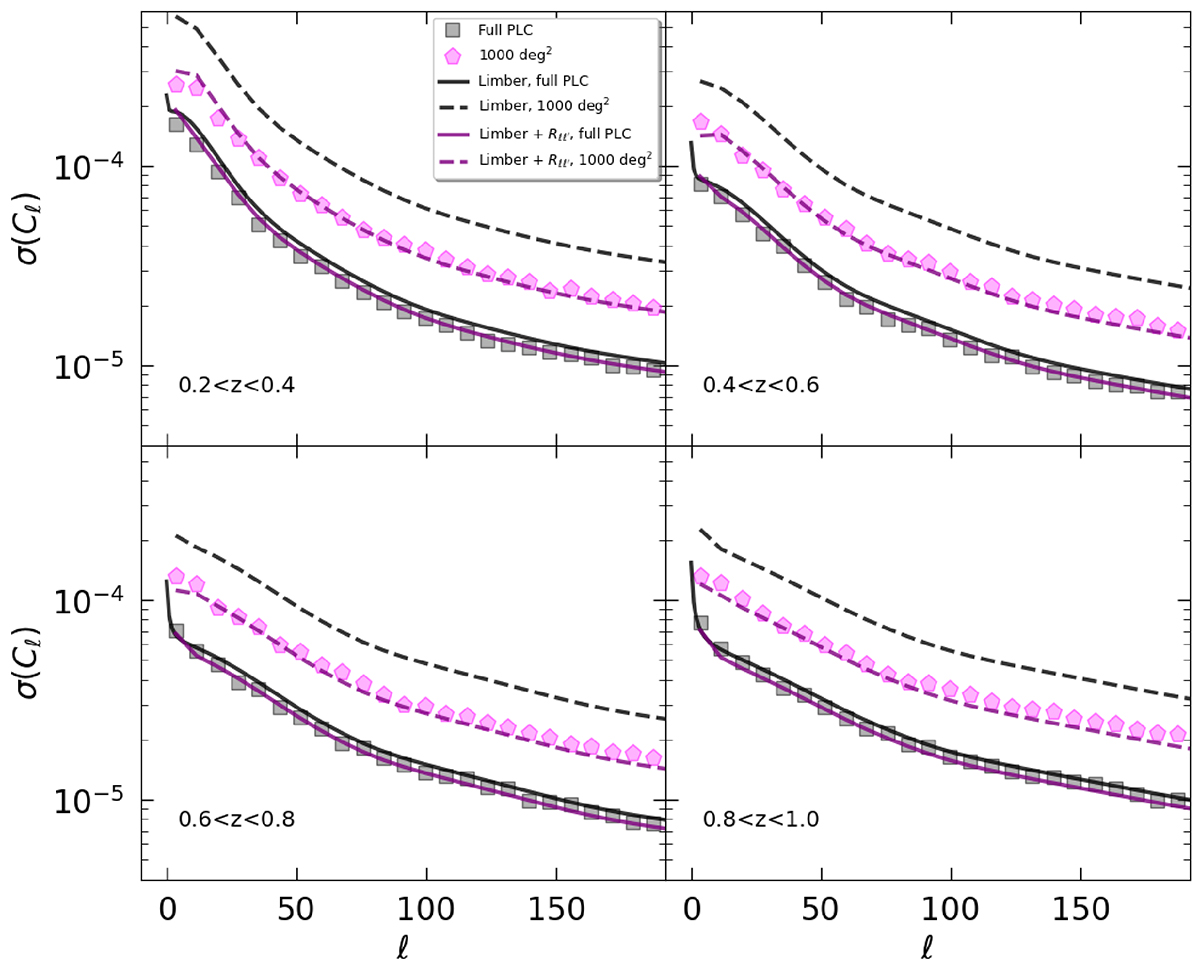
Comparison between diagonal and non-diagonal errors on the real-space angular power spectrum, Cℓ, in different redshift bins. Grey squares and magenta pentagons are measured from the set of mocks, with the full PLCs sky coverage and with its 1000 deg2 subregions, respectively. The black lines are computed through the Limber approximation, with the diagonal ![]() boost factor. The purple lines account for the mode-mode coupling induced by the mixing matrix, Rℓ, ℓ′. Solid lines refer to the full PLCs sky coverage, while dashed lines refer to 1000 deg2 subregions.
boost factor. The purple lines account for the mode-mode coupling induced by the mixing matrix, Rℓ, ℓ′. Solid lines refer to the full PLCs sky coverage, while dashed lines refer to 1000 deg2 subregions.
Current usage metrics show cumulative count of Article Views (full-text article views including HTML views, PDF and ePub downloads, according to the available data) and Abstracts Views on Vision4Press platform.
Data correspond to usage on the plateform after 2015. The current usage metrics is available 48-96 hours after online publication and is updated daily on week days.
Initial download of the metrics may take a while.