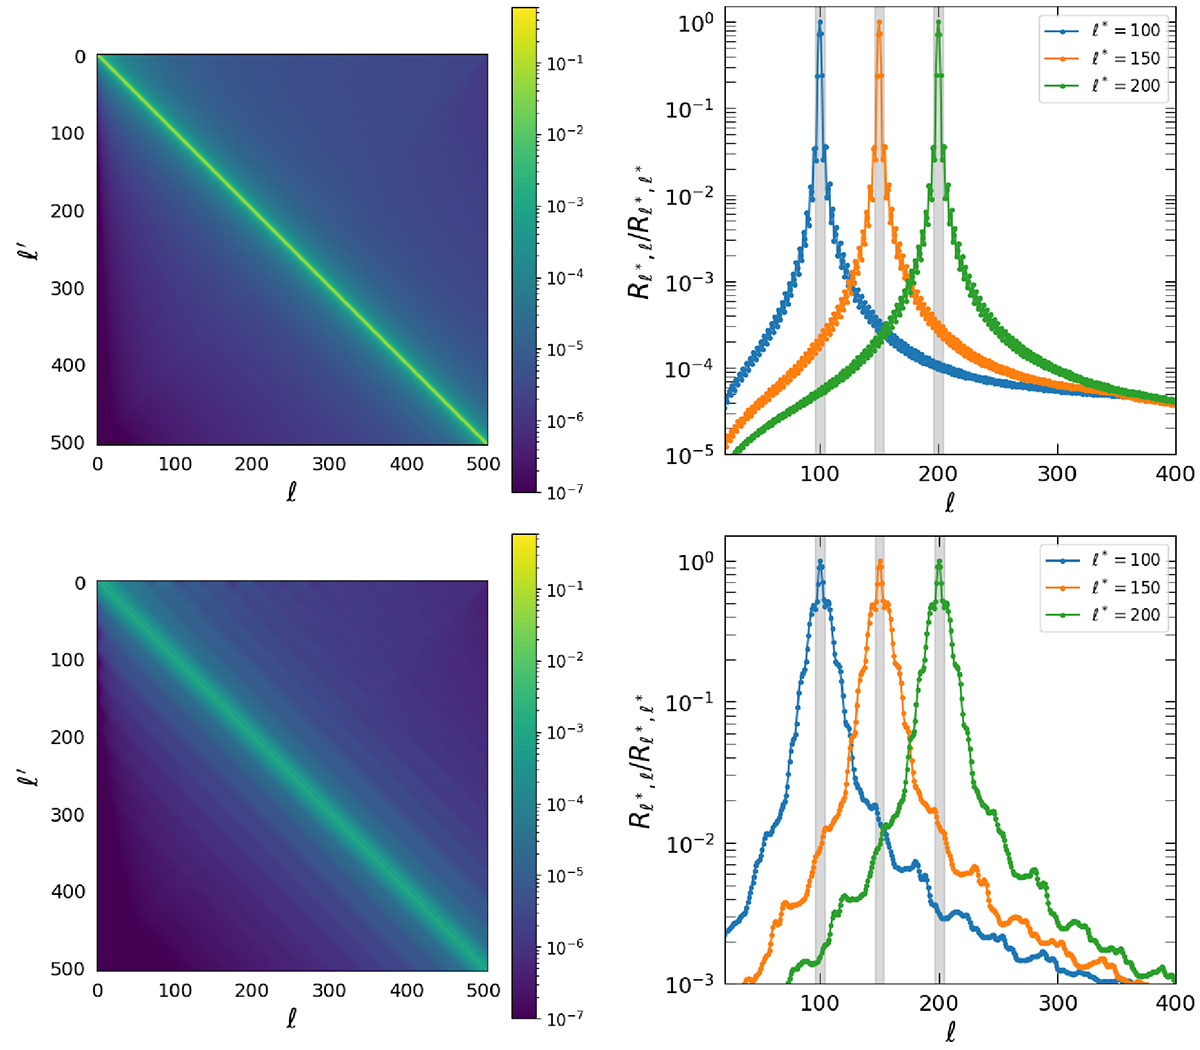
Fig. A.1.
Download original image
Mixing matrices for different sky coverages. Left panels: Colour plots of the mixing matrix, Rℓℓ′, computed up to ℓ = 500 with the public code NAMASTER (Alonso et al. 2019). Right panels: Plots of Rℓℓ*/Rℓ*ℓ*, centred in three different multipoles, at ℓ = 100 (blue), 150 (orange) and 200 (green). They quantify the mode-mode coupling related to the partial sky coverage, reflecting the blurring of the mixing matrix along the diagonal. The grey shaded regions indicate the multipole range of Δℓ in which we bin our measurements. The top panels are computed from the 10313 deg2 region covered by the full PINOCCHIO footprint mask, while at the bottom we focus on the 1004 deg2 subregion.
Current usage metrics show cumulative count of Article Views (full-text article views including HTML views, PDF and ePub downloads, according to the available data) and Abstracts Views on Vision4Press platform.
Data correspond to usage on the plateform after 2015. The current usage metrics is available 48-96 hours after online publication and is updated daily on week days.
Initial download of the metrics may take a while.