Fig. 1.
Download original image
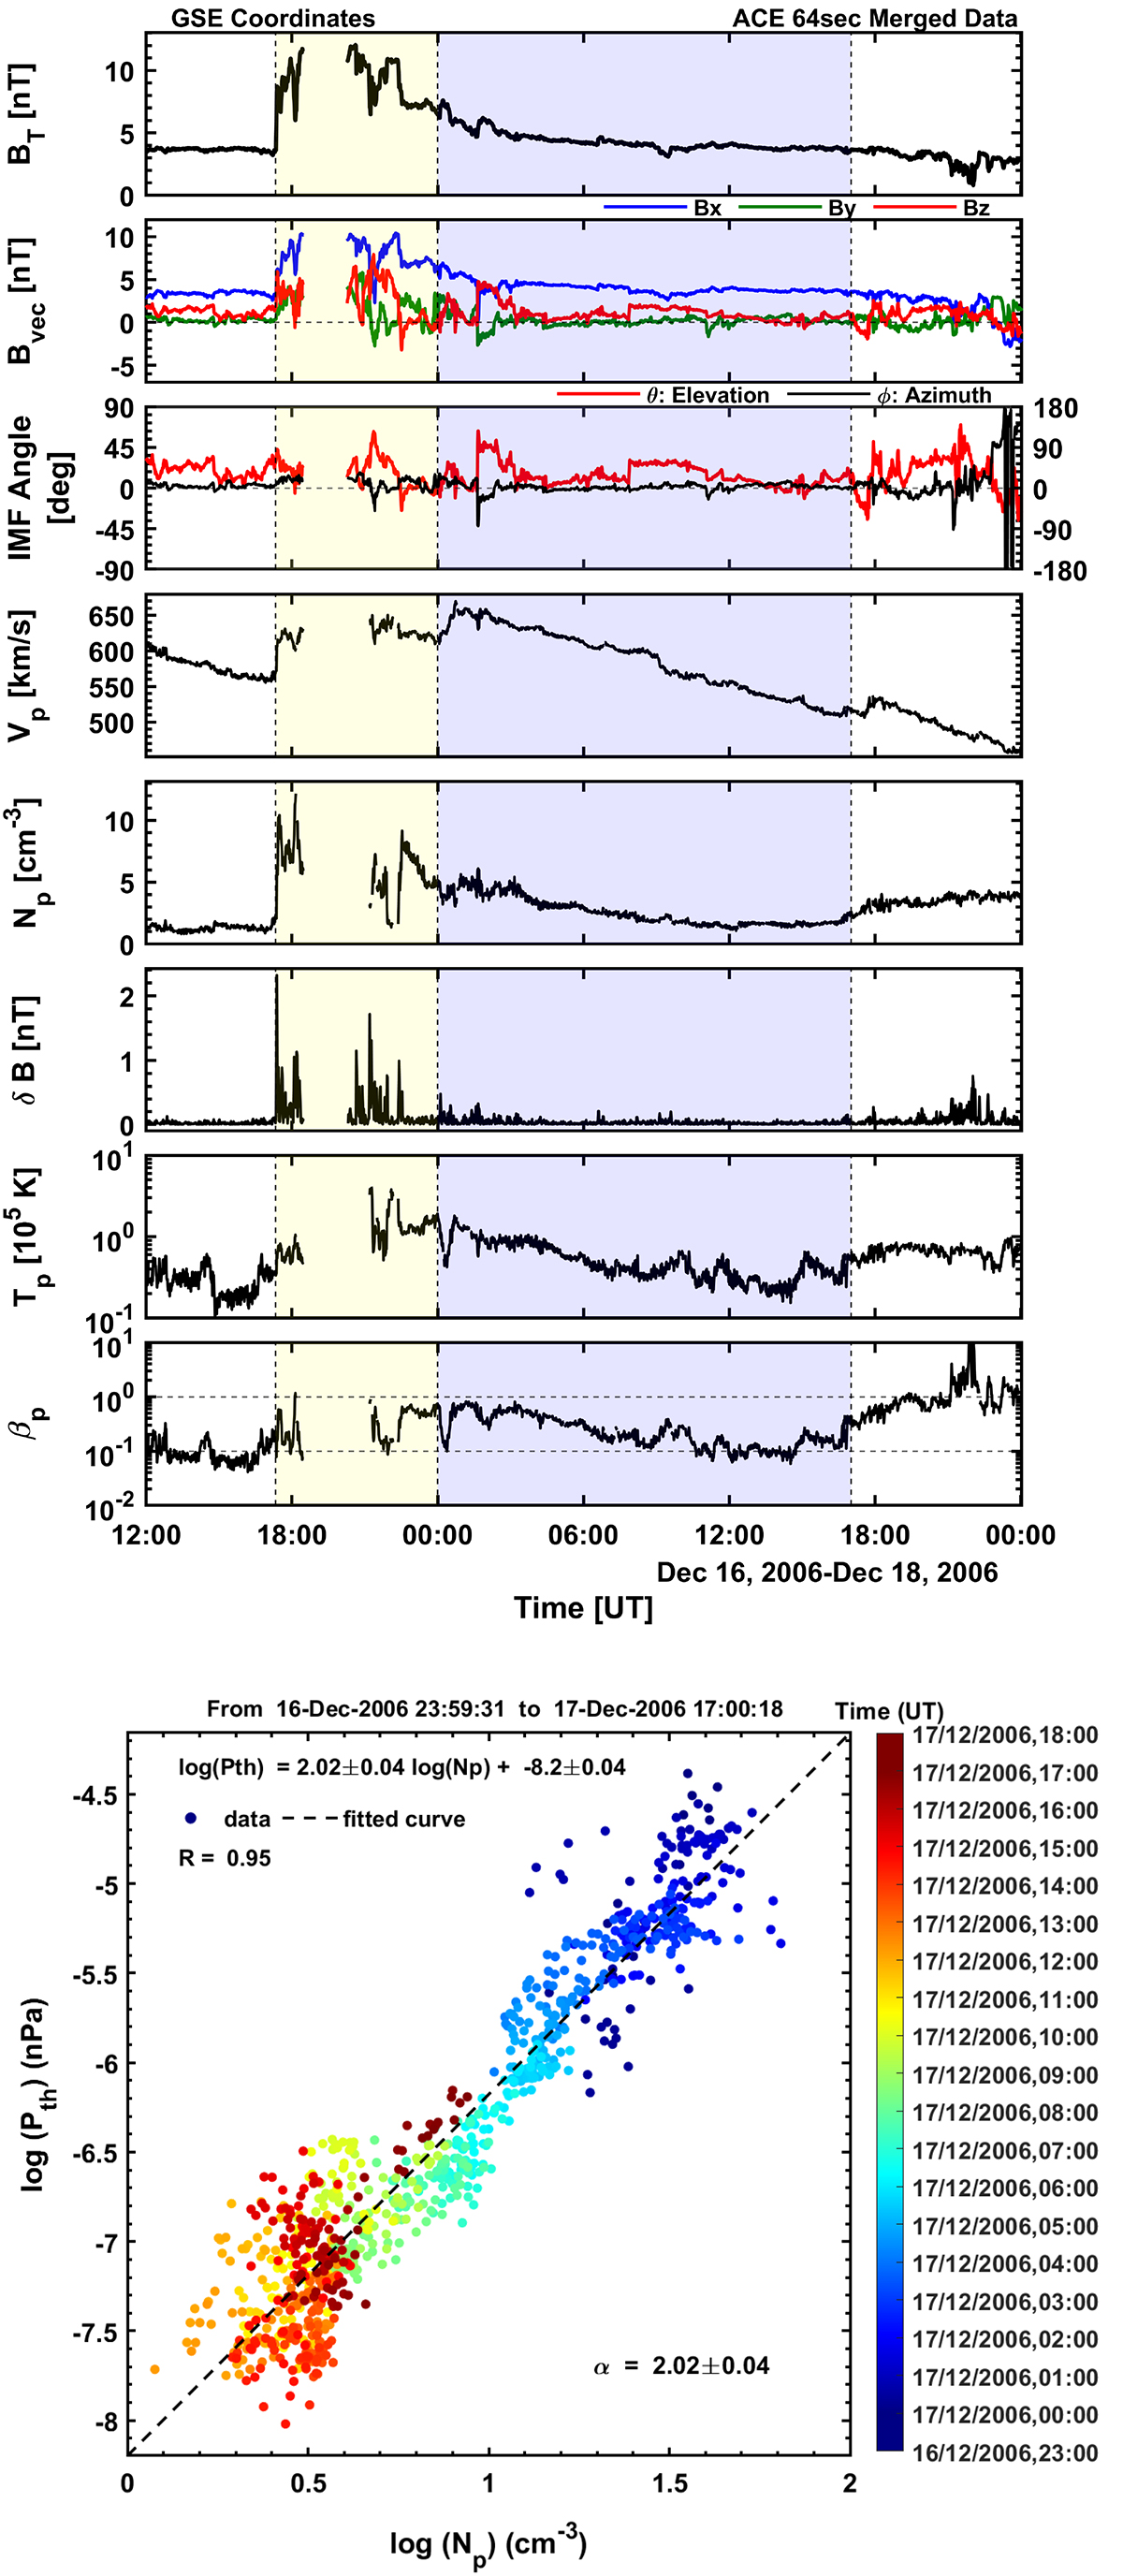
ICME event observed by ACE from December 16 to December 17, 2006. Upper panel, from top to bottom: Temporal variation in the total IMF (the interplanetary magnetic field) BT, IMF vector Bvec = (Bx, By, Bz), azimuthal (ϕ = tan−1(By/Bx)) and elevation (![]() ) angles of the IMF in the Geocentric Solar Ecliptic coordinate system, solar wind speed (Vp), proton number density (Np), magnetic fluctuation (δB(t) = |B(t + Δt)−B(t − Δt)|/2), plasma temperature (Tp), and proton beta (βp). The first vertical black line marks the ICME shock onset. The yellow-shaded region highlights the ICME sheath, while the blue-shaded region indicates the MO. Lower panel: log Pth versus log Np for plasma protons within the MO region. The coloured circles represent data points (colour-coded according to their observation time), and the dashed black line gives a linear fitting value.
) angles of the IMF in the Geocentric Solar Ecliptic coordinate system, solar wind speed (Vp), proton number density (Np), magnetic fluctuation (δB(t) = |B(t + Δt)−B(t − Δt)|/2), plasma temperature (Tp), and proton beta (βp). The first vertical black line marks the ICME shock onset. The yellow-shaded region highlights the ICME sheath, while the blue-shaded region indicates the MO. Lower panel: log Pth versus log Np for plasma protons within the MO region. The coloured circles represent data points (colour-coded according to their observation time), and the dashed black line gives a linear fitting value.
Current usage metrics show cumulative count of Article Views (full-text article views including HTML views, PDF and ePub downloads, according to the available data) and Abstracts Views on Vision4Press platform.
Data correspond to usage on the plateform after 2015. The current usage metrics is available 48-96 hours after online publication and is updated daily on week days.
Initial download of the metrics may take a while.