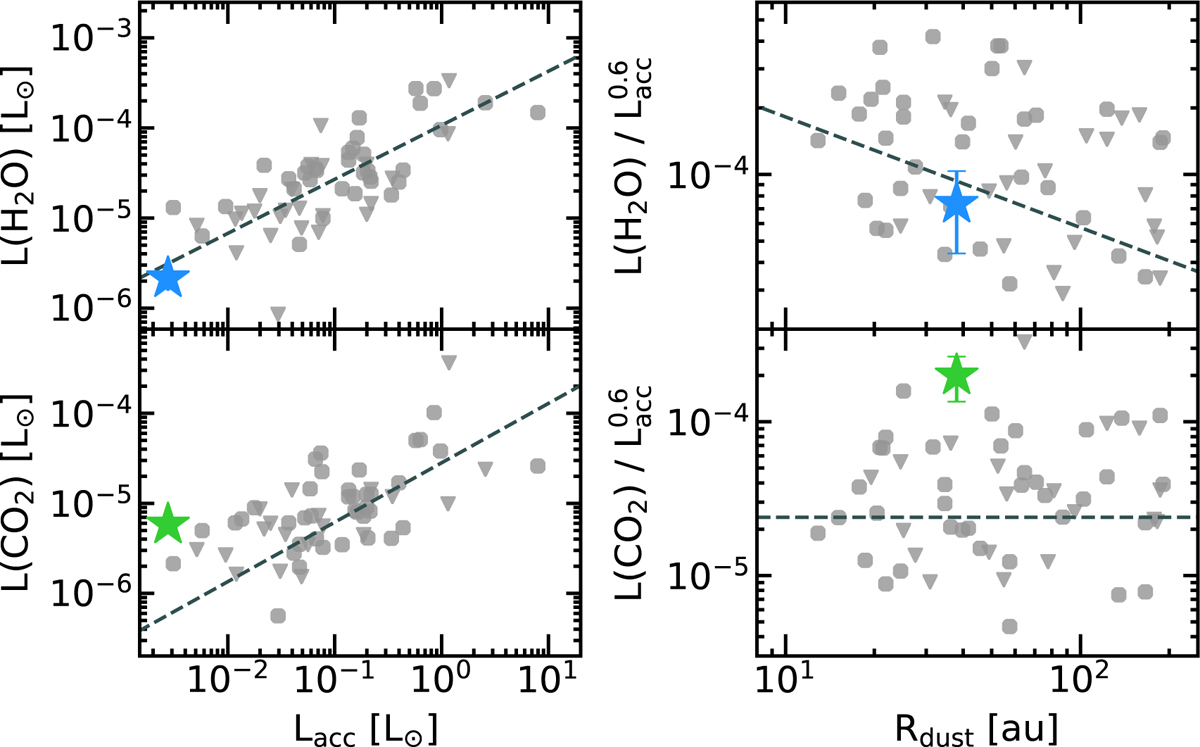
Fig. 7
Download original image
Comparison of the CO2 and H2O luminosities derived for CX Tau (green and blue stars, respectively) to the data shown in Banzatti et al. (2020) (shown in gray). The left panels show the H2O and CO2 luminosities as a function of accretion luminosity. The right panels show the H2O and CO2 luminosities corrected for the correlation with accretion luminosity as a function of dust radius. The reported correlation between the H2O luminosity and the dust radius from Banzatti et al. (2020) is shown in the top panel, and the median CO2 luminosity is shown in the bottom panel (both shown in a gray dashed line). We note that the measurements from our data on both plots contain 1σ error bars, but these do not exceed the marker size in the left panel.
Current usage metrics show cumulative count of Article Views (full-text article views including HTML views, PDF and ePub downloads, according to the available data) and Abstracts Views on Vision4Press platform.
Data correspond to usage on the plateform after 2015. The current usage metrics is available 48-96 hours after online publication and is updated daily on week days.
Initial download of the metrics may take a while.