Fig. 6

Download original image
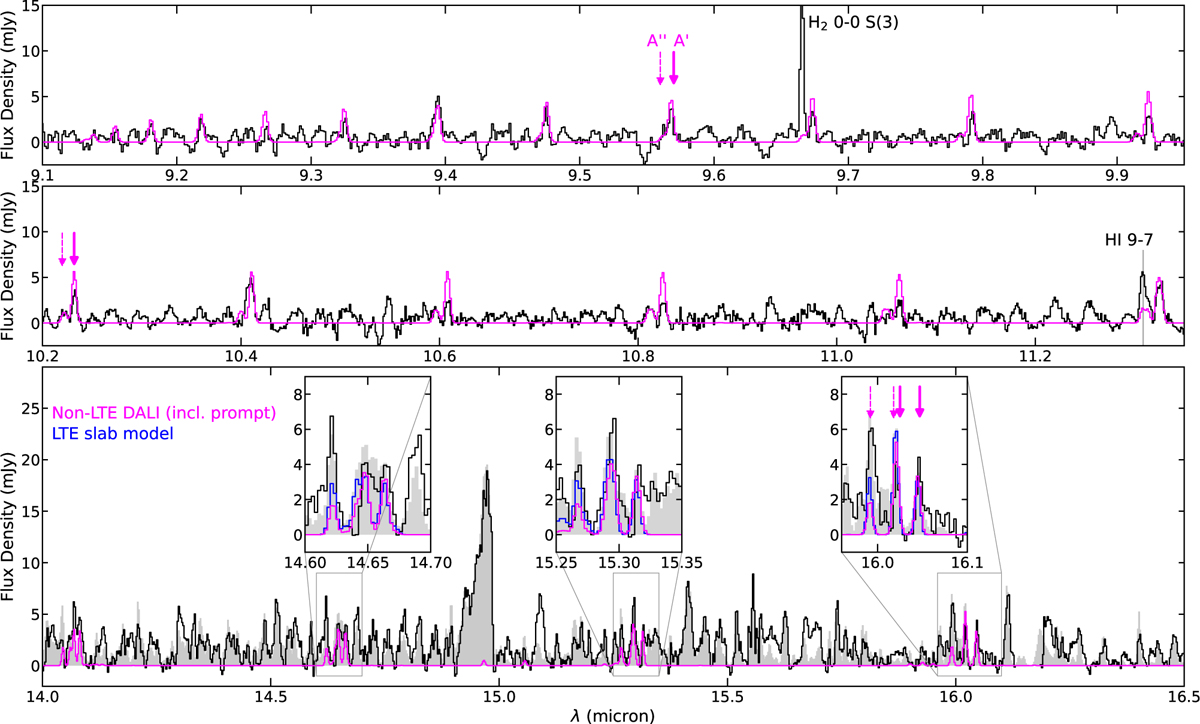
Zoom-ins of the CX Tau spectrum (black) from 9–16.5 µm, demonstrating the potential detection of OH prompt emission. The first two panels show close-ups of the 9–11 µm region, with a non-LTE DALI model from Tabone et al. (2024) (which includes both prompt emission due to photodissociation of H2O and thermal excitation) shown in pink. The third panel shows the contributions of all slab models fit in the 13.5–17.5 µm region in gray (including OH). The DALI model is overlayed in pink. An artifact around 16.15 µm has been masked. The insets in this panel show close-ups of this model contrasted with the best-fit OH LTE slab model which is shown in blue. Lines belonging to the A′ symmetry are indicated with thick, solid pink arrows and lines belonging to the A'' symmetry are indicated with thin, dashed pink arrows.
Current usage metrics show cumulative count of Article Views (full-text article views including HTML views, PDF and ePub downloads, according to the available data) and Abstracts Views on Vision4Press platform.
Data correspond to usage on the plateform after 2015. The current usage metrics is available 48-96 hours after online publication and is updated daily on week days.
Initial download of the metrics may take a while.


