Fig. B.1
Download original image
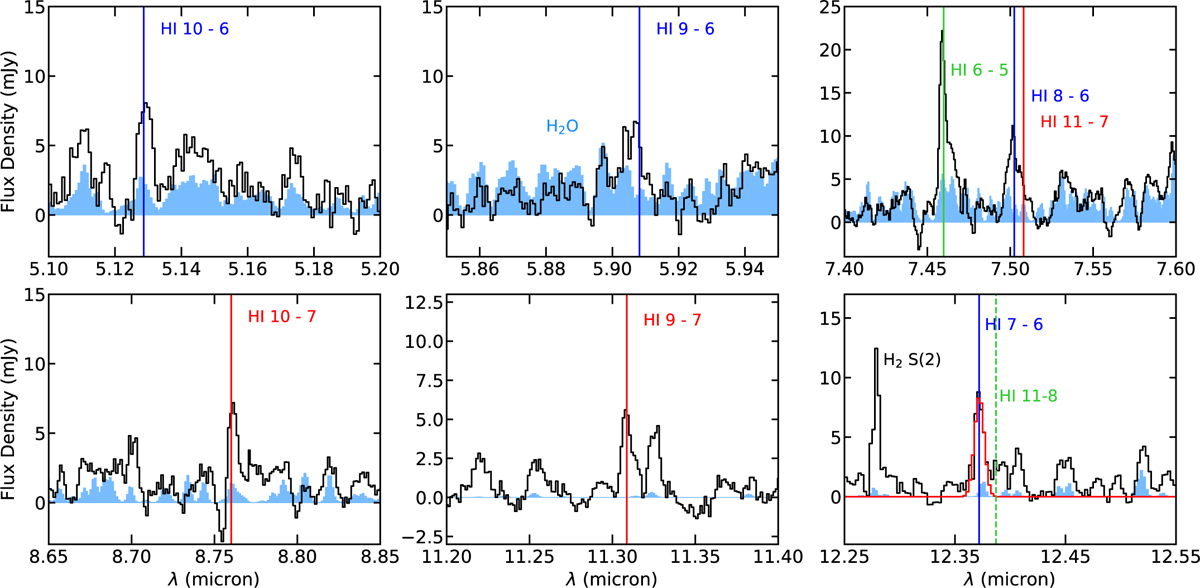
Zoom-ins of the CX Tau spectrum (black) around various possible detections of H lines. We show the best-fit ro-vibrational H2O model (the best fit to the 5.5-8.5 µm region) in all panels containing lines below 10 µm and the best-fit rotational model (the best fit to the 13.5-17.5 µm region) in all panels containing lines at longer wavelengths. These H2O slab models are shown in blue, and solid vertical lines indicate the central wavelengths of the H lines, where the nlow = 5 (Paschen) series is shown in green, the nlow = 6 (Humphreys) series is shown in blue, and the nlow = 7 series is shown in red.
Current usage metrics show cumulative count of Article Views (full-text article views including HTML views, PDF and ePub downloads, according to the available data) and Abstracts Views on Vision4Press platform.
Data correspond to usage on the plateform after 2015. The current usage metrics is available 48-96 hours after online publication and is updated daily on week days.
Initial download of the metrics may take a while.