Fig. A.6
Download original image
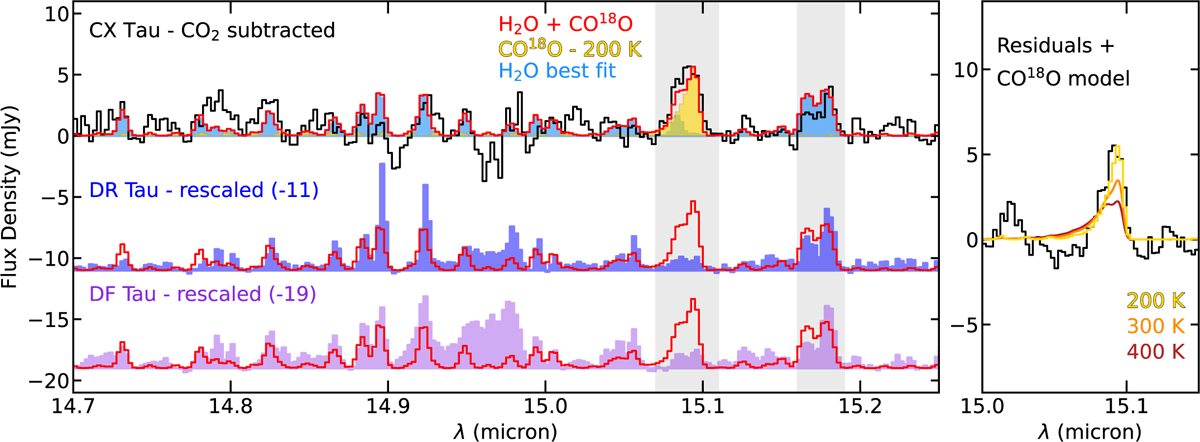
Zoom-in of the CX Tau spectrum around the 15.07 µm feature which stands out in our residuals in Fig. A.1. Left: The CX Tau spectrum with the best-fit CO2 model subtracted is shown in black, the best-fit H2O model is shown in light blue, a 200 K, N = 1016 cm−2 CO18O model shown in yellow and the combined H2O and CO18O model is shown in red. The spectra of DR Tau and DF Tau (Temmink et al. 2024a,b; Grant et al. 2024), rescaled to the 15.17 µm H2O feature in CX Tau, are shown in dark blue and purple, respectively. Right: The CX Tau spectrum with all best-fit models (12CO2,13CO2, H2O, C2H2, HCN, and OH) subtracted is shown in black. Three CO18O models with N = 1016 cm−2 and different temperatures are shown in yellow, orange, and brown.
Current usage metrics show cumulative count of Article Views (full-text article views including HTML views, PDF and ePub downloads, according to the available data) and Abstracts Views on Vision4Press platform.
Data correspond to usage on the plateform after 2015. The current usage metrics is available 48-96 hours after online publication and is updated daily on week days.
Initial download of the metrics may take a while.