Fig. A.2
Download original image
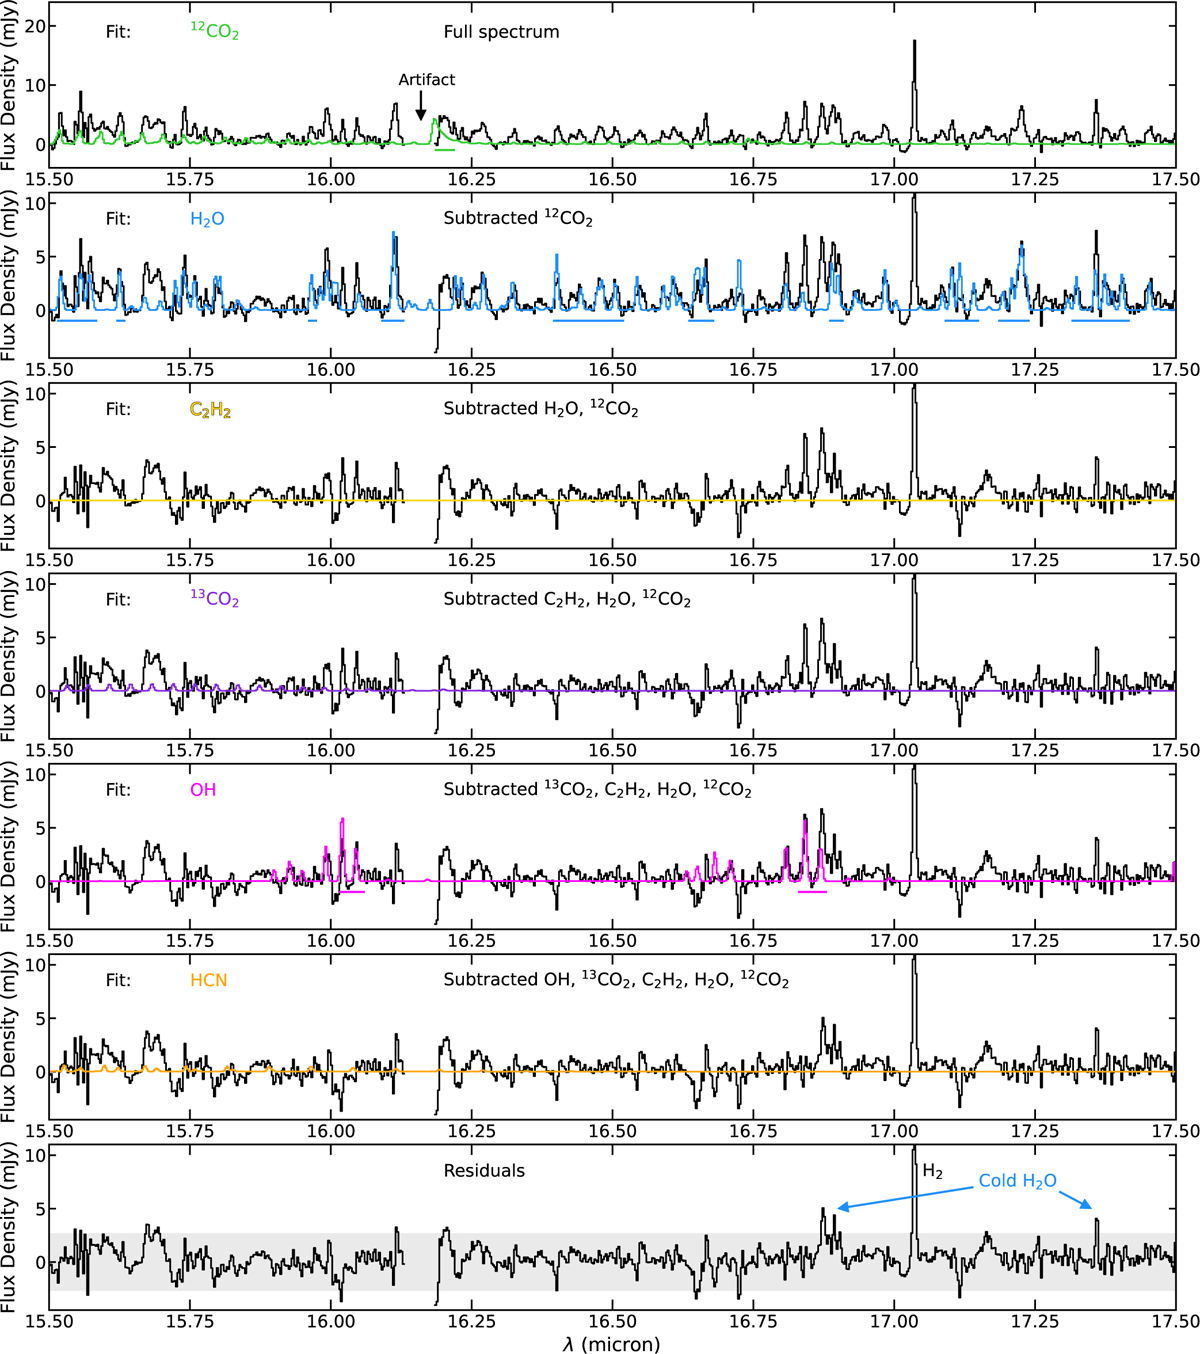
Zoom-in of the 15.5-17.5 µm region of the CX Tau spectrum (black), where all individual slab model fits are shown. Horizontal bars indicate which spectral windows were used for the χ2 fit, and each panel indicates which other models were removed from the spectrum before the fit was performed, to avoid contamination from other molecules. The final panel shows the residuals after all fits are subtracted, with the shaded region indicating that most residuals fall below 3σ. An artifact around 16.15 µm has been masked in all panels. We also note the difference in scale on the y axis between the top panel and the rest.
Current usage metrics show cumulative count of Article Views (full-text article views including HTML views, PDF and ePub downloads, according to the available data) and Abstracts Views on Vision4Press platform.
Data correspond to usage on the plateform after 2015. The current usage metrics is available 48-96 hours after online publication and is updated daily on week days.
Initial download of the metrics may take a while.