Open Access
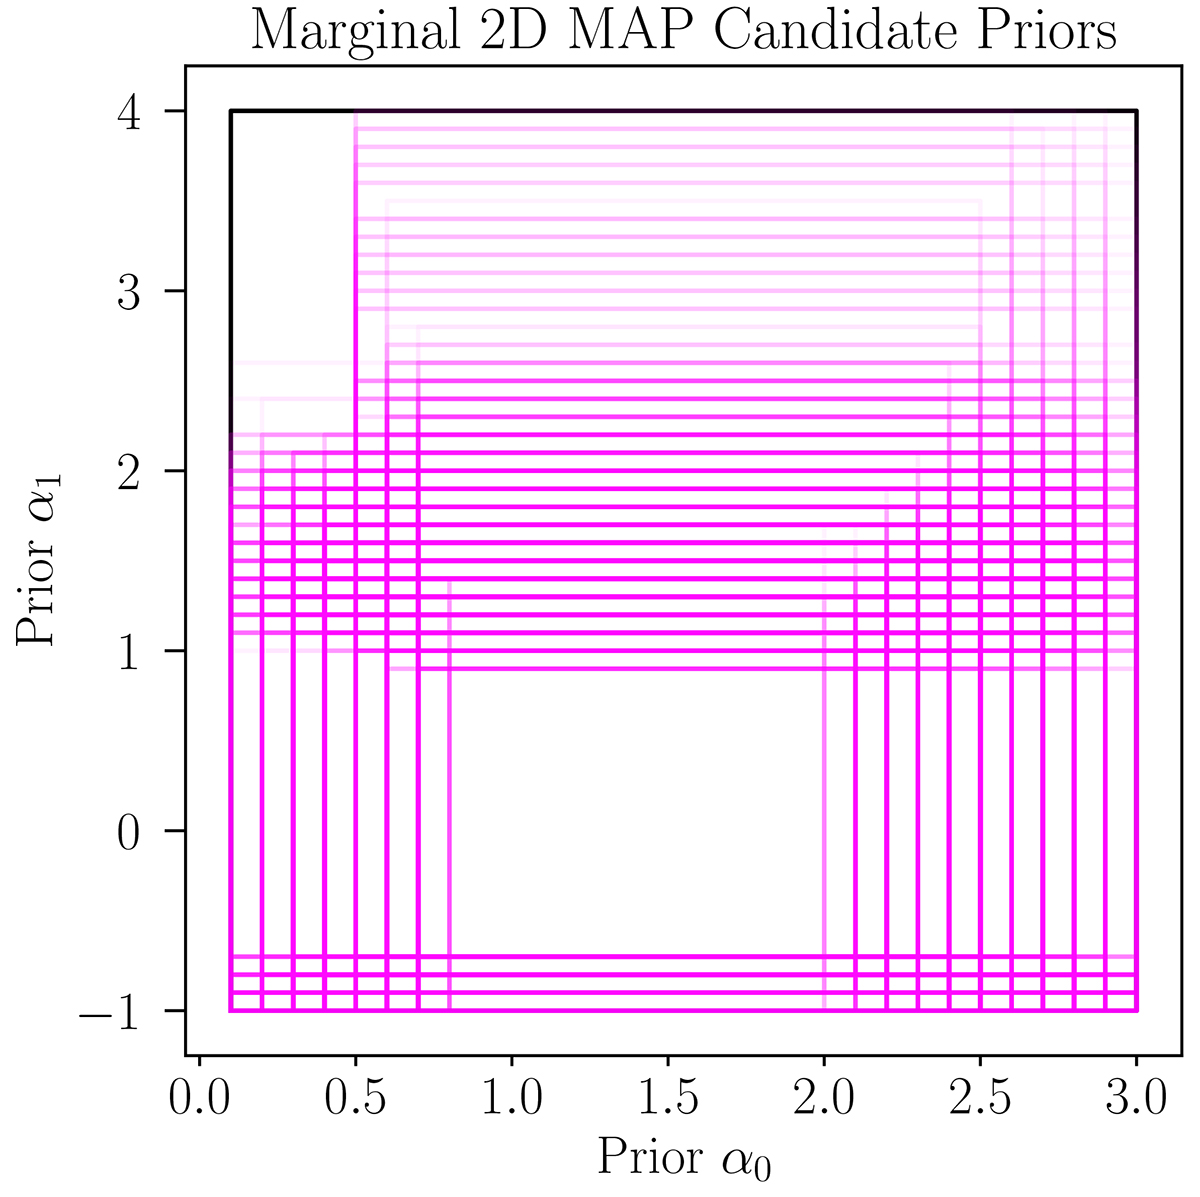
Fig. 8.
Download original image
Distribution of the candidate priors for the α model that pass the first filter. Each rectangle represents a combination of lower and upper bounds of α0 and α1.
Current usage metrics show cumulative count of Article Views (full-text article views including HTML views, PDF and ePub downloads, according to the available data) and Abstracts Views on Vision4Press platform.
Data correspond to usage on the plateform after 2015. The current usage metrics is available 48-96 hours after online publication and is updated daily on week days.
Initial download of the metrics may take a while.