Open Access
Fig. C.3.
Download original image
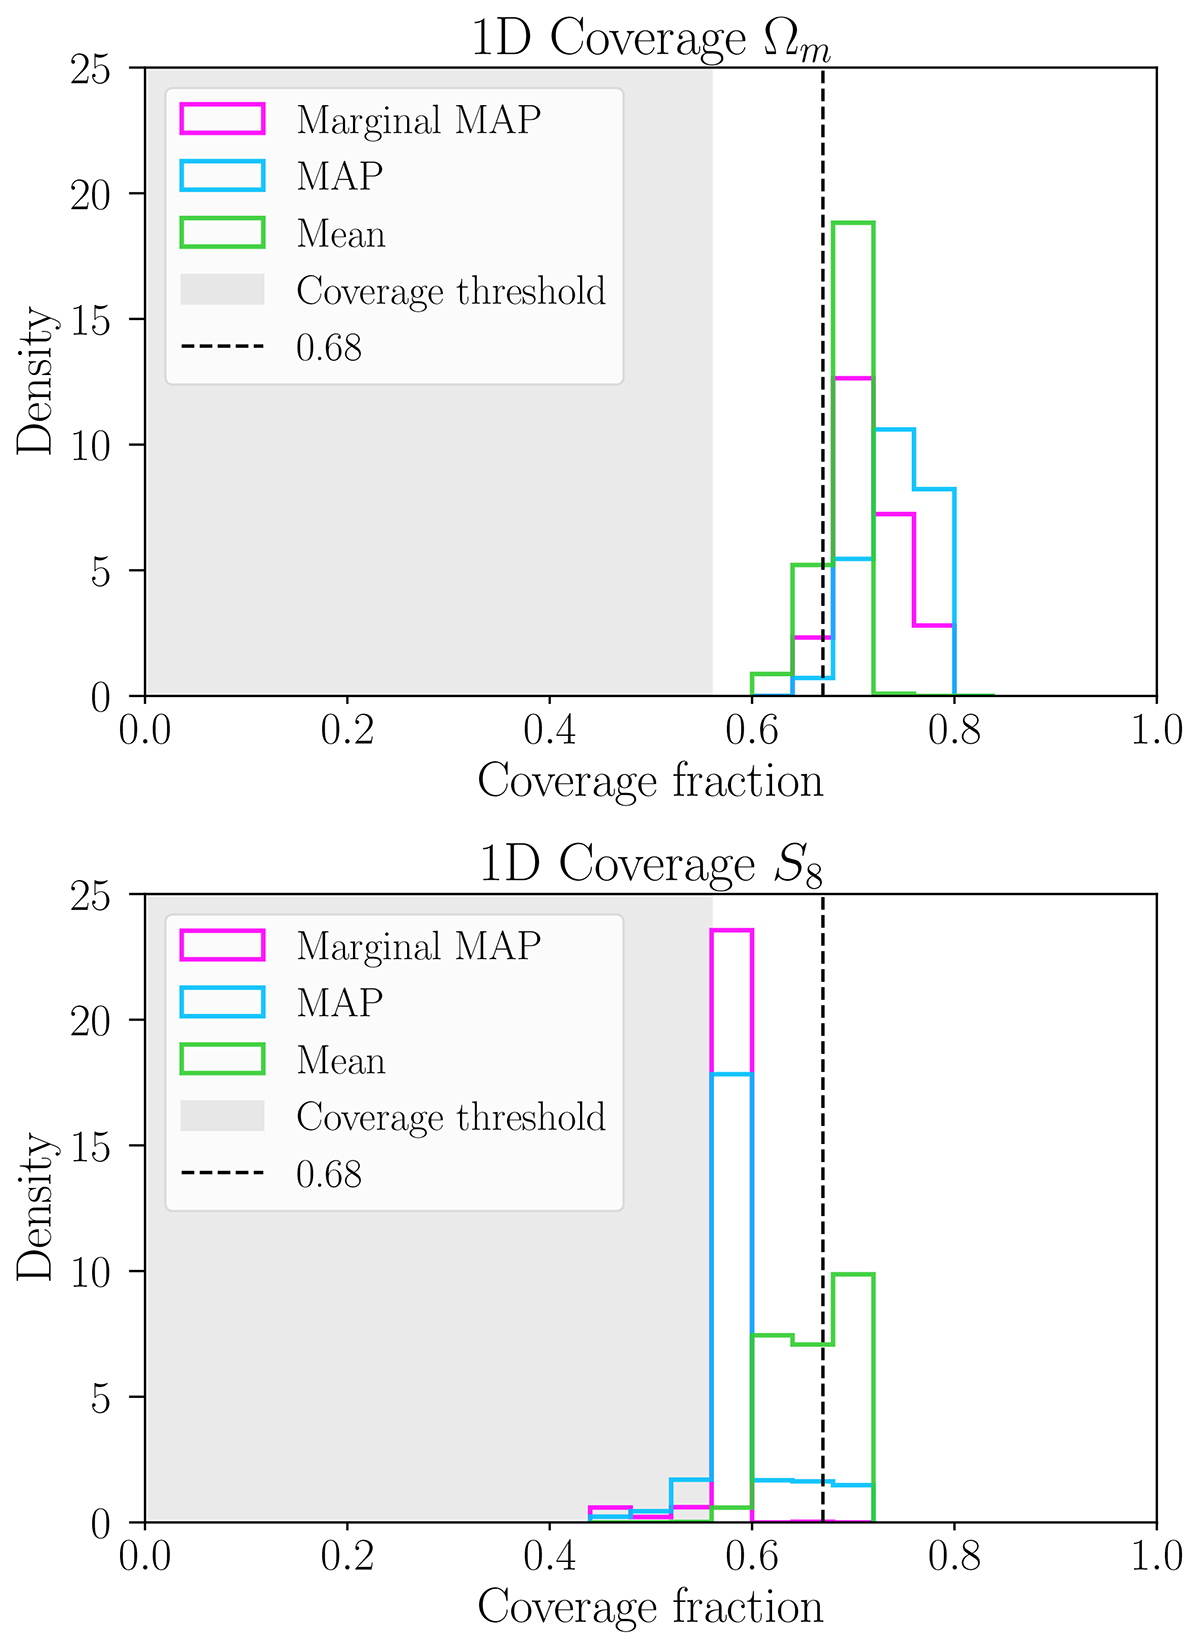
One-dimensional coverages for the candidate priors that passed the filter 1 for the different point estimators. In the upper panel we show the 1D coverage on Ωm, while in the lower panel, we display the 1D coverage on S8. The histograms have been normalized to contrast their distribution along the vertical axis.
Current usage metrics show cumulative count of Article Views (full-text article views including HTML views, PDF and ePub downloads, according to the available data) and Abstracts Views on Vision4Press platform.
Data correspond to usage on the plateform after 2015. The current usage metrics is available 48-96 hours after online publication and is updated daily on week days.
Initial download of the metrics may take a while.