Open Access
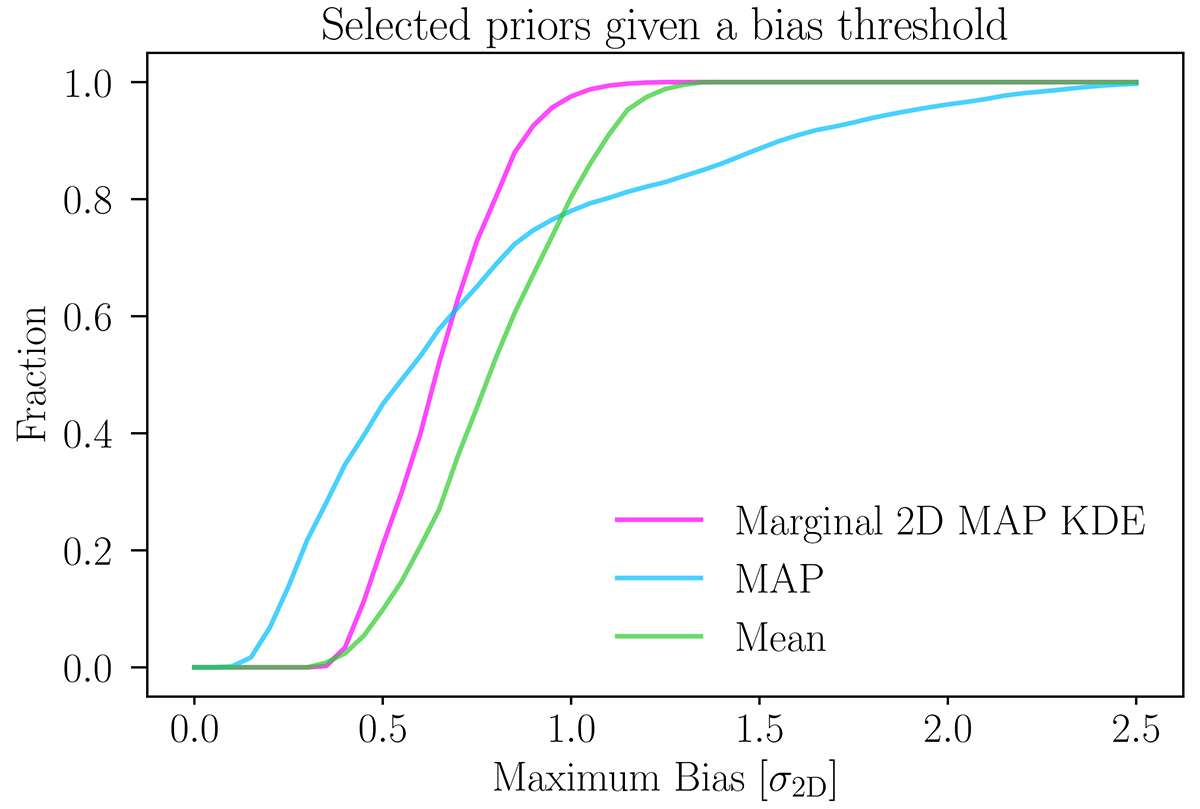
Fig. C.1.
Download original image
Fraction of the total number of priors from Sect. 3.3.1 that have a maximum bias smaller than σ2D. In magenta, light blue, and light green we show the results for the 2D marginal MAP, the MAP, and the mean estimators respectively.
Current usage metrics show cumulative count of Article Views (full-text article views including HTML views, PDF and ePub downloads, according to the available data) and Abstracts Views on Vision4Press platform.
Data correspond to usage on the plateform after 2015. The current usage metrics is available 48-96 hours after online publication and is updated daily on week days.
Initial download of the metrics may take a while.