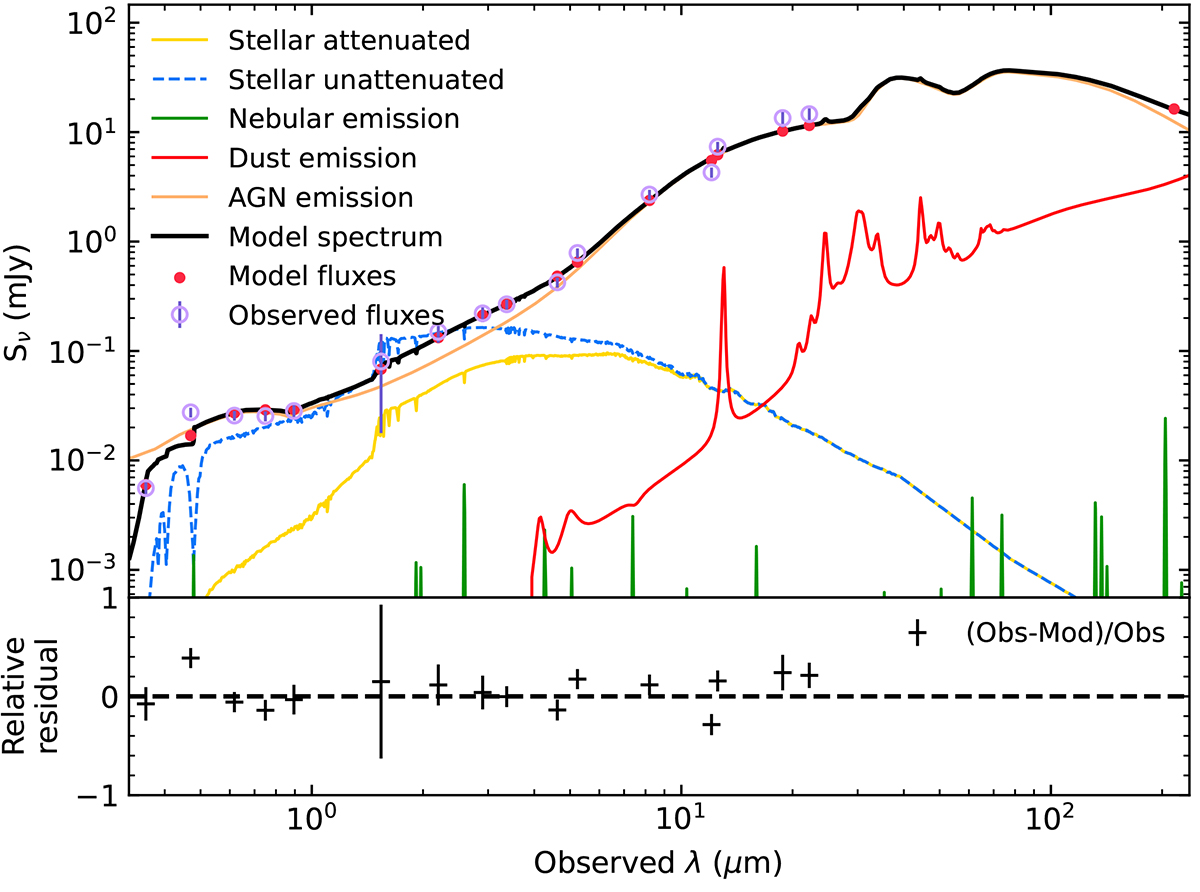
Fig. 5.
Download original image
SED fit obtained for J1652 with the CIGALE code. The observed photometry is displayed by violet circles, and model fluxes are shown as red dots, while the black curve corresponds to the model spectrum. The different components included in the fit are: dust emission (red), AGN template (orange), nebular emission lines (green), and the host galaxy contribution (shown in blue and yellow, with and without dust attenuation, respectively).
Current usage metrics show cumulative count of Article Views (full-text article views including HTML views, PDF and ePub downloads, according to the available data) and Abstracts Views on Vision4Press platform.
Data correspond to usage on the plateform after 2015. The current usage metrics is available 48-96 hours after online publication and is updated daily on week days.
Initial download of the metrics may take a while.