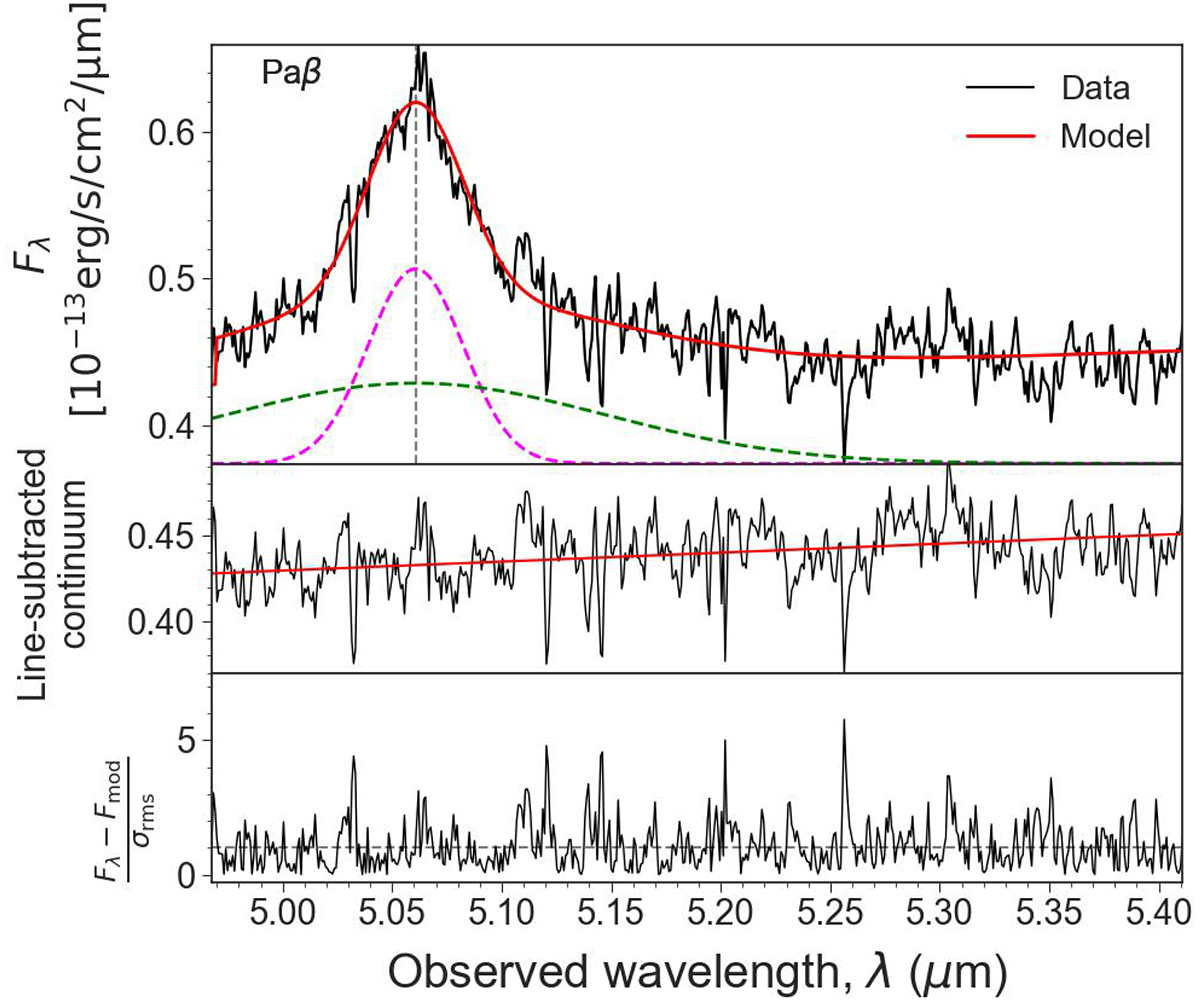
Fig. 1.

Download original image
Spectral line profile of the Paβ line. Top panel: Observed Paβ line profile (black) from MIRI MRS channel 1, extracted within a 3-kpc radius. The red line corresponds to our best-fit model (red). The two individual Gaussian components are displayed on the bottom as green and magenta dashed lines (offset from zero by an arbitrary amount). We mask a noise spike (shown in grey) shortwards of the line. Middle panel: Continuum after multi-Gaussian line subtraction. Bottom panel: χ statistic corresponding to the residuals between the model and the observed spectral profile, divided by the rms error in the continuum.
Current usage metrics show cumulative count of Article Views (full-text article views including HTML views, PDF and ePub downloads, according to the available data) and Abstracts Views on Vision4Press platform.
Data correspond to usage on the plateform after 2015. The current usage metrics is available 48-96 hours after online publication and is updated daily on week days.
Initial download of the metrics may take a while.


