| Issue |
A&A
Volume 693, January 2025
|
|
|---|---|---|
| Article Number | A144 | |
| Number of page(s) | 15 | |
| Section | Planets, planetary systems, and small bodies | |
| DOI | https://doi.org/10.1051/0004-6361/202348177 | |
| Published online | 15 January 2025 | |
Discovery of a cold giant planet and mass measurement of a hot super-Earth in the multi-planetary system WASP-132
1
Observatoire de Genève, Université de Genève,
51 Chemin Pegasi,
1290
Versoix,
Switzerland
2
Department of Physics, University of Warwick,
Gibbet Hill Road,
Coventry,
UK
3
Center for Exoplanets and Habitability, University of Warwick,
Gibbet Hill Road,
Coventry,
UK
4
Physikalisches Institut, University of Bern,
Gesellschaftsstrasse 6,
3012
Bern,
Switzerland
5
Center for Theoretical Astrophysics & Cosmology, Institute for Computational Science, University of Zurich,
Zürich,
Switzerland
6
Instituto de Astrofísica e Ciências do Espaço, Universidade do Porto, CauP, Rua das Estrelas,
4150-762
Porto,
Portugal
7
Dep. de Física e Astronomia, Faculdade de Ciências, Universidade do Porto, Rua do Campo Alegre,
4169-007
Porto,
Portugal
8
Centro de Astrobiología (CAB), CSIC-INTA, Dep. de Astrofísica,
ESAC campus,
28692
Villanueva de la Cañada (Madrid),
Spain
9
European Southern Observatory,
Karl-Schwarzschild-Strasse 3,
85748
Garching,
Germany
★ Corresponding author; This email address is being protected from spambots. You need JavaScript enabled to view it.
Received:
6
October
2023
Accepted:
25
November
2024
Abstract
Hot Jupiters generally do not have nearby planet companions, as they may have cleared out other planets during their inward migration from more distant orbits. This gives evidence that hot Jupiters more often migrate inward via high-eccentricity migration due to dynamical interactions between planets rather than more dynamically cool migration mechanisms through the protoplanetary disk. Here we further refine the unique system of WASP-132 by characterizing the mass of the recently validated 1.0-day period super-Earth WASP-132c (TOI-822.02), interior to the 7.1-day period hot Jupiter WASP-132b. Additionally, we announce the discovery of a giant planet at a 5-year period (2.7 AU). We also detected a long-term trend in the radial velocity data indicative of another outer companion. Using over nine years of CORALIE radial velocities (RVs) and over two months of highly sampled HARPS RVs, we determined the masses of the planets from smallest to largest orbital period to be Mc = 6.26−1.83+1.84 M⊕, Mb = 0.428−0.015+0.015 MJup, and Md = sin i 5.16−0.52+0.52 MJup, respectively. Using TESS and CHEOPS photometry data, we measured the radii of the two inner transiting planets to be Rc = 1.841−0.093+0.094 R⊕ and Rb = 0.901−0.038+0.038 RJup. We find a bulk density of ρc = 5.47−1.71+1.96 g cm−3 for WASP-132c, which is slightly above the Earth-like composition line on the mass-radius diagram. WASP-132 is a unique multi-planetary system in that both an inner rocky planet and an outer giant planet are in a system with a hot Jupiter. This suggests it migrated via a rarer dynamically cool mechanism and helps to further our understanding of how hot Jupiter systems form and evolve.
Key words: planets and satellites: detection / planets and satellites: dynamical evolution and stability / planets and satellites: fundamental parameters
© The Authors 2025
 Open Access article, published by EDP Sciences, under the terms of the Creative Commons Attribution License (https://creativecommons.org/licenses/by/4.0), which permits unrestricted use, distribution, and reproduction in any medium, provided the original work is properly cited.
This article is published in open access under the Subscribe to Open model. This email address is being protected from spambots. You need JavaScript enabled to view it. to support open access publication.
1 Introduction
Some previous studies found that most hot Jupiters do not have nearby planet companions. This was based on non-detections of additional planets in radial velocity (RV) data (e.g., Wright et al. 2009) and photometry data by looking for both additional transit signals (e.g., Steffen et al. 2012; Huang et al. 2016; Hord et al. 2021) and transit-timing variations (TTVs)(e.g., Steffen et al. 2012; Wang et al. 2021; Ivshina & Winn 2022). The lack of detected planets may be a result of highly eccentric giant planets clearing out any low-mass inner planets in the system during their migration inward (Mustill et al. 2015). These results suggest that high-eccentricity migration due to dynamical interactions between planets (e.g., Rasio & Ford 1996; Weidenschilling & Marzari 1996; Lin & Ida 1997) may be a more common migration mechanism for gas giant planets compared to disk-driven migration (e.g., Goldreich & Tremaine 1980; Ward 1997; Baruteau et al. 2014).
However, Wu et al. (2023) recently searched for TTVs across the full four-year Kepler (Borucki et al. 2010) dataset and found that at least 12±6% of hot Jupiters have a nearby companion. Continued surveys and recent advances in the precision of both photometry and RV observations have allowed the detection of some of these companions, including WASP-47 (Becker et al. 2015), Kepler-730 (Zhu et al. 2018; Cañas et al. 2019), TOI-1130 (Huang et al. 2020), WASP-148 (Hébrard et al. 2020), WASP- 132 (Hord et al. 2022), and TOI-2000 (Sha et al. 2023). These companions provide strong evidence that these hot Jupiters migrated via quiescent mechanisms that are dynamically cool and allow nearby planetary companions to remain in the system.
Giant long-period planets have also been detected in systems with small close-in planets (e.g., Santos et al. 2016). Several studies have worked to determine the occurrence of long-period (≳1 year) giant (Mp ≳ 0.3MJup/95M⊕; Rp ≳ 0.45 RJup/5R⊕) planets, also known as cold Jupiters, in systems that contain close-in (≲ 100 days) small (Rp ≲ 4R⊕; Mp ≲ 30M⊕) planets. These studies have varying results with some suggesting a positive correlation between close-in small planets and cold Jupiters (e.g., Zhu & Wu 2018; Bryan et al. 2019; Herman et al. 2019; Rosenthal et al. 2022), while others find a negative correlation (e.g., Barbato et al. 2018; Bonomo et al. 2023). A positive correlation suggests that these two planet populations do not directly compete for solid material (e.g., Zhu & Wu 2018). However, multiple theories suggest a negative correlation including that the early formation of a cold Jupiter may prevent the nuclei of smaller planets from migrating inward (e.g., Izidoro et al. 2015), or that cold Jupiters may reduce the flux of material required to form close-in planets larger than Earth (e.g., Lambrechts et al. 2019). Recently, Zhu (2024) looked at the metallicity dimension of the super-Earth versus cold Jupiter correlation and found that there is a positive correlation between the two around metal-rich host stars; however, a correlation is unclear for metal-poor host stars due to a limited sample size.
Here we analyze the unique WASP-132 planetary system. WASP-132 b was first discovered by Hellier et al. (2017) who measured the planet to have a 7.1 day period, 0.41 ± 0.03 MJup mass, and 0.87 ± 0.03 RJup radius using 23 300 WASP-South (Pollacco et al. 2006) observations from 2006 May to 2012 June, 36 1.2-m Euler/CORALIE (Queloz et al. 2001) RVs from 2014 March to 2016 March, and TRAPPIST (Jehin et al. 2011) photometry data on 2014 May 05. Hord et al. (2022) then later announced the discovery and validation of an inner 1.01 day 1.85 R⊕ planet using data from the Transiting Exoplanet Survey Satellite (TESS; Ricker et al. 2015), but did not characterize the mass. Here we use new RV measurements to characterize the mass of the previously discovered super-Earth WASP-132 c (Hord et al. 2022). We also announce the discovery of a long- period massive giant planet, and we updated all bulk measurements of the system. In Sect. 2 we present the observations used in this work. In Sect. 3 we describe our analysis and results. We discuss our results in Sect. 4 and finally give our conclusions Sect. 5.
2 Observations
2.1 Photometry
2.1.1 TESS
As detailed in Hord et al. (2022), WASP-132 (TOI-822, TIC 127530399) was observed by TESS in Sector 11 from UT 2019 April 23 to May 20 (23.96 days) in CCD 2 of Camera 1 and in Sector 38 from UT 2021 April 29 to May 26 (26.34 days) in CCD 1 of Camera 1. Data for WASP-132 were collected at 2- minute cadence in Sectors 11 and 38 and at 20-second cadence in Sector 38. The data were processed by the TESS Science Processing Operation Center (SPOC) pipeline (Jenkins et al. 2016) and were searched by the Transiting Planet Search module (TPS; Jenkins 2002; Jenkins et al. 2010). The TPS recovered WASP- 132 c with a period of 1.01153 days with a signal-to-noise ratio (S/N) of 10.6 in the combined data from the two sectors.
Hord et al. (2022) searched and analyzed the TESS time series using the Presearch Data Conditioning Simple Aperture Photometry (PDC_SAP) TESS light curves generated by the TESS SPOC pipeline (Smith et al. 2012; Stumpe et al. 2012, 2014) at the 2-minute cadence for TESS Sectors 11 and 38. Using the transit least-squares (TLS) search algorithm (Hippke & Heller 2019), Hord et al. (2022) recovered the hot Jupiter WASP-132b signal as well as the WASP-132c signal with a period (1.0119 ± 0.0032 days), depth, and mid-transit time consistent with the values reported by the SPOC pipeline. Hord et al. (2022) also further established the planetary nature of the WASP-132c signal by using the validation tools vespa (Morton 2012, 2015) and TRICERATOPS (Giacalone & Dressing 2020; Giacalone et al. 2021) on the signal and found false-positive probabilities of 9.02 × 10⁻⁵ and 0.0107, respectively.
WASP-132 was recently observed again by TESS in Sector 65 from UT 2023 May 4 to 2023 May 29. Data for WASP-132 were collected at 2-minute cadence in Sector 65. We run an independent analysis of the TESS data, now including Sector 65 and use the PDC_SAP TESS light curves generated by the TESS SPOC pipeline at 2-minute cadence for all three sectors. The full TESS light curves are displayed in the Supplementary Material published on Zenodo.
2.1.2 CHEOPS
We observed three transits of WASP-132c with the European Space Agency CHaracterizing ExOPlanets Satellite (CHEOPS; Broeg et al. 2013; Benz et al. 2021). CHEOPS is a space telescope with a 32 cm aperture for the purpose of precision follow-up of known planetary systems. We observed transits of WASP-132c with CHEOPS on 19 May 2022, 4 June 2022, and 11 June 2022 (Program ID: PR430010, PI: B. Akinsanmi) with an exposure time of 60 seconds. The CHEOPS photometry was processed using the dedicated data reduction pipeline (version 13.1; Hoyer et al. 2020). To identify and correct for systematics affecting CHEOPS light curves, we decorrelate the data against the temporal evolution of the telescope roll angle and the flux of background stars inside the photometric aperture (see e.g., Bonfanti et al. 2021). We discuss the removal of systematics in our CHEOPS data in Sect. 3.4. Using only CHEOPS data we obtain a transit depth of 588 ± 105 ppm (5.6σ detection) for WASP-132 c. The CHEOPS light curves are displayed in the Supplementary Material published on Zenodo.
2.2 Spectroscopy
2.2.1 CORALIE
In addition to the 36 RV measurements published by Hellier et al. (2017) and used by Hord et al. (2022), we obtained 37 more CORALIE RVs for a total of 73 CORALIE observations taken across a time span of over nine years. The CORALIE spectrograph is on the Swiss 1.2 m Euler telescope at La Silla Observatory, Chile (Queloz et al. 2001) and has a resolution of R ~ 60000.
The CORALIE spectrograph began observations in June 1998 and went through two significant upgrades in June 2007 and in November 2014 in order to increase the overall efficiency and accuracy of the instrument. The 2007 upgrade replaced CORALIE’s fiber link and cross-disperser optics (Ségransan et al. 2010). The 2014 upgrade replaced CORALIE’s fiber link with octagonal fibers (Chazelas et al. 2012) and added a Fabry- Pérot calibration unit (Cersullo et al. 2017). Both interventions on the instrument introduced small offsets between the RV measurements collected before and after each upgrade, depending on such parameters as the spectral type and systemic velocity of the observed star.
Observations of WASP-132 with CORALIE began in March 2014 and we have 22 observations with the first upgrade (the “COR07” setup) and 51 observations after the November 2014 upgrade with the “COR14” setup. We treat these two datasets as separate instruments to account for any offsets in the measurements. We reduced the spectra with the standard calibration reduction pipeline and computed RVs by cross-correlating with a binary G2 mask (Pepe et al. 2002). We obtained median RV uncertainties of ~21 m s−1 for our CORALIE RVs. We computed stellar activity indicator data from the CORALIE spectra, including: the cross-correlation function (CCF; Baranne et al. 1996) Full-Width at Half-Maximum (FWHM); CCF Bisector velocity span (BIS; Queloz et al. 2001); CCF Contrast, which is the “depth” of the normalized CCF or height of the Gaussian; and the chromospheric indices measured in Hα (6562.81 Å) (Boisse et al. 2009), Na (Gomes da Silva et al. 2011), and Ca II H&K lines (3968.47 Å and 3933.66 Å) (Boisse et al. 2009). The CORALIE RVs are displayed in Fig. 1.
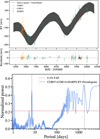 |
Fig. 1 WASP-132 RVs and periodogram. Top: WASP-132 CORALIE and HARPS RVs with a two-planet (excluding the 1-day planet) Keplerian model plus a linear trend as described in Sect. 3.2.2. Bottom: GLS periodogram of the original CORALIE and HARPS RVs. The vertical gray dashed lines display the planet periods presented in Sect. 3.4. |
2.2.2 HARPS
After the announcement of an inner planet candidate to the hot Jupiter in the WASP-132 system, we began observing WASP-132 with the HARPS spectrograph (Pepe et al. 2002; Mayor et al. 2003) to obtain more precise RV measurements and measure the mass of the inner 1-day period planet. HARPS is hosted by the ESO 3.6-m telescope at La Silla Observatory, Chile and has a resolving power of R ~ 115 000.
We obtained 48 HARPS observations of WASP-132 from 17 January 2022 to 1 April 2022 as part of the NOMADS program (PI Armstrong, 108.21YY.001). The HARPS raw data were reduced according to the standard HARPS data reduction software pipeline1 with a spectral-type K5 binary mask. We obtained median RV uncertainties of ~2.2 m s−1 for our HARPS RVs. We computed stellar activity indicators for the HARPS data including CCF FWHM, CCF BIS, contrast of the CCF, Hα indices, Na indices, and Ca II indices, and the Mt Wilson “S index” SMW (Wilson 1978). The HARPS spectra were also used to derive spectral parameters for WASP-132, as detailed in Sect. 3.1. The HARPS RVs are displayed in Fig. 1. Figure 1 also displays a two- planet Keplerian model plus a linear trend (see Sect. 3.2.2) for both the CORALIE and HARPS RVs.
3 Analysis and results
3.1 Host star parameters
Hord et al. (2022) compared several methods to determine the host star parameters of WASP-132 including those reported by Hellier et al. (2017), the TICv8.2 values (Stassun et al. 2018, 2019), an isochrone-based analysis using isoclassify (Huber et al. 2017; Berger et al. 2020), as well as two different broadband Spectral Energy Distribution (SED) plus parallax analyses. Hord et al. (2022) found these methods to be consistent and adopted the isochrone analysis as their final parmameters which used spectroscopic Teff and metallicity from Hellier et al. (2017), Gaia Data Release 2 (DR2; Gaia Collaboration 2016; Bailer-Jones et al. 2018; Gaia Collaboration 2018) parallax and coordinates, the Two Micron All-Sky Survey (2MASS; Skrutskie et al. 2006) KS magnitude, and a photometric extinction estimated from Bovy et al. (2016) as inputs.
The spectroscopic Teff and [Fe/H] from Hellier et al. (2017) that Hord et al. (2022) used as inputs for their final model were determined using only 36 CORALIE spectra. We now have 48 higher resolution HARPS spectra and can derive higher precision spectral parameters using a combined HARPS spectrum. The stellar atmospheric parameters (Teff, log 𝑔, microturbulence and [Fe/H]) were derived using the methodology described in Sousa (2014); Santos et al. (2013). We first measured the equivalent widths (EWs) of 224 Fe I and 35 Fe II lines using the ARES v2 code2 (Sousa et al. 2015). Then we used these EWs together with a grid of Kurucz model atmospheres (Kurucz 1993) and the radiative transfer code MOOG (Sneden 1973) to determine the parameters under assumption of ionization and excitation equilibrium. The abundances of Mg and Si were also derived using the same tools and models as detailed in (e.g. Adibekyan et al. 2012, 2015). Although the EWs of the spectral lines were automatically measured with ARES, we performed careful visual inspection of the EWs measurements as only three lines are available for the Mg abundance determination. Using the combined HARPS spectrum we find a Teff = 4686±99 K, [Fe/H] = +0.15±0.05, and log 𝑔* = 4.55±0.29 (cgs). We find the star to be a K4V spectral type from its Teff value using the updated table from Pecaut & Mamajek (2013)3.
We derived the rotational projected velocity by performing spectral synthesis with MOOG on 36 iron isolated lines, using Gaussian priors for the spectroscopic parameters, and fixing the macroturbulent velocity and limb-darkening coefficient (Costa Silva et al. 2020). The linear limb-darkening coefficient (0.7) was determined using ExoCTK package (Bourque et al. 2021) considering the stellar parameters. Given that WASP-132 is a cooler star the Doyle et al. (2014) calibrations are not valid. We assumed a macroturbulent velocity of 2 km s−1, but the vsin i value can vary with this assumption. With this method we find a rotational projected velocity of vsin i = 3.3±0.6 km s−1. We note that a vsin i = 3.3±0.6 km s−1 yields a Prot/sini = 11.35±2.09 days (with the R⋆ value derived below); however, this is not in agreement with the vsin i = 0.9±0.8 km s−1. Hellier et al. (2017) derived with CORALIE spectra nor with the 33±3 day signal from a possible rotational modulation in the WASP data. We tested larger values for macroturbulent velocities and found vsin i values of 2.9, 2.4, and 1.5 km s−1 for macroturblent velocities of 3, 3.5, and 4 km s−1, respectively. Given the large variance of vsin i with the unknown macroturbulent velocity the vsin i = 3.3±0.6 km s−1 can only be taken as an estimate.
To derive our final stellar parameters, including the age of the star, we fit the SED of the star using MESA Isochrones and Stellar Tracks (MIST) (Dotter 2016; Choi et al. 2016) via the IDL suite EXOFASTv2 (Eastman et al. 2019). The stellar parameters are simultaneously constrained by the SED and the MIST isochrones with this method as the SED primarily constrains the stellar radius R⋆ and effective temperature Teff, while a penalty for straying from the MIST evolutionary tracks ensures that the resulting star is physical in nature (see Eastman et al. (2019), for more details on the method).
We use the Teff, log 𝑔*, and [Fe/H] values along with their uncertainties from the HARPS spectral analysis as priors for our stellar model and the extinction (AV) is limited to the maximum line-of-sight extinction from the Galactic dust maps of Schlafly & Finkbeiner (2011). We put a Gaussian prior for parallax from the value and uncertainty in Gaia DR3 (Gaia Collaboration 2021). We note the Gaia DR3 parallax (8.09240 mas) was corrected by subtracting −0.02705 mas according to the Lindegren et al. (2021) prescription. For the SED fit we use photometry from APASS DR9 BV (Henden et al. 2016); Gaia DR3 G, BP, and RP (Gaia Collaboration 2021); 2MASS J, H, and KS (Skrutskie et al. 2006); and ALL-WISE W1, W2, and W3 (Wright et al. 2010), which are presented in Table 1.
We also use the HARPS spectra to estimate the  of WASP-132 with the method descirbed by Gomes da Silva et al. (2021) using the bolometric correction by Suárez ascareño et al. (2015) and find a
  , which suggests that WASP-132 is only a moderately chromospherically active or inactive star (e.g., Henry et al. 1996). From this
  value we obtain a chromospheric rotational period via the relation by Noyes et al. (1984) and Mamajek & Hillenbrand (2008) to be 44 ± 8 days which is closer to the 33±3 day estimate by Hellier et al. (2017) from photometry variation than our estimate from vsin i.
We present our final stellar parameters in Table 1. The Teff and [Fe/H] values are from the HARPS spectral analysis, while the log 𝑔*, AV, stellar mass, age, density, luminosity, and distance are outputs of the EXOFASTv2 fit. Overall, we find our stellar parameters including mass and radius to be close in value and within uncertainties of those presented by Hord et al. (2022), as well as a close agreement between the HARPS spectroscopic derived log 𝑔* and that derived from EXOFASTv2.
Stellar parameters of WASP-132.
3.2 Initial RV analysis
3.2.1 Rossiter McLaughlin effect
The Rossiter-McLaughlin effect (Rossiter 1924; McLaughlin 1924) occurs during a planetary transit and impacts RVs from a typical Keplerian motion. We estimated the expected RV amplitude of the Rossiter-McLaughlin effect for both transiting planets with the classical method (Eq. (40) from Winn 2010) using our vsin i and stellar radius measurements along with our derived values of the planets’ radii and impact parameters, which we later describe in Sect. 3.4. We find Rossiter-McLaughlin effect RV amplitudes of ~1.6m s−1 for planet c and ~47m s−1 for planet b, assuming λ = 0 (no obliquity). Thus it is necessary to remove RV data that occurred during transits to not affect the RV model parameters. Using the period and transit duration that we later describe in Sect. 3.4, we find three CORALIE RVs and four HARPS RVs that occur during a transit of planet c. We removed the four HARPS RVs from our analysis, but given the relatively small impact the planet c Rossiter-McLaughlin effect will have on CORALIE data, due to the CORALIE RV uncertainties, we did not remove the three CORALIE RVs. We also find one CORALIE RV and five HARPS RVs that are during a transit of planet b and we remove all of these data from our analysis. We note that high resolution ESPRESSO (Pepe et al. 2021) observations of the Rossiter-McLaughlin signal for both planets were obtained and are in preparation for publication by a separate team.
3.2.2 HARPS linear trend plus two-planet residuals analysis
Our CORALIE and HARPS RVs clearly show the signal of the 7-day hot Jupiter and a longer period companion around 1800 days as seen in the generalized Lomb-Scargle (GLS) periodogram (Lomb 1976; Scargle 1982; Zechmeister & Kürster 2009) implemented in the astropy (Astropy Collaboration 2013, 2018) Python package of all the WASP-132 RVs in Fig. 1. The astropy periodogram package can calculate False Alarm Probabilities (FAP) using various methods and we use the default Baluev (2008) method. We accounted for RV offsets between the instruments using the best-fitting systemic velocities, as derived from the COR07, COR14, and HARPS datasets (see Table 2). Notably, we see the 7-day and long-period companion as well as one-day signals above the 0.1% FAP level in the periodogram. We also detected that a long-term RV trend is within the data.
In order to detect the much smaller signal from the 1-day period super-Earth planet we first fit the longer period signals and analyzed the residuals. For our initial RV analysis, we used the software suite pyaneti4 (Barragán et al. 2019, 2022), which couples a Bayesian framework with a Markov chain Monte Carlo (MCMC) sampling to produce posterior distributions of the fitted parameters. We first fit the RVs with two Keplerians for the hot Jupiter and long-period outer companion as well as a linear trend. We note that we fit the data without a linear trend and the linear trend model is preferred with a difference in Bayesian Information Criterion (BIC) of 134. We put Gaussian priors on the period of the hot Jupiter based on our transit analysis presented in Sect. 3.4. With our initial two-planet fit we find the outer companion to have a period of ~1792 days and RV semi-amplitude Kd = 105.6 ± 7.4 m s−1 and a linear trend of  m s−1 year−1. After removing these signals we analyzed the HARPS RVs which have the necessary precision to detect the smaller 1-day planet.
Noticeably the HARPS RV residuals of the 2-planet plus trend fit have variation much larger than the expected signal from the 1-day period super-Earth planet and we find strong signals at ~21–28 and ~8–11 days as displayed in Fig. 2. It is well known that magnetically active regions (spots and plages) can induce periodic and quasi-periodic Doppler signals at the stellar rotation frequency and its harmonics (e.g., Boisse et al. 2011). Our  value suggests that the star may be magnetically active and additionally Hellier et al. (2017) found a possible rotational modulation with a period of 33 ± 3 days and an amplitude of 0.4 mmag in three out of five seasons of WASP data. We expect these signals in the HARPS data are due to magnetic activity and rotation of the star. We also detect significant signals in the various HARPS activity indicators. We display GLS periodograms in the period domain of the CCF FWHM, CCF BIS, and Mt Wilson S index SMW in Fig. 2. We present a more detailed view of the HARPS activity indicator data in Sect. 3.3.
In order to account for this activity signal we applied a multidimensional Gaussian process (GP) approach, the pyaneti implementation of which is as described in Rajpaul et al. (2015). We used the quasi-periodic (QP) kernel, as defined by Roberts et al. (2013) and described in Barragán et al. (2022), and placed an uninformative prior with a range of 5–45 days for the period of the QP kernel. We tested combinations of available activity indicators and in all cases the period of QP kernel was found to be at PGP ~30–32 days, which we take to be the rotation period of the star. We found that a two-dimensional GP fit with the RV and BIS activity indicators gave the best results and obtained the lowest BIC value and smaller HARPS RV jitter value when we allow an RV jitter to be fit. With this fit we found a RV semi-amplitude of  corresponding to a mass of
  for the 1-day planet and a
  days. We show the multidimensional GP fit with BIS and the HARPS RV residuals in Fig. 3.
For the previous fits we fixed the eccentricity of the 1-day period planet to 0. We also tested for eccentricity by fitting for ecosω and esinω. The fit finds an eccentricity of  . However, the BIC is actually higher by 3 for the fit with the eccentricity. Given the large errors on the eccentricity, the smaller BIC of the fixed eccentricity, and the physical likelihood that the planet is tidally locked we fix the eccentricity to 0. Additionally given the complexity of the activity and small planet signal we conclude we that we cannot measure the eccentricity of the 1-day planet with the current RV dataset.
Given the short period of the 1-day planet signal and longer rotation period of the star, we also tested fitting only HARPS RVs that had multiple observations taken on a given night and fit each night as its own offset in order to constrain the RV semi-amplitude of only the planet signal, similar to the analysis presented in Hatzes et al. (2011) to obtain the mass of CoRoT- 7b (Léger et al. 2009; Queloz et al. 2009). After removing RVs during transits, we had 12 different nights of HARPS data with two observations per night, as displayed in Figure 4. Allowing each night to have its own RV offset and then fitting for a single Keplerian we found an RV semi-amplitude of  . corresponding to a mass of
  , which is consistent with our Keplerian plus GP model of the residuals.
Pyaneti initial RV fit parameters of WASP-132.
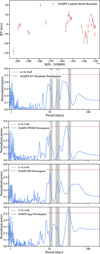 |
Fig. 2 HARPS RV residuals, periodogram, and activity periodograms. Top: HARPS RV residuals after fitting CORALIE and HARPS data with a two-planet plus trend model and its corresponding and GLS periodogram. Bottom: GLS periodograms for the HARPS data activity indicators CCF FWHM, CCF BIS, and Mt Wilson S index SMW from top to bottom respectively. The gray vertical bands show the possible rotation period Prot = 33 ± 3 days and harmonics Prot/2 and Prot/3. |
 |
Fig. 3 HARPS RV residuals Keplerian and GP model fit. Top: HARPS RV residuals after fitting CORALIE and HARPS data with a two-planet plus trend model described in Sect. 3.2.2 with a one-planet Keplerian plus GP model constrained by the HARPS RV and BIS. Middle: GP fit to the HARPS BIS data. Bottom: HARPS RV residuals from the top phased to the 1-day planet model. |
 |
Fig. 4 HARPS RV residuals after fitting CORALIE and HARPS data with a two-planet plus trend model described in Sect. 3.2.2. Here we only include HARPS data that had two observations in one night for a total of 12 nights. We then fit a single Keplerian model with each night treated as different instrument with its own offset. Each night is shown with different colors. We show the phased RV plot in the bottom. |
3.2.3 Linear trend plus three-planet RV-only model
Finally for our RV-only analysis we perform a three-planet fit plus a linear trend and a QP GP kernel. We only use a onedimensional GP as pyaneti cannot fit activity indicators for one instrument and not others, and we do not find a good fit when including the CORALIE activity indicators which are essentially noise when trying to fit the activity signal. We put Gaussian priors on the periods and ephemerides of the two inner planets based on our transit fit in Sect. 3.4. For the outer planet period we used uniform priors between 1700 and 1900 days. We also put uniform priors on the QP GP period between 30 and 32 days based on our results from the two-dimensional GP modeling with the HARPS residuals. We fixed the 1-day planet’s eccentricity to 0. All other parameters were given uniform priors. We show our full fit to the RV data in Fig. 5 and present the fit parameters including our mass measurements in Table 2, which is in agreement with our previous analyses. Table 2 presents the QP GP hyper-parameters including A0 and A1, which are the coefficients of the GP and its derivative, respectively. A0 and A1 are amplitudes that act as scale factors, determining the typical deviation from the mean function. λe is the long-term evolution time-scale (the lifetime of active regions). λp is the inverse of the harmonic complexity (how complex variations are inside each period, which is related to distribution of active regions). λe is the long-term evolution time-scale (the lifetime of active regions). In Table 2 T0d refers to the time of inferior conjunction.
 |
Fig. 5 pyaneti fit to RV data including three Keplerian models, a linear trend, and a GP described in Sect. 3.2.2. The lower three plots show the phased RV curves of the 1-day, 7-day, and ~1811-day outer planet respectively. |
3.3 RV signal and activity analysis
Here we further investigate the nature of the signals in the CORALIE and HARPS RVs. We employ a form of the pre-whitening procedure (e.g., Queloz et al. 2009; Hatzes 2013; Perger et al. 2017) based on a Fourier transform (FT) frequency analysis. In this procedure, we subtract RV signals, removing their corresponding FT peaks from the data, and then analyze the resulting generalized Lomb-Scargle (GLS) periodograms in the frequency domain. We also created spectral window functions (Roberts et al. 1987; Dawson & Fabrycky 2010), the Fourier transform of the observation times, for the CORALIE and HARPS RVs. The window function can help identify aliases in time series data as detailed by Dawson & Fabrycky (2010).
In the top panel of Fig. 3 of the Supplementary Material published on Zenodo, we present a GLS periodogram in the frequency domain for the window function of the CORALIE RVs. The second panel displays the GLS periodogram of the CORALIE RVs. We account for the RV offsets between COR07 and COR14. The third through sixth panels display the GLS periodograms of the CORALIE RVs subtracted by the long-term linear trend; the linear trend and the Doppler signal of planet b; the linear trend and the Doppler signal of planet d; and the linear trend and the Doppler signals of planet d and b; respectively. From this analysis we find a strong signal at planet d’s corresponding frequency after removing the linear trend and planet b’s Doppler signal. We also see the FT peaks around 1 day−1 are removed after subtracting the linear trend and planet d.
In addition, we examined GLS periodograms of the CORALIE activity indicators. The top panel of Fig. 4 of the Supplementary Material published on Zenodo again displays the GLS periodogram for the window function of the CORALIE data. Panels two through seven display display GLS periodograms of the CCF FWHM, CCF BIS, CCF Contrast, and the chromospheric indices measured in Hα, Na, and Ca II H&K lines lines, respectively. The offsets between the COR07 and COR13 activity indicators are negligible. From the CORALIE activity indicators we do not examine any significant peaks around planet d’s frequency that would suggest it originated from stellar activity. We also do not see any long-term trend originating from a magnetic cycle that could explain the linear RV trend.
We performed similar procedures with the HARPS data as displayed in Figs. 5 and 6 of the Supplementary Material published on Zenodo. Figure 5 of the Supplementary Material published on Zenodo displays GLS periodograms in the frequency domain of the HARPS window function, HARPS RVs, and the RVs with various signals subtracted including the linear trend and Doppler signals of planets d, b, and c. For the activity signal we fit the phase and amplitude of sinusoidal signals at frequencies of the approximate stellar rotation period of 31.4 days and its first two harmonics of 15.7 and 10.5 days. Although the signal is not significant, we see a small peak around planet c’s frequency after subtracting the other signals and the activity signals. The GLS periodograms in the frequency domain of the HARPS activity indicators are displayed in Fig. 6 of the Supplementary Material published on Zenodo which includes the Mt Wilson S index SMW. We detect significant signals around the stellar rotation frequency of ~1/31.4 days in the CCF FWHM, CCF Contrast, Hα, Na, Ca II, and SMW GLS periodograms.
3.4 Joint photometry and RV analysis
We modeled both the photometry and RV data with juliet (Espinoza et al. 2019), which uses Bayesian inference to model a set number of planetary signals using batman (Kreidberg 2015) to model the planetary transits and radvel (Fulton et al. 2018) to model the RVs. Of note, although juliet cannot handle multidimensional Gaussian processes (GPs) for RV data, for light curves juliet can model stellar activity as well as instrumental systematics with GPs (e.g., Gibson 2014) or simpler parametric functions, which we do not find available in pyaneti. For the transit model, juliet performs an efficient parameterization by fitting for the parameters r1 and r2 to ensure uniform exploration of the p (planet-to-star ratio; Rp /R★) and b (impact parameter) parameter space. Espinoza (2018) details the r1 and r2 parameterization and the transformation to the p and b plane. We used the nested sampling method dynesty (Speagle 2019) implemented in juliet with 1500 live points and we ran the fit until the estimated uncertainty on the log-evidence was smaller than 0.1.
We added a white-noise jitter term in quadrature to the error bars of both the photometry and RV data to account for underestimated uncertainties and additional noise that was not captured by the model. To account for possible residual systematics and activity affecting the transit fit of TESS Sectors 11, 38, and 65, we fit a Gaussian process (GP) using a Matérn-3/2 kernel via celerite (Foreman-Mackey et al. 2017) within the juliet framework. In addition to the stellar activity fitting presented in Sect. 3.2.2, a GP can account for correlated noise of various origins and propagates the uncertainty (e.g., Gibson et al. 2012; Gibson 2014). Additionally, properly fitting out of transit data will more accurately set the baseline for in transit data. We display the GP fit to the full TESS light curves in Fig. 1 of the Supplementary Material published on Zenodo. We also fit a Gaussian process (GP) using a Matérn-3/2 kernel for the RV data and put uniform priors on the time-scale based on our initial RV analysis in Sect. 3.2.3. We fit the CHEOPS data by detrending with the background flux and the roll angle ϕ by using cos(ϕ), cos(2ϕ), sin(ϕ), and sin(2ϕ). We display our full fit to the CHEOPS data in Fig. 2 of the Supplementary Material published on Zenodo.
For limb darkening, we derived quadratic coefficients and their uncertainties for different photometric filters using the LDCU5 routine (Deline et al. 2022) and used them to set Gaussian priors on the limb-darkening parameters. We used uniform priors for the period and transit center times. We fixed the eccentricity for the 1-day period planet and added a Beta prior for transiting planets for the hot Jupiter, as described in Kipping (2014). We used the ρ∗ (stellar density) as a parameter instead of the scaled semi-major axis (a/R⋆). The normal prior on stellar density is informed by the stellar analysis in Sect. 3.1.
For our final RV and photometry joint fit, we constrained the RV semi-amplitude K of planet c as well as the period, T0, eccentricity, RV K, and ω of planet d using values from our initial pyaneti RV analysis presented in Sect. 3.2.2. We tested several times putting fewer constraints on these parameters within the juliet global model but found that the model would get stuck with solutions that had lower likelihoods than our final solution. We therefore used priors from our initial pyaneti analysis to guide the juliet global model to find the most likely solution. We account for these priors in our uncertainties of the modeled and derived juliet parameters.
Tables 3 and 4 display all of the modeled parameters as well as their input priors for our joint RV and transit model. Figure 6 displays the final model fits to the phased photometry data for both WASP-132 c and WASP-132 b. Figure 7 displays the final RV fits with the joint RV and photometry model. We find the planet masses to be consistent with our RV-only analysis and therefore present the joint fit as our final parameters.
In addition to all of the modeled parameters, Table 3 also displays derived planet parameters including the inclination, impact parameter, semi-major axis, and radius. We calculated the insolation using the equation:
![Mathematical equation: $S\left[ {{S_ \oplus }} \right] = {L_*}\left[ {{L_ \odot }} \right]{(a[{\rm{AU}}])^{ - 2}}.$](/articles/aa/full_html/2025/01/aa48177-23/aa48177-23-eq49.png) (1)
(1)
We calculated the equilibrium temperature assuming a Bond albedo of A = 0.343 (the same as Jupiter’s) for the hot Jupiter and A = 0.3 (the same as Earth’s) for the super-Earth and the semi-major axis distance a using the equation:
 (2)
(2)
We set upper and lower uncertainties for the equilibrium temperature by assuming Bond albedos of A =0 and A = 0.686 (double that of Jupiter), respectively for the hot and cold Jupiters and A = 0 and A = 0.6 (double that of Earth), respectively for the super-Earth.
4 Discussion
4.1 Comparison to previous studies
We find our stellar parameters in agreement with Hord et al. (2022) and other previous studies. Hord et al. (2022) found a radius of 10.05 ± 0.28 R⊕ and mass of 121.9 ± 21.9 M⊕ for WASP- 132 b, while Hellier et al. (2017) found a radius of 9.75 ± 0.34 R⊕ and mass of 130.3 ± 9.5 M⊕. Notably Hord et al. (2022) included a fit for WASP-132 c in their RV analysis to obtain the mass of WASP-132 b. With a measurement 136.1 ± 4.8 M⊕, we decrease by a factor of two the mass uncertainty for WASP-132 b, and we find a similar radius of 10.10 ± 0.43R⊕. Hord et al. (2022) found a radius of 1.85 ± 0.10 R⊕ for WASP-132 c, which is similar to our result of 1.841 ± 0.094R⊕. For the two inner planets we find bulk densities of  for WASP-132 c and
  for WASP-132 b.
4.2 Dynamical history
With the help of previous studies such as Dawson & Johnson 2018, Wu et al. (2023) recently gave a unified framework for short-period gas giant dynamical sculpting where hot and warm Jupiters emerge as a natural outcome of postdisk dynamical sculpting of gas giants in compact multi-planet systems. They propose that after the initial starting point from the disk evolution, planet-planet interactions can excite the eccentricities of some giant planets and push them into smaller orbits. This eccentric migration continuum can be divided into three regimes of hot Jupiters, those with quiescent histories, low-eccentricity migration, and high-eccentricity migration (Wu et al. 2023). Given the presence of the small inner planet, WASP-132 b likely formed with a quiescent history without experiencing strong interactions with other planets in the system, maintaining low eccentricity (we find e~0 for WASP-132 b), and retaining nearby planetary companions. This scenario is more likely than low-eccentricity or high-eccentricity migration that involve interactions with other gas giants and are likely to remove nearby companions.
Although WASP-132 c and WASP-132 b are not in resonance, we performed a TTV analysis of WASP-132 b to test if any other non-transiting or non-RV detected planets were causing perturbations of the planet. We conducted an analysis of the TTVs for WASP-132 b with juliet by utilizing all available photometric datasets from TESS. Instead of fitting a single period (Porb) and time-of-transit center (T0), juliet employed a method that seeks individual transit times. This approach involved fitting each transit independently and determining one transit time for each one, resulting in a more consistent and coherent analysis. We also included the TRAPPIST observation of the WASP-132 b transit made on 2014 May 5 from Hellier et al. (2017) for our TTV analysis. Figure 8 illustrates the results of our analysis, which compares the observed transit times with the calculated linear ephemeris derived from all the transits. Notably, no significant variations were detected within the TESS data and the TRAPPIST transit is only a ~1σ outlier.
Additionally, hot Jupiters in systems with two or more known stars could have been produced through eccentric migration triggered by secular Kozai-Lidov interactions with stellar companions (e.g., HD 80606 b; Naef et al. 2001; Wu & Murray 2003). Hord et al. (2022) presented speckle imaging of WASP- 132 using the HRCam instrument on the 4.1 m SOAR telescope (Tokovinin 2018) and detected no nearby stars within 3″ of WASP-132. Hord et al. (2022) also observed WASP-132 with the LCOGT (Brown et al. 2013) 1.0m network node at the South African Astronomical Observatory and ruled out nearby eclipsing binaries for all neighboring stars out to 50″ from WASP-132. However, in addition to the 2.7 AU outer planet, we also significantly detect a long-term trend in our CORALIE RVs. This could be due to an additional brown dwarf or low- mass star in the system. Using a basic calculation of mass from the RV span of ∼200 m s−1 (minimum K), time span of ∼9 years (minimum period ∼18 years), and assuming a circular orbit, we find a potential minimum mass of this outer companion to be ∼18.5 MJup. This possible additional brown dwarf or stellar companion could have influenced the migration of the two inner planets as well as the outer giant planet.
The stellar obliquity or the observed excess of spin-orbit misalignment can put important constraints on the formation pathways of hot Jupiters. If WASP-132b did migrate early on in the proto-planetary disk, measuring the spin-orbit angles of the two planets using the Rossiter-McLaughlin effect will allow the coplanarity of their orbits and their possible misalignments with the star to be assessed, which constrains their dynamical history. As noted previously, ESPRESSO spectroscopic observations of the transits of both planets were obtained and are planned for publication by a separate team.
 |
Fig. 6 WASP-132 TESS and CHEOPS photometry data. Phased fitto WASP-132 c with all three TESS sectors (top). Phased fit to WASP- 132 c with CHEOPS (middle). Phased fit to WASP-132 b with all three TESS sectors (bottom). The transit fit from juliet is described in Sect. 3.4. 5-minute TESS bins and 20-minute CHEOPS bins are shown in blue for display purposes. |
WASP-132 planet parameters from juliet: median and 68% confidence interval.
WASP-132 system and instrumental parameters from juliet: median and 68% confidence interval.
4.3 Astrometric signal
Astrometry can be an ideal method to provide exact masses of companions in combination with RVs. A commonly applied approach analyses the proper motion anomaly between HIPPARCOS (ESA 1997) and Gaia (Gaia Collaboration 2016), described in more details by Snellen & Brown (2018) and Brandt et al. (2021). WASP-132 was too faint to be observed by Hipparcos, which means that the comparison is not possible; however, DR3 (Gaia Collaboration 2023) includes an additional 12 months of observations more than DR2 (Gaia Collaboration 2018) and can be compared. The short-period planets are averaged into the proper motions reported by these two datasets, but the proper motion anomaly of WASP-132 d (1817 days) should be visible, if significant. Whereas the long term trend we detected in the RVs should be seen as a constant proper motion offset and will likely not introduce any difference between DR2 and DR3.
There is a 4-sigma difference  between the proper motion values in Right Ascension from DR3
  and DR2
  . While the difference in proper motions in Declination (∆muδ = 0.04 ± 0.072 mas yr−1) is not significant (DR3 muδ= −73.17 ± 0.02 mas yr−1 and DR2 muδ = −73.21 ± 0.07 masyr−1). As the proper motion of DR3 also includes the data of DR2, the difference in proper motion could be an indication of astrometric signal but it could also be caused by improved Gaia calibration and data reduction.
Additionally, Gaia DR3 reports a Renormalized Unit Weight Error (RUWE) of 1.23, where 1 is generally seen as a good measurement and above 1.4 as a possible indication of binarity (Kervella et al. 2022). The Gaia DR3 astrometric excess noise level of 0.11, while relatively low, ideally should be zero. Astrometric excess noise can indicate modeling errors in either the excess noise associated with the source or the attitude noise. These hints of astrometric variations must be interpreted with caution and drawing conclusions is beyond the scope of this paper. Gaia DR4 will enable the determination of WASP-132 d’s true mass and its relative orbital inclination with respect to the two inner transiting planets. We note that WASP-132 d would need to have an orbital inclination larger than 66 degrees from an edge-on orbit to have a mass greater than 13 MJup.
 |
Fig. 7 RV fit from global juliet model to WASP-132. The top plot shows the full RV set with the different model components. The second from the top shows the phased RV data and juliet fit to planet c with only the HARPS data plotted, while the bottom two plots show planets b and d, respectively, with both HARPS and CORALIE data. |
 |
Fig. 8 TTVs of WASP-132 b determined with juliet on TESS data and the TRAPPIST transit from Hellier et al. (2017). The gray area represents the 1σ uncertainty of the T0 from our global analysis. |
 |
Fig. 9 WASP-132 b’s radius as a function of time. The green lines display the cooling of WASP-132 b assuming different bulk metallicity values between zero and 25%. The gray error bars show the measured values. The planet must be enriched in heavy elements to match the observations. |
 |
Fig. 10 Posterior distribution of the inferred heavy-element mass fraction of WASP-132b. The distribution is approximately Gaussian, with a mean of μZ = 13% and a standard deviation of σZ = 6%. |
4.4 Internal characterization of the giant planet WASP-132 b
The available measurements of the mass and the radius of the planet WASP-132 b make it possible to infer its bulk heavyelement content with giant planet evolution models (e.g., Miller & Fortney 2011; Thorngren et al. 2016; Müller & Helled 2023a). This is an important piece of information since it can be compared to predictions from formation models and therefore be used as an additional constraint (e.g., Guillot et al. 2006; Johansen & Lambrechts 2017; Hasegawa et al. 2018). With a Teq = 682 K, WASP-132 b is significantly cooler than strongly irradiated hot Jupiters. This makes the inferred composition less uncertain since the planet should not be inflated (e.g., Fortney et al. 2021). Here, we used the giant planet evolution models from Müller & Helled (2021) to calculate the planet’s cooling. Figure 9 shows the radius as a function of time assuming that the planet has a bulk metallicity between zero and 25%. Comparing it to the observed radius, it is clear that the planet is not inflated compared to predictions from the model, and that it must be enriched with heavy elements.
To quantify the enrichment, we inferred the planet’s bulk heavy-element mass fraction Z in a Monte-Carlo fashion (see e.g., Müller & Helled 2023b, for a review): we create sample planets by drawing from the observed planetary mass, radius, and age distributions. For each sample, we calculate the evolution for a range of bulk metallicities to find which value would match the sampled radius at the right age. By repeating this process, the posterior distribution of the planet’s heavy-element mass can be estimated. The result is shown in Fig. 10. The posterior is roughly Gaussian, with a mean of μZ = 13% and a standard deviation of σZ = 6%. This yields a heavy-element mass of Mz ≈ 17 M⊕ , which is similar in magnitude to what would be expected from the critical core mass in core-accretion models (e.g., Helled et al. 2014). For comparison, if the planet had stellar metallicity, its heavy-element mass would be MZ ≈ 2.6 M⊕.
4.5 Internal characterization of WASP-132 c
Figure 11 shows a Mass-Radius diagram highlighting multi- planetary systems with precise densities (σM /M ≤ 25% and σR/R ≤ 8%) from the PlanetS catalog6 (Otegi et al. 2020; Parc et al. 2024), and in particular systems composed of a hot or warm Jupiter (P<100 days) and a nearby small planet (R < 4 R⊕). Figure 11 clearly shows that WASP-132 c sits slightly above the Earth-like composition line, suggesting a refractory-rich composition. To probe the scope of interior structures that are consistent with the observed constraints, we use the four layer model of Dorn et al. (2017). It includes an iron core, a rocky mantle, a water layer, and a hydrogen-helium atmosphere. Using a nested sampling algorithm (Buchner et al. 2014), we vary the layer masses, the elemental ratios of Mg/Si and Fe/Si in the mantle and the age of the planet, taking the stellar values for the priors. In order to put upper bounds on the water and atmospheric mass fractions we ran a model assuming no atmosphere (no-atmosphere model) and a model assuming no water layer (no-water model), respectively. Additionally, we ran a model where we put no constraints on the layer masses (free model). Our results are listed in Table 5.
All nested sampling models favor a refractory-rich composition dominated by metals and silicates and a negligible atmosphere. It should be noted, however, that the assumed internal structure is very simple. In reality, the internal structure of planets can be more complex, including and enrichment of the atmosphere with heavy elements and the hydration of the mantle and/or core. Accounting for more sophisticated structure could affect the inferred results. However, our main conclusions that WASP-132c is an exoplanet dominated by refractory material are unlikely to change.
 |
Fig. 11 Mass-radius diagram of small exoplanets with precise densities (σM/M ≤ 25% and σR/R ≤ 8%) from the PlanetS catalog (Otegi et al. 2020; Parc et al. 2024). The red stars correspond to known small planets (R < 4 R⊕), with precise radius and mass measurements, that have a hot or warm Jupiter companion (R > 0.8 RJup). Orange dots are planets in multi-planet system of all kinds. Gray dots are planets in singleplanet system. Composition lines are displayed for pure-iron (brown) and Earth-like planets (light-brown). |
WASP-132 c interior structure nested sampling results.
4.6 WASP-132: A rare multi-planet system
As noted, Fig. 11 shows a mass-radius diagram highlighting multi-planetary systems with precise densities from the PlanetS catalog. Among the 127 planets in 80 systems, only six have a hot or warm Jupiter (P<100 days) and a nearby small planet (R<4R⊕): WASP-132, WASP-47 (Bryant & Bayliss 2022), 55 Cnc (Bourrier et al. 2018), KOI-94 (Weiss et al. 2013), WASP-84 (Maciejewski et al. 2023) and KOI-142 (Weiss et al. 2020). This once again demonstrates the rare contribution of this system, and the mass measurement of WASP-132 c, to a very small existing population.
The small planets with accompanying hot Jupiters consist of five super-Earths and two sub-Neptunes. Considering the subNeptunes, WASP-47 d is located at a longer period than its hot Jupiter companion, while the super-Earth WASP-47 e is inside the hot Jupiter. KOI-142 b orbits with a much longer period than the other planets in this diagram (P = 10.92 days), explaining its larger size due to lower irradiation. Its associated Jupiter is also less “hot”.
The super-Earths with hot or warm Jupiters are on the more massive end of this planet type and are likely composed of refractory elements. This may reveal that we are biased to detect the heaviest super-Earths in the presence of a hot Jupiter and lighter inner rocky planets in this kind of system may exist. Smaller planets like Kepler-730 c (R=1.57±0.13R⊕; Cañas et al. 2019), which have no mass measurement, could be lighter. The lack of a similar system between the super-Earths and the sub-Neptunes could be intimately linked to their short orbital period and therefore to the irradiation received, stripping these planets of their atmosphere. Hot Jupiters then play an important role behind, limiting an internal planet’s period.
5 Conclusion
We report refined bulk measurements of the WASP-132 system. The 7.1-day hot Jupiter WASP-132 b was first discovered by WASP (Hellier et al. 2017) and an inner 1.01-day super-Earth was subsequently discovered by TESS (Hord et al. 2022). Here we also report the discovery of an 2.7 AU outer giant planet and long-term linear trend in the RVs suggestive of another outer companion. Using over nine years of CORALIE observations and highly sampled HARPS data, we determined the masses of the planets from smallest to largest orbital period to be  and
and  , respectively. Using TESS and CHEOPS photometry data, we measured the radii of the two inner transiting planets to be
  and
and  We also performed an independent stellar analysis to find M⋆ = 0.789 ± 0.039 M⊙ and R⋆ = 0.758 ± 0.032R⊙. We find that the hot Jupiter WASP-132 b is not inflated but enriched with heavy elements. For the super-Earth WASP-132 c, our internal structure modeling favors a refractory-rich composition that is dominated by metals and silicates and a negligible atmosphere. We find that both the inner 1-day super-Earth and hot Jupiter are likely in circular orbits with eccentricities of ∼0. Given the presence of a nearby inner planet and its low eccentricity, the hot Jupiter WASP-132 b likely migrated through quieter mechanisms than high-eccentricity migration, making it a rare contribution to the current planet population.
Data availability
A table of the reduced CHEOPS photometric observations, the reduced TESS photometric observations, the CORALIE RVs and all activity indicator data, and the HARPS RVs and all activity indicator data are available at the CDS via anonymous ftp to cdsarc.cds.unistra.fr (130.79.128.5) or via https://cdsarc.cds.unistra.fr/viz-bin/cat/J/A+A/693/A144. Figures mentioned in the text as supplementary material are published on Zenodo at https://doi.org/10.5281/zenodo.14271139.
Acknowledgements
We thank the Swiss National Science Foundation (SNSF) and the Geneva University for their continuous support to our planet low-mass companion search programs. This work was carried out in the frame of the Swiss National Centre for Competence in Research (NCCR) PlanetS supported by the SNSF including grants 51NF40_182901 and 51NF40_205606. This work used computations that were performed at the University of Geneva on the “Yggdrasil” High Performance Computing (HPC) clusters. This publication makes use of The Data & Analysis Center for Exoplanets (DACE), which is a facility based at the University of Geneva (CH) dedicated to extrasolar planet data visualization, exchange, and analysis. DACE is a platform of NCCR PlanetS and is available at https://dace.unige.ch. This paper includes data collected by the TESS mission. Funding for the TESS mission is provided by the NASA Explorer Program. We acknowledge the use of public TESS data from pipelines at the TESS Science Office and at the TESS Science Processing Operations Center. Resources supporting this work were provided by the NASA High-End Computing (HEC) Program through the NASA Advanced Supercomputing (NAS) Division at Ames Research Center for the production of the SPOC data products. V.A. acknowledges the support by FCT - Fundação para a Ciência e a Tec- nologia through national funds (grants: UIDB/04434/2020, UIDP/04434/2020, and 2022.06962.PTDC). D.J.A. is supported by UKRI through the STFC (ST/R00384X/1) and EPSRC (EP/X027562/1). N.C.S. acknowledges the funding by the European Union (ERC, FIERCE, 101052347). Views and opinions expressed are however those of the author(s) only and do not necessarily reflect those of the European Union or the European Research Council. Neither the European Union nor the granting authority can be held responsible for them. This work was supported by FCT – Fundação para a Ciência e a Tecnologia through national funds and by FEDER through COMPETE2020 – Programa Operacional Competitividade e Internacionalização by these grants: UIDB/04434/2020; UIDP/04434/2020. N.G. thanks Daniel Thomas Watson for his pertinacious and adamantine support.
References
- Adibekyan, V. Z., Sousa, S. G., Santos, N. C., et al. 2012, A&A, 545, A32 [NASA ADS] [CrossRef] [EDP Sciences] [Google Scholar]
- Adibekyan, V., Figueira, P., Santos, N. C., et al. 2015, A&A, 583, A94 [NASA ADS] [CrossRef] [EDP Sciences] [Google Scholar]
- Astropy Collaboration (Robitaille, T. P., et al.) 2013, A&A, 558, A33 [NASA ADS] [CrossRef] [EDP Sciences] [Google Scholar]
- Astropy Collaboration (Price-Whelan, A. M., et al.) 2018, AJ, 156, 123 [Google Scholar]
- Bailer-Jones, C. A. L., Rybizki, J., Fouesneau, M., Mantelet, G., & Andrae, R. 2018, AJ, 156, 58 [Google Scholar]
- Baluev, R. V. 2008, MNRAS, 385, 1279 [Google Scholar]
- Baranne, A., Queloz, D., Mayor, M., et al. 1996, A&AS, 119, 373 [NASA ADS] [CrossRef] [EDP Sciences] [Google Scholar]
- Barbato, D., Sozzetti, A., Desidera, S., et al. 2018, A&A, 615, A175 [NASA ADS] [CrossRef] [EDP Sciences] [Google Scholar]
- Barragán, O., Gandolfi, D., & Antoniciello, G. 2019, MNRAS, 482, 1017 [Google Scholar]
- Barragán, O., Aigrain, S., Rajpaul, V. M., & Zicher, N. 2022, MNRAS, 509, 866 [Google Scholar]
- Baruteau, C., Crida, A., Paardekooper, S. J., et al. 2014, in Protostars and Planets VI, eds. H. Beuther, R. S. Klessen, C. P. Dullemond, & T. Henning (Tucson: University of Arizona press), 667 [Google Scholar]
- Becker, J. C., Vanderburg, A., Adams, F. C., Rappaport, S. A., & Schwengeler, H. M. 2015, ApJ, 812, L18 [NASA ADS] [CrossRef] [Google Scholar]
- Benz, W., Broeg, C., Fortier, A., et al. 2021, Exp. Astron., 51, 109 [Google Scholar]
- Berger, T. A., Huber, D., van Saders, J. L., et al. 2020, AJ, 159, 280 [Google Scholar]
- Boisse, I., Moutou, C., Vidal-Madjar, A., et al. 2009, A&A, 495, 959 [NASA ADS] [CrossRef] [EDP Sciences] [Google Scholar]
- Boisse, I., Bouchy, F., Hébrard, G., et al. 2011, A&A, 528, A4 [NASA ADS] [CrossRef] [EDP Sciences] [Google Scholar]
- Bonfanti, A., Delrez, L., Hooton, M. J., et al. 2021, A&A, 646, A157 [EDP Sciences] [Google Scholar]
- Bonomo, A. S., Dumusque, X., Massa, A., et al. 2023, A&A, 677, A33 [NASA ADS] [CrossRef] [EDP Sciences] [Google Scholar]
- Borucki, W. J., Koch, D., Basri, G., et al. 2010, Science, 327, 977 [Google Scholar]
- Bourque, M., Espinoza, N., Filippazzo, J., et al. 2021, https://doi.org/10.5281/zenodo.4556063 [Google Scholar]
- Bourrier, V., Dumusque, X., Dorn, C., et al. 2018, A&A, 619, A1 [NASA ADS] [CrossRef] [EDP Sciences] [Google Scholar]
- Bovy, J., Rix, H.-W., Green, G. M., Schlafly, E. F., & Finkbeiner, D. P. 2016, ApJ, 818, 130 [Google Scholar]
- Brandt, T. D., Dupuy, T. J., Li, Y., et al. 2021, AJ, 162, 186 [NASA ADS] [CrossRef] [Google Scholar]
- Broeg, C., Fortier, A., Ehrenreich, D., et al. 2013, Euro. Phys. J. Web Conf., 47, 03005 [NASA ADS] [CrossRef] [EDP Sciences] [Google Scholar]
- Brown, T. M., Baliber, N., Bianco, F. B., et al. 2013, PASP, 125, 1031 [Google Scholar]
- Bryan, M. L., Knutson, H. A., Lee, E. J., et al. 2019, AJ, 157, 52 [Google Scholar]
- Bryant, E. M., & Bayliss, D. 2022, AJ, 163, 197 [NASA ADS] [CrossRef] [Google Scholar]
- Buchner, J., Georgakakis, A., Nandra, K., et al. 2014, A&A, 564, A125 [NASA ADS] [CrossRef] [EDP Sciences] [Google Scholar]
- Cañas, C. I., Wang, S., Mahadevan, S., et al. 2019, ApJ, 870, L17 [CrossRef] [Google Scholar]
- Cersullo, F., Wildi, F., Chazelas, B., & Pepe, F. 2017, A&A, 601, A102 [NASA ADS] [CrossRef] [EDP Sciences] [Google Scholar]
- Chazelas, B., Pepe, F., & Wildi, F. 2012, SPIE Conf. Ser., 8450, 845013 [NASA ADS] [Google Scholar]
- Choi, J., Dotter, A., Conroy, C., et al. 2016, ApJ, 823, 102 [Google Scholar]
- Costa Silva, A. R., Delgado Mena, E., & Tsantaki, M. 2020, A&A, 634, A136 [EDP Sciences] [Google Scholar]
- Dawson, R. I., & Fabrycky, D. C. 2010, ApJ, 722, 937 [Google Scholar]
- Dawson, R. I., & Johnson, J. A. 2018, ARA&A, 56, 175 [Google Scholar]
- Deline, A., Hooton, M. J., Lendl, M., et al. 2022, A&A, 659, A74 [NASA ADS] [CrossRef] [EDP Sciences] [Google Scholar]
- Dorn, C., Venturini, J., Khan, A., et al. 2017, A&A, 597, A37 [NASA ADS] [CrossRef] [EDP Sciences] [Google Scholar]
- Dotter, A. 2016, ApJS, 222, 8 [Google Scholar]
- Doyle, A. P., Davies, G. R., Smalley, B., Chaplin, W. J., & Elsworth, Y. 2014, MNRAS, 444, 3592 [Google Scholar]
- Eastman, J. D., Rodriguez, J. E., Agol, E., et al. 2019, arXiv e-prints [arXiv: 1907.09480] [Google Scholar]
- ESA 1997, ESA SP, 1200 [Google Scholar]
- Espinoza, N. 2018, Res. Notes Am. Astron. Soc., 2, 209 [Google Scholar]
- Espinoza, N., Kossakowski, D., & Brahm, R. 2019, MNRAS, 490, 2262 [Google Scholar]
- Foreman-Mackey, D., Agol, E., Ambikasaran, S., & Angus, R. 2017, AJ, 154, 220 [Google Scholar]
- Fortney, J. J., Dawson, R. I., & Komacek, T. D. 2021, J. Geophys. Res. Planets, 126, e06629 [NASA ADS] [CrossRef] [Google Scholar]
- Fulton, B. J., Petigura, E. A., Blunt, S., & Sinukoff, E. 2018, PASP, 130, 044504 [Google Scholar]
- Gaia Collaboration (Prusti, T., et al.) 2016, A&A, 595, A1 [NASA ADS] [CrossRef] [EDP Sciences] [Google Scholar]
- Gaia Collaboration (Brown, A. G. A., et al.) 2018, A&A, 616, A1 [NASA ADS] [CrossRef] [EDP Sciences] [Google Scholar]
- Gaia Collaboration (Brown, A. G. A., et al.) 2021, A&A, 649, A1 [NASA ADS] [CrossRef] [EDP Sciences] [Google Scholar]
- Gaia Collaboration (Vallenari, A., et al.) 2023, A&A, 674, A1 [NASA ADS] [CrossRef] [EDP Sciences] [Google Scholar]
- Giacalone, S., & Dressing, C. D. 2020, Astrophysics Source Code Library [record ascl:2002.004] [Google Scholar]
- Giacalone, S., Dressing, C. D., Jensen, E. L. N., et al. 2021, AJ, 161, 24 [Google Scholar]
- Gibson, N. P. 2014, MNRAS, 445, 3401 [NASA ADS] [CrossRef] [Google Scholar]
- Gibson, N. P., Aigrain, S., Roberts, S., et al. 2012, MNRAS, 419, 2683 [NASA ADS] [CrossRef] [Google Scholar]
- Goldreich, P., & Tremaine, S. 1980, ApJ, 241, 425 [Google Scholar]
- Gomes da Silva, J., Santos, N. C., Bonfils, X., et al. 2011, A&A, 534, A30 [NASA ADS] [CrossRef] [EDP Sciences] [Google Scholar]
- Gomes da Silva, J., Santos, N. C., Adibekyan, V., et al. 2021, A&A, 646, A77 [NASA ADS] [CrossRef] [EDP Sciences] [Google Scholar]
- Guillot, T., Santos, N. C., Pont, F., et al. 2006, A&A, 453, L21 [CrossRef] [EDP Sciences] [Google Scholar]
- Hasegawa, Y., Bryden, G., Ikoma, M., Vasisht, G., & Swain, M. 2018, ApJ, 865, 32 [NASA ADS] [CrossRef] [Google Scholar]
- Hatzes, A. P. 2013, Astron. Nachr., 334, 616 [NASA ADS] [CrossRef] [Google Scholar]
- Hatzes, A. P., Fridlund, M., Nachmani, G., et al. 2011, ApJ, 743, 75 [NASA ADS] [CrossRef] [Google Scholar]
- Hébrard, G., Díaz, R. F., Correia, A. C. M., et al. 2020, A&A, 640, A32 [EDP Sciences] [Google Scholar]
- Helled, R., Bodenheimer, P., Podolak, M., et al. 2014, in Protostars and Planets VI, eds. H. Beuther, R. S. Klessen, C. P. Dullemond, & T. Henning (Tucson: University of Arizona Press), 643 [Google Scholar]
- Hellier, C., Anderson, D. R., Collier Cameron, A., et al. 2017, MNRAS, 465, 3693 [NASA ADS] [CrossRef] [Google Scholar]
- Henden, A. A., Templeton, M., Terrell, D., et al. 2016, VizieR Online Data Catalog: II/336 [Google Scholar]
- Henry, T. J., Soderblom, D. R., Donahue, R. A., & Baliunas, S. L. 1996, AJ, 111, 439 [Google Scholar]
- Herman, M. K., Zhu, W., & Wu, Y. 2019, AJ, 157, 248 [NASA ADS] [CrossRef] [Google Scholar]
- Hippke, M., & Heller, R. 2019, A&A, 623, A39 [NASA ADS] [CrossRef] [EDP Sciences] [Google Scholar]
- Hord, B. J., Colón, K. D., Kostov, V., et al. 2021, AJ, 162, 263 [NASA ADS] [CrossRef] [Google Scholar]
- Hord, B. J., Colón, K. D., Berger, T. A., et al. 2022, AJ, 164, 13 [NASA ADS] [CrossRef] [Google Scholar]
- Hoyer, S., Guterman, P., Demangeon, O., et al. 2020, A&A, 635, A24 [NASA ADS] [CrossRef] [EDP Sciences] [Google Scholar]
- Huang, C., Wu, Y., & Triaud, A. H. M. J. 2016, ApJ, 825, 98 [NASA ADS] [CrossRef] [Google Scholar]
- Huang, C. X., Quinn, S. N., Vanderburg, A., et al. 2020, ApJ, 892, L7 [CrossRef] [Google Scholar]
- Huber, D., Zinn, J., Bojsen-Hansen, M., et al. 2017, ApJ, 844, 102 [Google Scholar]
- Ivshina, E. S., & Winn, J. N. 2022, ApJS, 259, 62 [CrossRef] [Google Scholar]
- Izidoro, A., Raymond, S. N., Morbidelli, A., Hersant, F., & Pierens, A. 2015, ApJ, 800, L22 [Google Scholar]
- Jehin, E., Gillon, M., Queloz, D., et al. 2011, The Messenger, 145, 2 [NASA ADS] [Google Scholar]
- Jenkins, J. M. 2002, ApJ, 575, 493 [Google Scholar]
- Jenkins, J. M., Chandrasekaran, H., McCauliff, S. D., et al. 2010, SPIE Conf. Ser., 7740, 77400D [Google Scholar]
- Jenkins, J. M., Twicken, J. D., McCauliff, S., et al. 2016, SPIE Conf. Ser., 9913, 99133E [Google Scholar]
- Johansen, A., & Lambrechts, M. 2017, Ann. Rev. Earth Planet. Sci., 45, 359 [Google Scholar]
- Kervella, P., Arenou, F., & Thévenin, F. 2022, A&A, 657, A7 [NASA ADS] [CrossRef] [EDP Sciences] [Google Scholar]
- Kipping, D. M. 2014, MNRAS, 444, 2263 [NASA ADS] [CrossRef] [Google Scholar]
- Kreidberg, L. 2015, PASP, 127, 1161 [Google Scholar]
- Kurucz, R. L. 1993, SYNTHE Spectrum Synthesis Programs and Line Data (Cambridge, Mass.: Smithsonian Astrophysical Observatory) [Google Scholar]
- Lambrechts, M., Morbidelli, A., Jacobson, S. A., et al. 2019, A&A, 627, A83 [NASA ADS] [CrossRef] [EDP Sciences] [Google Scholar]
- Léger, A., Rouan, D., Schneider, J., et al. 2009, A&A, 506, 287 [CrossRef] [EDP Sciences] [Google Scholar]
- Lin, D. N. C., & Ida, S. 1997, ApJ, 477, 781 [NASA ADS] [CrossRef] [Google Scholar]
- Lindegren, L., Bastian, U., Biermann, M., et al. 2021, A&A, 649, A4 [EDP Sciences] [Google Scholar]
- Lomb, N. R. 1976, Ap&SS, 39, 447 [Google Scholar]
- Maciejewski, G., Golonka, J., Loboda, W., et al. 2023, MNRAS, 525, L43 [CrossRef] [Google Scholar]
- Mamajek, E. E., & Hillenbrand, L. A. 2008, ApJ, 687, 1264 [Google Scholar]
- Mayor, M., Pepe, F., Queloz, D., et al. 2003, The Messenger, 114, 20 [NASA ADS] [Google Scholar]
- McLaughlin, D. B. 1924, ApJ, 60, 22 [Google Scholar]
- Miller, N., & Fortney, J. J. 2011, ApJ, 736, L29 [NASA ADS] [CrossRef] [Google Scholar]
- Morton, T. D. 2012, ApJ, 761, 6 [NASA ADS] [CrossRef] [Google Scholar]
- Morton, T. D. 2015, Astrophysics Source Code Library [record ascl:1503.011] [Google Scholar]
- Müller, S., & Helled, R. 2021, MNRAS, 507, 2094 [CrossRef] [Google Scholar]
- Müller, S., & Helled, R. 2023a, A&A, 669, A24 [NASA ADS] [CrossRef] [EDP Sciences] [Google Scholar]
- Müller, S., & Helled, R. 2023b, Front. Astron. Space Sci., 10, 1179000 [CrossRef] [Google Scholar]
- Mustill, A. J., Davies, M. B., & Johansen, A. 2015, ApJ, 808, 14 [NASA ADS] [CrossRef] [Google Scholar]
- Naef, D., Latham, D. W., Mayor, M., et al. 2001, A&A, 375, L27 [NASA ADS] [CrossRef] [EDP Sciences] [Google Scholar]
- Noyes, R. W., Hartmann, L. W., Baliunas, S. L., Duncan, D. K., & Vaughan, A. H. 1984, ApJ, 279, 763 [Google Scholar]
- Otegi, J. F., Bouchy, F., & Helled, R. 2020, A&A, 634, A43 [NASA ADS] [CrossRef] [EDP Sciences] [Google Scholar]
- Parc, L., Bouchy, F., Venturini, J., Dorn, C., & Helled, R. 2024, A&A, 688, A59 [NASA ADS] [CrossRef] [EDP Sciences] [Google Scholar]
- Pecaut, M. J., & Mamajek, E. E. 2013, ApJS, 208, 9 [Google Scholar]
- Pepe, F., Mayor, M., Rupprecht, G., et al. 2002, The Messenger, 110, 9 [NASA ADS] [Google Scholar]
- Pepe, F., Cristiani, S., Rebolo, R., et al. 2021, A&A, 645, A96 [NASA ADS] [CrossRef] [EDP Sciences] [Google Scholar]
- Perger, M., Ribas, I., Damasso, M., et al. 2017, A&A, 608, A63 [NASA ADS] [CrossRef] [EDP Sciences] [Google Scholar]
- Pollacco, D. L., Skillen, I., Collier Cameron, A., et al. 2006, PASP, 118, 1407 [NASA ADS] [CrossRef] [Google Scholar]
- Queloz, D., Mayor, M., Udry, S., et al. 2001, The Messenger, 105, 1 [NASA ADS] [Google Scholar]
- Queloz, D., Bouchy, F., Moutou, C., et al. 2009, A&A, 506, 303 [NASA ADS] [CrossRef] [EDP Sciences] [Google Scholar]
- Rajpaul, V., Aigrain, S., Osborne, M. A., Reece, S., & Roberts, S. 2015, MNRAS, 452, 2269 [Google Scholar]
- Rasio, F. A., & Ford, E. B. 1996, Science, 274, 954 [Google Scholar]
- Ricker, G. R., Winn, J. N., Vanderspek, R., et al. 2015, J. Astron. Teles. Instrum. Syst., 1, 014003 [Google Scholar]
- Roberts, D. H., Lehar, J., & Dreher, J. W. 1987, AJ, 93, 968 [Google Scholar]
- Roberts, S., Osborne, M., Ebden, M., et al. 2013, Phil. Trans. R. Soc. London Ser. A, 371, 20110550 [Google Scholar]
- Rosenthal, L. J., Knutson, H. A., Chachan, Y., et al. 2022, ApJS, 262, 1 [Google Scholar]
- Rossiter, R. A. 1924, ApJ, 60, 15 [Google Scholar]
- Santos, N. C., Sousa, S. G., Mortier, A., et al. 2013, A&A, 556, A150 [NASA ADS] [CrossRef] [EDP Sciences] [Google Scholar]
- Santos, N. C., Santerne, A., Faria, J. P., et al. 2016, A&A, 592, A13 [NASA ADS] [CrossRef] [EDP Sciences] [Google Scholar]
- Scargle, J. D. 1982, ApJ, 263, 835 [Google Scholar]
- Schlafly, E. F., & Finkbeiner, D. P. 2011, ApJ, 737, 103 [Google Scholar]
- Ségransan, D., Udry, S., Mayor, M., et al. 2010, A&A, 511, A45 [NASA ADS] [CrossRef] [EDP Sciences] [Google Scholar]
- Sha, L., Vanderburg, A. M., Huang, C. X., et al. 2023, MNRAS, 524, 1113 [NASA ADS] [CrossRef] [Google Scholar]
- Skrutskie, M. F., Cutri, R. M., Stiening, R., et al. 2006, AJ, 131, 1163 [NASA ADS] [CrossRef] [Google Scholar]
- Smith, J. C., Stumpe, M. C., Van Cleve, J. E., et al. 2012, PASP, 124, 1000 [Google Scholar]
- Sneden, C. A. 1973, PhD thesis, The University of Texas at Austin, USA [Google Scholar]
- Snellen, I. A. G., & Brown, A. G. A. 2018, Nat. Astron., 2, 883 [Google Scholar]
- Sousa, S. G. 2014, in Determination of Atmospheric Parameters of B, eds. E. Niemczura, B. Smalley, & W. Pych (Berlin: Springer), 297 [CrossRef] [Google Scholar]
- Sousa, S. G., Santos, N. C., Adibekyan, V., Delgado-Mena, E., & Israelian, G. 2015, A&A, 577, A67 [NASA ADS] [CrossRef] [EDP Sciences] [Google Scholar]
- Speagle, J. S. 2019, arXiv e-prints [arXiv:1909.12313] [Google Scholar]
- Stassun, K. G., Oelkers, R. J., Pepper, J., et al. 2018, AJ, 156, 102 [Google Scholar]
- Stassun, K. G., Oelkers, R. J., Paegert, M., et al. 2019, AJ, 158, 138 [Google Scholar]
- Steffen, J. H., Ragozzine, D., Fabrycky, D. C., et al. 2012, Proc. Natl. Acad. Sci., 109, 7982 [NASA ADS] [CrossRef] [Google Scholar]
- Stumpe, M. C., Smith, J. C., Van Cleve, J. E., et al. 2012, PASP, 124, 985 [Google Scholar]
- Stumpe, M. C., Smith, J. C., Catanzarite, J. H., et al. 2014, PASP, 126, 100 [Google Scholar]
- Suárez Mascareño, A., Rebolo, R., González Hernandez, J. I., & Esposito, M. 2015, MNRAS, 452, 2745 [CrossRef] [Google Scholar]
- Thorngren, D. P., Fortney, J. J., Murray-Clay, R. A., & Lopez, E. D. 2016, ApJ, 831, 64 [NASA ADS] [CrossRef] [Google Scholar]
- Tokovinin, A. 2018, PASP, 130, 035002 [Google Scholar]
- Wang, X.-Y., Wang, Y.-H., Wang, S., et al. 2021, ApJS, 255, 15 [NASA ADS] [CrossRef] [Google Scholar]
- Ward, W. R. 1997, Icarus, 126, 261 [Google Scholar]
- Weidenschilling, S. J., & Marzari, F. 1996, Nature, 384, 619 [Google Scholar]
- Weiss, L. M., Marcy, G. W., Rowe, J. F., et al. 2013, ApJ, 768, 14 [Google Scholar]
- Weiss, L. M., Fabrycky, D. C., Agol, E., et al. 2020, AJ, 159, 242 [NASA ADS] [CrossRef] [Google Scholar]
- Wilson, O. C. 1978, ApJ, 226, 379 [Google Scholar]
- Winn, J. N. 2010, in Exoplanets, ed. S. Seager (USA: NASA), 55 [Google Scholar]
- Wright, J. T., Upadhyay, S., Marcy, G. W., et al. 2009, ApJ, 693, 1084 [NASA ADS] [CrossRef] [Google Scholar]
- Wright, E. L., Eisenhardt, P. R. M., Mainzer, A. K., et al. 2010, AJ, 140, 1868 [Google Scholar]
- Wu, Y., & Murray, N. 2003, ApJ, 589, 605 [Google Scholar]
- Wu, D.-H., Rice, M., & Wang, S. 2023, AJ, 165, 171 [NASA ADS] [CrossRef] [Google Scholar]
- Zechmeister, M., & Kürster, M. 2009, A&A, 496, 577 [CrossRef] [EDP Sciences] [Google Scholar]
- Zhu, W. 2024, Res. Astron. Astrophys., 24, 045013 [CrossRef] [Google Scholar]
- Zhu, W., & Wu, Y. 2018, AJ, 156, 92 [Google Scholar]
- Zhu, W., Dai, F., & Masuda, K. 2018, Res. Notes Am. Astron. Soc., 2, 160 [Google Scholar]
The last version of ARES code (ARES v2) can be downloaded at https://github.com/sousasag/ARES
All Tables
WASP-132 system and instrumental parameters from juliet: median and 68% confidence interval.
All Figures
|
Fig. 1 WASP-132 RVs and periodogram. Top: WASP-132 CORALIE and HARPS RVs with a two-planet (excluding the 1-day planet) Keplerian model plus a linear trend as described in Sect. 3.2.2. Bottom: GLS periodogram of the original CORALIE and HARPS RVs. The vertical gray dashed lines display the planet periods presented in Sect. 3.4. |
| In the text | |
|
Fig. 2 HARPS RV residuals, periodogram, and activity periodograms. Top: HARPS RV residuals after fitting CORALIE and HARPS data with a two-planet plus trend model and its corresponding and GLS periodogram. Bottom: GLS periodograms for the HARPS data activity indicators CCF FWHM, CCF BIS, and Mt Wilson S index SMW from top to bottom respectively. The gray vertical bands show the possible rotation period Prot = 33 ± 3 days and harmonics Prot/2 and Prot/3. |
| In the text | |
|
Fig. 3 HARPS RV residuals Keplerian and GP model fit. Top: HARPS RV residuals after fitting CORALIE and HARPS data with a two-planet plus trend model described in Sect. 3.2.2 with a one-planet Keplerian plus GP model constrained by the HARPS RV and BIS. Middle: GP fit to the HARPS BIS data. Bottom: HARPS RV residuals from the top phased to the 1-day planet model. |
| In the text | |
|
Fig. 4 HARPS RV residuals after fitting CORALIE and HARPS data with a two-planet plus trend model described in Sect. 3.2.2. Here we only include HARPS data that had two observations in one night for a total of 12 nights. We then fit a single Keplerian model with each night treated as different instrument with its own offset. Each night is shown with different colors. We show the phased RV plot in the bottom. |
| In the text | |
|
Fig. 5 pyaneti fit to RV data including three Keplerian models, a linear trend, and a GP described in Sect. 3.2.2. The lower three plots show the phased RV curves of the 1-day, 7-day, and ~1811-day outer planet respectively. |
| In the text | |
|
Fig. 6 WASP-132 TESS and CHEOPS photometry data. Phased fitto WASP-132 c with all three TESS sectors (top). Phased fit to WASP- 132 c with CHEOPS (middle). Phased fit to WASP-132 b with all three TESS sectors (bottom). The transit fit from juliet is described in Sect. 3.4. 5-minute TESS bins and 20-minute CHEOPS bins are shown in blue for display purposes. |
| In the text | |
|
Fig. 7 RV fit from global juliet model to WASP-132. The top plot shows the full RV set with the different model components. The second from the top shows the phased RV data and juliet fit to planet c with only the HARPS data plotted, while the bottom two plots show planets b and d, respectively, with both HARPS and CORALIE data. |
| In the text | |
|
Fig. 8 TTVs of WASP-132 b determined with juliet on TESS data and the TRAPPIST transit from Hellier et al. (2017). The gray area represents the 1σ uncertainty of the T0 from our global analysis. |
| In the text | |
|
Fig. 9 WASP-132 b’s radius as a function of time. The green lines display the cooling of WASP-132 b assuming different bulk metallicity values between zero and 25%. The gray error bars show the measured values. The planet must be enriched in heavy elements to match the observations. |
| In the text | |
|
Fig. 10 Posterior distribution of the inferred heavy-element mass fraction of WASP-132b. The distribution is approximately Gaussian, with a mean of μZ = 13% and a standard deviation of σZ = 6%. |
| In the text | |
|
Fig. 11 Mass-radius diagram of small exoplanets with precise densities (σM/M ≤ 25% and σR/R ≤ 8%) from the PlanetS catalog (Otegi et al. 2020; Parc et al. 2024). The red stars correspond to known small planets (R < 4 R⊕), with precise radius and mass measurements, that have a hot or warm Jupiter companion (R > 0.8 RJup). Orange dots are planets in multi-planet system of all kinds. Gray dots are planets in singleplanet system. Composition lines are displayed for pure-iron (brown) and Earth-like planets (light-brown). |
| In the text | |
Current usage metrics show cumulative count of Article Views (full-text article views including HTML views, PDF and ePub downloads, according to the available data) and Abstracts Views on Vision4Press platform.
Data correspond to usage on the plateform after 2015. The current usage metrics is available 48-96 hours after online publication and is updated daily on week days.
Initial download of the metrics may take a while.