| Issue |
A&A
Volume 692, December 2024
|
|
|---|---|---|
| Article Number | A257 | |
| Number of page(s) | 13 | |
| Section | The Sun and the Heliosphere | |
| DOI | https://doi.org/10.1051/0004-6361/202451950 | |
| Published online | 17 December 2024 | |
A solar rotation signature in cosmic dust observed in STEREO spacecraft data
1
Department of Physics, University of Colorado, Boulder, Boulder, Colorado, USA
2
Astrophysical and Planetary Science Department, University of Colorado, Boulder, Boulder, Colorado, USA
3
Laboratory for Atmospheric and Space Physics, University of Colorado, Boulder, Boulder, Colorado, USA
4
Institute for Particle Physics and Astrophysics, Physics Department, ETH Zürich, Wolfgang-Pauli Strasse 27, Zürich 8093, Switzerland
5
Smead Aerospace Engineering Sciences Department, University of Colorado, Boulder, CO 80303, USA
⋆ Corresponding authors; This email address is being protected from spambots. You need JavaScript enabled to view it.
, This email address is being protected from spambots. You need JavaScript enabled to view it.
Received:
22
August
2024
Accepted:
10
November
2024
Abstract
Aims. Cosmic dust within the Solar System is subject to a range of forces that can modify its trajectory, including gravity, radiation pressure, and the Lorentz force. Lorentz force interactions between the solar wind and dust arise due to the motion of charged dust grains with respect to the solar wind plasma flow and the magnetic fields carried by that flow. For dust grains where the charge to mass ratio is sufficiently large, the Lorentz force can significantly modify the dust grain motion. At the same time, properties of the magnetic fields and plasma in the solar wind are modulated by solar periodicities, such as the 11-year solar cycle and the solar rotation period. These solar periodicities are therefore expected to be imparted onto the trajectories of dust moving within the Solar System via Lorentz force interactions.
Methods. We examined nearly two decades of cosmic dust observations made by the twin STEREO spacecraft at 1 AU for periodicities in the dust flux. We created a two-dimensional toy model to examine whether it is reasonable to expect solar-rotation variability in solar wind magnetic field and plasma velocities to modify the trajectories of dust that reaches 1 AU.
Results. Periodic modulations of the dust flux observed by STEREO at 1 AU are identified near the solar rotation period and its harmonics. The toy model suggests that solar-rotation variability of the solar wind can be sufficient to alter the trajectories of some dust within the Solar System.
Key words: Sun: magnetic fields / Sun: rotation / solar wind / meteorites / meteors / meteoroids / zodiacal dust
© The Authors 2024
 Open Access article, published by EDP Sciences, under the terms of the Creative Commons Attribution License (https://creativecommons.org/licenses/by/4.0), which permits unrestricted use, distribution, and reproduction in any medium, provided the original work is properly cited.
This article is published in open access under the Subscribe to Open model. This email address is being protected from spambots. You need JavaScript enabled to view it. to support open access publication.
1. Introduction
The Solar System is permeated by dust: small grains (tens of nanometers to 100 μm) of rocky, metallic, or icy material. One population of dust, called interplanetary dust particles (IDPs), originates within the Solar System, primarily from comets, asteroids, and Kuiper belt objects (Koschny et al. 2019, and references therein). Another population of dust, called interstellar dust (ISD), consists of grains originating outside the Solar System (Sterken et al. 2019, and references therein). ISD material flows into and through the heliosphere due to the relative motion of the Sun and local interstellar clouds of gas and dust (Grün et al. 1993).
The trajectories of IDPs and ISD through the Solar System are determined by the forces that act upon them. The primary forces are gravity, solar radiation pressure, the Poynting-Robertson effect, the Yarkovsky effect, and the Lorentz force (Koschny et al. 2019). The relative strengths of these forces vary with the dust grain properties (mass, radius, and composition), with the dust grain location relative to the Sun, and with changes in the solar wind and solar photon environment.
Like any object embedded in a plasma (Garrett 1981), IDPs and ISD experience surface charging. Small dust grains (≲0.5 μm radius) can reach sufficiently high surface charge to mass ratios (q/m) that the Lorentz force can be comparable to or greater than the other forces (Sterken et al. 2015). Consequently, the trajectories of high q/m dust grains can be significantly modified by solar wind variability. Changes in the solar wind density and temperature influence surface charging, while changes in the solar wind velocity and vector magnetic field modify the Lorentz force exerted upon a dust grain.
The Lorentz force is FL = q(E + v × B), where q is the electrostatic charge on the object experiencing the Lorentz force, E is the electric field in the frame of the object, v is the plasma flow velocity with respect to the object, and B is the magnetic field vector. For a charged dust grain in the solar wind, changes in the solar wind flow velocity (primarily the speed, since the flow is directed anti-sunward) and the magnetic field (direction and magnitude) are expected to produce the most significant changes to the dust motion.
The solar wind magnetic field in particular experiences strong periodic variability. For example, the polarity of the global solar wind magnetic field flips every ∼11 years with the solar cycle (e.g., Leamon et al. 2022). Theoretical and modeling results have long predicted that this polarity flip should create a solar cycle modulation of interplanetary (Morfill & Grün 1979; Hamilton et al. 1996) and ISD flow through the Solar System (Landgraf 2000; Czechowski & Mann 2003; Sterken et al. 2012, 2015). The solar magnetic polarity reversal was predicted to create intervals where ISD is “focused” or “defocused” with respect to the ecliptic, where the focusing or defocusing determines whether or not ISD with trajectories dominated by the Lorentz force is capable of reaching the inner Solar System (< 5 AU). Recent studies have identified the predicted periodic modulation of ISD fluxes due to focusing and defocusing over the solar cycle using several decades of data recorded by the Wind spacecraft at 1 AU (Hervig et al. 2022; Baalmann et al. 2024).
However, the solar cycle is not the only timescale over which the solar wind magnetic field varies periodically. The heliospheric current sheet (HCS; the boundary between the northern and southern solar magnetic polarities) is nonuniform with respect to the solar rotation plane (Smith 2001). As a consequence, an observer near the solar rotation plane will see the polarity of the solar wind magnetic field alternate on timescales near the solar rotation rate (Imada et al. 2020). This variability is expected to modulate the Lorentz force experienced by charged dust particles, such as ISD, as they traverse the Solar System, thereby modulating the flux of dust grains that reach 1 AU (Morfill & Grün 1979; Gruen et al. 1994; Landgraf et al. 2002; Czechowski & Mann 2003; Sterken et al. 2012, 2015).
A periodic modulation of dust flux at the solar rotation frequency was discovered by Baalmann et al. (2024) using the Wind spacecraft dust detection database (Malaspina & Wilson 2016). Here we seek to corroborate this finding, by searching for periodic variability of dust populations at 1 AU using long-duration observations (∼16 yr) from the twin Solar TErrestrial RElations Observatory (STEREO) spacecraft (Kaiser et al. 2008). Modulation of the dust flux observed by STEREO with a periodicity near the solar rotation rate is identified, supporting the Baalmann et al. (2024) result. This modulation signal is strongest when the STEREO spacecraft are moving against the ISD flow direction and during the ISD focusing phase. A toy model was created to examine whether it is reasonable to expect solar-rotation variability in solar wind magnetic field and plasma velocities to modify the trajectories of dust that reaches 1 AU.
Both the Wind data examined by Baalmann et al. (2024) and the STEREO data examined in the present study demonstrate that solar magnetic field periodicities can be imprinted on the flow of dust through the Solar System via the Lorentz force.
2. Instrument description
This study used dust data from the STEREO spacecraft (Kaiser et al. 2008). The STEREO mission consists of twin spacecraft (A and B) that orbit the Sun near 1 AU. STEREO Ahead (STEREO A) leads the Earth and STEREO Behind (STEREO B) lags behind the Earth. The orbital period of STEREO A about the Sun is 347 days. The STEREO B orbital period is 387 days. The two spacecraft move azimuthally with respect to one another at approximately 44–45 degrees every year, as viewed from the Sun. These spacecraft were launched in October 2006. As of 2024, STEREO-A is still functional, while contact was lost with STEREO-B in 2014. Near 2014-2015, the STEREO spacecraft were on the opposite side of the Sun with respect to Earth, and communications with the spacecraft were limited, greatly reducing the data that could be collected during this time period. STEREO-A observations span more than 16 years, while STEREO-B observations span ∼7 years.
This study made use of the WAVES instrument on STEREO (S/WAVES; Bougeret et al. 2008). S/WAVES sensors are three mutually orthogonal ∼6 m monopole antennas, deployed in the anti-sunward direction with a common base mount (see Fig. 15 in Bale et al. 2009 or Fig. 2 in Kaiser et al. 2008). S/WAVES detects both IDPs and ISD via impact ionization (e.g., Zaslavsky et al. 2012; Malaspina et al. 2015, and references therein). When micrometeoroids strike a spacecraft with impact velocities in excess of 1 km/s, they vaporize and ionize, producing a transient plasma cloud. This cloud perturbs the electrostatic potential near STEREO and is detected by S/WAVES as a brief (< ms) voltage spike. Detailed physics of this process has been determined via laboratory experiments (e.g., Shen et al. 2022 and references therein). Many missions have taken advantage of this process to make dust observations in the absence of dedicated dust detector instruments (see, for example, Pusack et al. 2021 and references therein).
On STEREO specifically, two distinct classes of dust impacts are reported (Zaslavsky et al. 2012). One is “single hit” dust impacts, where only one of the three S/WAVES antennas detects a voltage spike. The other is “triple hit” dust impacts, where all three S/WAVES antennas detect a voltage spike nearly simultaneously. Based on their high count rates and high time variability, single hits were initially interpreted as evidence of interplanetary dust with nanometer radii (Meyer-Vernet et al. 2009; Zaslavsky et al. 2012), but later studies disputed this (Kellogg et al. 2016). While this issue remains unresolved, no other spacecraft detecting dust with electric field instruments has reported observations consistent with the STEREO single hits. This study utilizes only triple hit dust data. STEREO triple hit detections were shown to be consistent with a combination of IDPs and ISD of approximately micron or submicron radii (Zaslavsky et al. 2012; Malaspina et al. 2015). This was independently confirmed by comparing observations of yearly ISD modulation at 1 AU between STEREO and Wind (Kellogg et al. 2016).
3. Data description
To carry out this study, it is necessary to create a database of dust impacts detected by the STEREO spacecraft. This is accomplished using TDSmax data from the Time Domain Sampler (TDS) receiver, a signal processing electronics board that is part of the S/WAVES instrument (Bougeret et al. 2008). The TDS samples signals from the three S/WAVES antennas at 250 000 samples per second. TDSmax is a low-rate data product wherein the TDS reports the largest amplitude absolute value voltage signal detected on each of the three S/WAVES antennas each minute. While the TDSmax information content is low (three values each minute), it is continuous, spanning the entire STEREO mission (∼16 years on STEREO-A and ∼7 years on STEREO-B).
3.1. Triple hit selection
Several studies have demonstrated that the flux and variability of triple hit events are consistent with prior observations of IDPs and ISD, while the flux and variability of single hits are not (Zaslavsky et al. 2012; Malaspina et al. 2015; Kellogg et al. 2016). Therefore, the study is limited to triple hit events, which makes it necessary to eliminate signals consistent with single hits from consideration. This is accomplished by the following selection criteria: TDSmax events are only considered as potential triple hit dust impacts if (i) the ratio of the TDSmax amplitude among all antenna pairs is between 0.1 and 10, and (ii) the amplitude on all of the three antennas exceeds 15 mV. These are necessary, but not sufficient conditions to identify triple hits. Signals where one or more of the antenna signals exceed the saturation range (∼170 mV) are allowed in the database. These criteria were implemented in a previous study of the STEREO dust data (Malaspina et al. 2015).
3.2. Eliminating plasma waves
TDSmax frequently detects in situ solar wind plasma waves. In the TDS frequency bandpass, Langmuir waves commonly have amplitudes similar to dust impact voltage spike amplitudes, though whistler-mode and lower frequency waves can also have sufficiently large amplitudes on occasion. Furthermore, plasma waves are likely to produce similar amplitude signals on all three S/WAVES antennas, mimicking triple hit signatures. Plasma wave amplitudes are often similar on the three STEREO antennas because the antennas are short compared to a Debye length (∼6 m antennas, ∼15 m Debye length at 1 AU solar wind plasma), and they are mechanically mounted to a common base point. In situ plasma waves detected by TDSmax must therefore be identified and removed from consideration. This removal is accomplished by a two-step process.
The first step utilizes data from the Low Frequency Receiver (LFR) on S/WAVES. These are spectral data, continuously reported as spectra averaged over a reporting cadence. For each LFR spectral sample (∼40 s cadence), the peak amplitude at any frequency is determined. A ratio is then calculated (R = peak amplitude/amplitude in the lowest frequency bin). The lowest frequency bin is centered on ∼2610 Hz. If this ratio exceeds a threshold (taken to be 10), then the LFR sample is considered to contain a plasma wave.
This algorithm is effective because natural plasma waves observed by STEREO are typically Langmuir waves (driven by Type III radio bursts, interplanetary shocks, or associated with magnetic holes in the solar wind; Briand 2015), or whistler-mode waves (due to interplanetary shocks or sporadically generated by electron strahl; Tong et al. 2019). Both of these wave modes are narrowband, occupying only a few frequency bins in the LFR data. Langmuir waves in particular often occur at frequencies above the lowest LFR frequency bin. Dust impacts also create a spectral signature in the LFR. This signature is broadband because it is the Fourier transform of the time-series voltage impulse created by the dust impact plasma cloud. Given the duration of the impulses (a few microseconds), the spectral signature of a dust impact in LFR has most of its amplitude near a few kilohertz, in the lowest LFR frequency bin. As such, dust signals have a low value of R while narrowband plasma waves will have a high value of R. Furthermore, the LFR is designed to be sensitive to weak radio signals (Bougeret et al. 2008). In situ plasma waves often saturate the receiver in the frequency bins where plasma waves appear, leading to large values of R.
Using this algorithm, all STEREO LFR data are scanned for signatures of plasma waves. When plasma waves are detected and found to overlap with a triple hit TDSmax dust identification, the data are flagged as “not dust”. This LFR wave filtering method removes many plasma waves from consideration, but not all.
A second wave removal step is required because the TDSmax measures amplitude peaks on time cadences (∼10 ms) that are much shorter than the time cadence over which LFR data are averaged (∼40 s). Therefore, short duration waves (≪40 s) will often not have significant amplitudes in LFR data, but will still appear in TDSmax. To filter the remaining plasma wave activity from TDSmax, a simple clustering criterion is used. Dust impacts on STEREO due to IDPs and ISD at 1 AU are infrequent, even considering the spacecraft collecting area (full surface) of several squaremeters. 30–40 impacts per day are typical (e.g., Malaspina et al. 2015). This amounts to 1-2 counts per hour on average. Therefore, the TDSmax data are examined for anomalously dense clusters of TDSmax potential detections, and those data are removed from consideration. The following algorithm is used: (i) for each potential TDSmax triple hit dust detection, a 1 hour window, centered on the TDSmax event time, is examined for other TDSmax triple hit detections, (ii) the density of impacts for this time window is then determined (# impacts/hr). If the impact detection density exceeds a threshold (taken to be 4), then that TDSmax event is flagged as “not dust”. This algorithm is applied to all TDSmax data.
3.3. Impact rate determination
Once all TDSmax events have been flagged as either triple hit dust detections or “not dust”, the dust impact rate for each 24 hour time window is calculated by dividing the number of impacts detected in this time window by the cumulative time duration of TDSmax samples within that window where no plasma waves were detected. Plasma wave intervals are counted as detection dead time because the TDSmax cannot observe dust impacts unambiguously when plasma waves are observed.
This resulting STEREO dust impact rate database is analyzed in the remainder of the study. Assuming that the dust detection area of the spacecraft is constant in time (at a few square meters), the dust impact rate may be interpreted as a dust flux (impacts/time/area).
4. Data analysis
4.1. Dust data analysis
Figure 1 provides an overview of the STEREO dust impact rate data. Figure 1a shows the dust count rate, in counts per day, recorded by STEREO A between 1 January 2007 and 1 January 2023. The daily rate data are shown in blue. A version of these data, smoothed using a 61-day sliding median filter, is shown in orange. Figure 1b is in the same format as Fig. 1a, but shows data from STEREO B. Figure 1c shows the number of sunspots per day over the same time range as Fig. 1a, to give context on the dust observations relative to the solar cycle. The same smoothing is applied to the sunspot data as was applied in Fig. 1a. The gray-shaded regions indicate times when STEREO A was behind the Sun relative to Earth (1 September 2014 to 1 January 2016). During this interval, communication with the spacecraft was limited and the dust impact data have significant gaps. Data from inside this interval are therefore not considered in this analysis. Contact with STEREO B was lost on 1 October 2014, just before STEREO B passed behind the Sun; therefore, no STEREO B data are available after this date.
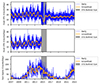 |
Fig. 1. Dust count rates as a function of time on the STEREO spacecraft. (a) Dust counts per day (blue) on STEREO A, and dust counts per day smoothed using a 61-day median running window (orange). (b) Same as (a), but for STEREO B. (c) Sun spot number per day as a function of time (blue), and sunspot data smoothed using a 61-day median running window (orange). |
The dust rate data in Fig. 1 show strong oscillations on both STEREO A and STEREO B from 2007 to 2015. The dust rate enhances as each STEREO spacecraft moves against the ISD flow, and the dust rate falls as each spacecraft moves with the ISD flow. This pattern has been reported and examined by prior authors (Zaslavsky et al. 2012; Malaspina et al. 2014; Wood et al. 2015; Kellogg et al. 2016). The oscillations in dust rate data observed by STEREO A are significantly smaller after 2017, where a change in the global solar magnetic field polarity causes defocusing of ISD trajectories through the Solar System.
Figure 2 shows a wavelet analysis of the daily dust count data in Fig. 1a. This analysis focuses on the data from STEREO A between 1 January 2007 and 1 September 2014. In this time range, the global solar magnetic field polarity focuses ISD toward the ecliptic plane. Therefore, this interval is referred to as STEREO A, focusing interval.
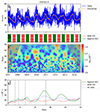 |
Fig. 2. STEREO A observations of dust and its periodicity during an ISD focusing interval. (a) Daily dust count rate (blue) and median-smoothed count rate data (orange). (b) Indications of when STEREO A is moving in (red) or against (green) the interstellar flow direction. (c) Wavelet spectrogram of the daily dust count data from (a). (d) Wavelet power spectral values averaged over time, as a function of oscillation period. The three lines indicate averages over different time intervals: when STEREO A moves against the ISD flow (solid green), when it moves with the ISD flow (dashed red), and all time during the STEREO A focusing interval (dotted blue). |
Figure 2a shows a time series of the dust count rate data in a similar format to Fig. 1a. Figure 2b indicates when STEREO A is located in an ecliptic longitude (ϕeclip) range where the spacecraft is moving with or against the ISD flow direction. “Against ISD” (indicated by solid green lines) is defined as ϕeclip from 109° to 227°. “With ISD” (indicated by dashed red lines) is defined as ϕeclip from 293° to 48°, and includes crossings through 360° /0°.
Dust count rates increase when a spacecraft is moving against the interstellar flow direction and decrease when a spacecraft is moving with the interstellar flow (Zaslavsky et al. 2012; Malaspina et al. 2014; Wood et al. 2015; Kellogg et al. 2016). When a spacecraft orbits the Sun in a direction against the ISD flow, the relative impact speed of the ISD in the frame of the spacecraft is larger. This causes both an increase in the ISD flux (more impacts per unit time) and a change in detection efficiency of ISD detection. A larger dust impact speed in the frame of the spacecraft creates a larger plasma cloud and a stronger voltage signal that is more likely to be detected. IDPs are, on average, homogeneously spread throughout near-circular orbits. Therefore, IDPs count rates do not show a dependence on ecliptic longitude (ϕeclip; Zaslavsky et al. 2012; Malaspina et al. 2014; Kellogg et al. 2016), except for stochastic fluctuations. From Fig. 2a, it can be seen that when STEREO A is most against the ISD flow direction, the total dust count rate approximately doubles compared to times when the spacecraft is moving with the ISD flow direction.
Figure 2c shows a spectrogram of wavelet power. The wavelet analysis is conducted using the continuous wavelet transform provided as part of the pywavelet Python package. A complex Morlet wavelet with a normalized center frequency (C) of 1.5 and a normalized bandwidth (B) of 2.0 is used. These wavelet parameters are chosen to best resolve periodicities between ∼5 days and ∼50 days. The wavelet is defined, as a function of time (t) as
 (1)
(1)
The cone of influence for this wavelet transform is indicated as shaded gray regions. Wavelet transform data within the cone of influence is not considered in the subsequent analysis. In Fig. 2c, wavelet power near the approximate solar rotation period of 27 days is enhanced at times when STEREO A is moving against the ISD flow (green regions in Fig. 2b) and depressed when STEREO A is moving with the ISD flow (red regions in Fig. 2b).
Figure 2d shows wavelet power as a function of period (days), averaged across time. The dotted blue curve shows the mean wavelet power for all times during the STEREO A focusing interval. The solid green curve shows the mean wavelet power for all times during the STEREO A focusing interval where STEREO A was moving against the interstellar flow (green regions in Fig. 2b). The dashed red curve shows the mean wavelet power for all times during the STEREO A focusing interval where STEREO A was moving with the interstellar flow (red regions in Fig. 2b). Vertical dashed gray lines indicate the approximate solar rotation period of 27 days and its harmonics: 27/2 = 13.5 days, 27/3 = 9 days, and 27/4 = 6.75 days.
A prominent peak in the wavelet power is observed near the solar rotation period when STEREO A is moving against the ISD flow direction (green regions in Fig. 2b). This peak is weaker when averaged over all data, and the peak is not clear when STEREO A is moving with the ISD flow direction (red regions in Fig. 2b). The peak is shifted to a slightly shorter period (∼26 days) compared to the 27-day solar rotation period observed from Earth.
Figure 3 shows the results of an identical wavelet analysis applied to STEREO A dust data between 1 January 2017 and 1 September 2021. In this time range, the global solar magnetic field polarity defocuses ISD away from the ecliptic plane. Therefore, this interval is referred to as STEREO A, defocusing interval. Figure 3a shows weak variation of dust flux with (ϕeclip), indicating that a low flux of ISD is reaching 1 AU space.
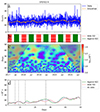 |
Fig. 3. STEREO A observations of dust and its periodicity during an ISD defocusing interval. The format is the same as in Fig. 2. |
Figure 3d shows the wavelet power spectra during this interval. No strong peak is evident near the solar rotation period during the STEREO A defocusing interval, regardless of whether STEREO A is moving with or against the ISD flow direction.
Figure 4 shows the results of an identical wavelet analysis applied to STEREO B dust data between 1 January 2007 and 1 September 2014. In this time range, the global solar magnetic field polarity focuses ISD toward the ecliptic plane. Therefore, this interval is referred to as STEREO B, focusing interval.
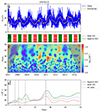 |
Fig. 4. STEREO B observations of dust and its periodicity during an ISD focusing interval. The format is the same as in Fig. 2. |
Figures 4c and 4d show the wavelet power spectra during this interval. A peak near the solar rotation period is observed during the STEREO B focusing interval, but shifted to a longer period (∼28 days) compared to the 27 day solar rotation period observed from Earth. This peak is strongest (both in magnitude and relative to the power in nearby frequencies) when STEREO B is moving against the ISD flow. The wavelet power peak near the solar rotation period observed by STEREO B when STEREO B is moving against the interstellar flow during the focusing interval is nearly the same magnitude as the corresponding peak on STEREO A. The wavelet power peak on STEREO B is significantly weaker (again, both in magnitude and relative to the power in nearby frequencies) when STEREO B is moving with the ISD flow. Additional spectral peaks are observed near harmonics of the solar rotation period.
The data presented in this section demonstrate periodicities in dust observations by the STEREO spacecraft. These periodicities are strongest near the solar rotation period when the STEREO spacecraft are moving into the ISD flow direction and when the global solar magnetic polarity focuses ISD toward the ecliptic.
Of the primary forces that determine dust motion in the Solar System, solar gravity and solar radiation pressure are not known to have significant periodicities near the solar rotation period. However, the solar wind velocity and magnetic field do have strong periodicities near the solar rotation period (demonstrated in the next subsection) and together, these properties of the solar wind determine the strength of the Lorentz force experienced by dust grains.
4.2. Solar wind data analysis
Several properties of the solar wind are known to be modulated at the solar rotation period, including the solar wind speed (via the presence of high-speed streams; Krieger et al. 1973) and the polarity of the solar wind magnetic field as measured by an observer near the solar rotation plane (via tilt of the HCS; Smith 2001). Because the Lorentz force depends on both the solar magnetic field vector and the relative velocity between the solar wind and dust grains, either of these modulations can transmit the period of solar rotation into motion of dust grains (Gruen et al. 1994; Landgraf 2000; Sterken et al. 2012; Strub et al. 2019).
The temporal variability of solar wind speed and magnetic field direction are examined here during the studied interval in order to compare them with the modulation of dust flux. Solar wind data measured near the L1 Sun-Earth Lagrange point from the OMNI database (Papitashvili & King 2020) are used to examine periodicities in solar wind properties, with the understanding that periodicities present in the solar wind at 1 AU propagate outward through the entire Solar System. One hour resolution OMNI data are used, then downsampled to 1 value per day by taking a median of the hourly data each day. Two data products are examined here: (i) the radial component of the solar wind magnetic field (Bx, in the GSE coordinate system), and (ii) the solar wind flow speed.
Figure 5 shows a wavelet analysis of Bx OMNI data between 1 January 2007 and 1 January 2023. The same wavelet used to analyze the dust data in the prior section is used here. Figure 5a shows the daily (blue) and 61-day median smoothed (orange) time-series data for Bx. Figure 5b shows the wavelet power spectrum of the signed unit vector  . Periods between ∼1 day and ∼50 days are examined, with the cone of influence identified and removed as in the dust wavelet analysis. The unit vector magnetic field can be positive (pointing toward the Sun) or negative (pointing away from the Sun). Therefore, this wavelet analysis examines the periodicity of the solar wind magnetic polarity at 1 AU.
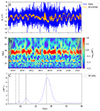 |
Fig. 5. Analysis of periodicity in the solar wind magnetic field polarity near 1 AU. The format is the same as in Fig. 2 except that vector component Bx is shown in (a), while the wavelet analysis in (b) and (c) is applied to only the signed unit vector (Bx/|Bx|). |
The radial magnetic field polarity is important to the dust analysis because it carries information about the azimuthal orientation of the magnetic field at large (> 5 AU) radial distances from the Sun. Beyond the orbit of Jupiter, the Parker spiral (Parker 1958) is tightly wrapped, such that the angle between the solar wind magnetic field and the radially outward solar wind velocity approaches 90 degrees (Burlaga et al. 2002). Therefore, the radial component of the interplanetary magnetic field at 1 AU is representative of the solar wind magnetic polarity (clockwise or counterclockwise with respect to the solar rotation axis direction) at large radial distances from the Sun.
Figure 5c shows the mean of the wavelet power over the full time interval. As in the prior plots, vertical dashed gray lines are placed at periodicities of 27 days, 27/2 = 13.5 days, 27/3 = 9 days, and 27/4 = 6.75 days. Distinct peaks are present near 27 days, as well as near the 13.5 and 9 day harmonics.
Figure 6 shows a wavelet analysis of the solar wind speed (|Vsw|) OMNI data between 1 January 2007 and 1 January 2023. Again, the same wavelet analysis is applied. Figure 6a shows the daily (blue) and 61-day median smoothed (orange) time-series data. Figure 6b shows the wavelet power spectrum of these data, and Fig. 6c shows the time-averaged power as a function of period. There is a clear peak in |Vsw| near 27 days, and distinct harmonics at 13.5, 9, and 6.75 days.
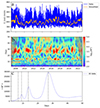 |
Fig. 6. Analysis of periodicity in the solar wind speed near 1 AU. The format is the same as in Fig. 2. |
The above analysis demonstrates that both the magnetic polarity and the solar wind velocity at 1 AU have strong periodicities near the solar rotation period and several harmonics. These periodicities are transmitted throughout the Solar System as the solar wind expands radially away from the Sun, driving periodic variability of the Lorentz force experienced by dust grains in the solar wind flow. Variations in the Lorentz force on timescales close to the solar rotation period act on ISD passing through the Solar System. This may potentially explain the periodicity in dust impact detection near the solar rotation period reported in Sect. 4.
As an initial test of this idea, the next section describes a toy model that calculates the trajectories of ISD under the influence of a solar wind with properties that vary with the solar rotation period. The model focuses on the trajectories of ISD because the analysis in Sect. 4 indicates that the modulation of dust flux near the solar rotation period is strongest when the STEREO spacecraft are moving against the ISD flow direction.
In their analysis of a solar rotation periodicity identified in Wind spacecraft dust impact data, Baalmann et al. (2024) conclude that the majority of the solar rotation periodicity signal is due to ISD, with a potential minor contribution from IDP. Based on these considerations, only ISD dynamics are considered in the toy model. Analysis of IDP interactions with the solar wind is beyond the scope of this paper.
5. Toy model
5.1. Toy model description
A two-dimensional toy model is used to evaluate whether it is feasible to expect variability in the solar wind at solar rotation periodicity to effect ISD propagation through the heliosphere. More elaborate models and simulations should be carried out in the future to test the conclusions reached here with more realistic solar wind structure and/or extend these results to interplanetary dust populations.
The model traces the motion of test particles (representing ISD grains) through a solar wind that has properties that vary in time and space. Test particles are introduced near the ecliptic plane, ∼100 AU from the Sun, with an initial sunward velocity. The solar wind originates near the solar surface and moves radially away from the Sun. The solar wind speed and solar wind magnetic field polarity are configured to vary at the solar rotation period.
This model updates the position of, and force acting on, each test particle (dust grain) as a function of time, following Newton’s laws of motion. The acceleration of a test particle at any time (t) and position (r) is determined only by the Lorentz force: FL(r, t) = q(Es(r, t)+vnet(r, t)×B(r, t)). Here, Es refers to the global solar electric field in the frame of the Sun and vnet = vsw − vdust is the net velocity of the flowing plasma in the frame of the dust grain at a given time.
In the model, vsw and vdust are oppositely directed. No forces acting toward or away from the Sun (e.g., radiation pressure and gravity) are modeled, so the radial component of vdust remains constant. This is equivalent to assuming that radiation pressure and gravitational forces acting on the dust grain are exactly equal and opposite at all times. Furthermore, the large-scale global solar wind electric field is negligibly small with respect to its ability to modify dust grain motion (< 1 nV/m at 0.25 AU and rapidly decreasing with radial distance; Berčič et al. 2021). Therefore, the model assumes Es(rt) = 0. Changes in dust grain trajectories therefore occur due to the vnet × B term only.
This toy model is most applicable to the motion of dust grains in the outer heliosphere (> 5 AU). At these distances, near the ecliptic plane, the solar wind magnetic field Parker spiral is fully wrapped, such that the magnetic field vector is nearly perpendicular to the radially outward solar wind velocity, and in the ecliptic plane (Burlaga et al. 2002). Considering a radial, tangential, and normal (RTN) coordinate system centered on a dust grain,  is along
  , the initial
  is along
  ,
,  is along the tangential direction (
 ), and the resulting dust grain motion due to the Lorentz force vnet × B term is in the normal (
 ) direction relative to the solar rotation plane. This is consistent with prior, more complex, modeling work (e.g., Landgraf 2000; Czechowski & Mann 2003; Sterken et al. 2012). Given the model assumptions, dust grain motion is almost entirely in the
  and
and  plane, so a two-dimensional model in this plane is a reasonable approximation for the current application.
A single, fixed, charge-to-mass (q/m) ratio of 0.5 is chosen for the dust grains, based on prior modeling work demonstrating that grains with this q/m ratio are strongly affected by Lorentz force interactions within the Solar System (Sterken et al. 2012). This q/m corresponds to a dust grain with a radius ∼0.3 μm and a mass of approximately 4 × 10⁻¹⁶ kg. The initial velocity of the dust (vdust) is assumed to be 26 km s−1 toward the Sun, consistent with the flow of ISD grains moving through the Solar System (Witte 2004; McComas et al. 2015).
The magnitude of solar wind magnetic field strength at any radial distance from the Sun (d) is modeled using the Parker model equation as stated in (Burlaga et al. 2002):
![Mathematical equation: $$ \begin{aligned} |B (d, \theta )| =\frac{ B_{r,\mathrm {1AU}}}{d^2}\left[1+\left[\frac{419.5 \ d \ \cos (\theta )}{v_{\rm sw}(d)}\right]^2\right]^{\frac{1}{2}} .\end{aligned} $$](/articles/aa/full_html/2024/12/aa51950-24/aa51950-24-eq12.gif) (2)
(2)
Here, Br,1AU is the radial magnetic field strength at 1 AU (in units of Tesla), d is radial distance from the Sun (in units of AU), vsw has units of km/s, and θ is the Parker spiral angle relative to the direction radially away from the Sun at a distance d.
The test particle model explored here has two possible solar wind velocity states: fast (600 km/s) and slow (350 km/s; Larrodera & Cid 2020). Parcels of fast solar wind are released from the Sun over a duration of 3 days, with leading edges that begin every 26 days. These parcels of fast solar wind are then propagated away from the Sun at 600 km/s. All other solar wind is assumed to be slow solar wind. In this way, only the fast solar wind parcels propagate through the plasma. Interactions between fast and slow solar wind are not modeled. At any given time, the dust grain (test particle) may be within a fast solar wind parcel or else in the slow solar wind. Within a fast solar wind parcel, the local magnetic field strength is defined using Eq. (2), with Br,1AU = 10 nT. In the slow solar wind, the local magnetic field strength is defined using Eq. (2), with Br,1AU = 3 nT. This portion of the model is intended to provide a simplified representation of fast solar wind streams (Gosling & Pizzo 1999).
The model also periodically varies the direction of the magnetic field vector at the location of the dust grain, by alternating the sign of B between +T and −T. In this model, B is constrained to exist only in the  direction. The sign of B at the location of the dust grain is switched every 13 days. Because the
  velocity of the dust grains is fixed in this model, regions of alternating magnetic fields are static with respect to the Sun, with one ± boundary fixed at 100 AU. The test particle model only treats dust grains close to the solar rotation plane. Therefore, the magnetic field magnitude and direction are considered to be homogeneous for all deflection locations away from the solar rotation plane at a given radial distance. This portion of the model is intended to provide a simplified representation of the alternating magnetic sector structure caused by the HCS and the rotation of the Sun. It is understood that the real HCS only shows such an organized structure near solar minima, but this toy model assumes that a regularly alternating sector structure is always present.
In this model, dust grains encounter outward propagating fast solar wind regions for ∼3 days out of every ∼26 days. This causes the solar wind speed and magnetic field magnitude experienced by the dust to vary with ∼26 days periodicity. Also, the sign of the solar wind magnetic field experienced by the dust flips every 13 days. Therefore, the phasing between the magnetic and velocity value oscillations varies with dust location and time.
Because the goal of the model is to investigate dust flux modulation near 1 AU, the model must track the number of dust grains with trajectories that can be detected at 1 AU. To accomplish this, a “detection region” near 1 AU is defined. The detection region is a box extending −0.6 AU to +0.6 AU in  and from 1 AU to 1.5 AU in
  . The size of this detection region is much larger than the few square meters detection area of the STEREO spacecraft. However, it was determined that the periodicities detected in the model results are insensitive changes in the size of the region, except that fewer counts are detected when a smaller region is used. The selected box size is therefore determined by competing requirements to (i) track a small enough number of particles that available computational resources are not exceeded, and (ii) ensure that a statistically meaningful number of dust grains reach the detection region.
The next section describes the results of the toy model and discusses the physical implications of those results in the context of the STEREO observations.
5.2. Toy model results
The toy model described above is used to track the trajectories of ∼15 000 test particles (representing ISD grains) encountering the described solar wind and magnetic field conditions. The number of test particles arriving at the detection region is recorded as a function of time, and those data are analyzed for periodicities using a wavelet analysis similar to that used in Sect. 4.
The model was initialized with 4992 test particles (dust grains) at each of three latitude values, 0.0138, 0.0047 and −0.0138 degrees, relative to the  line. When the model is run with larger initial particle latitudes, fewer test particles consistently intersect the detection region. To minimize computational resources but also obtain a sufficient number of counts in the detection region for wavelet analysis, only small initial latitudes (≫1 degree) are used. Various distributions of particle initial positions with latitude were tested, including randomly assigned latitudes, and a continuous distribution of particles in latitude. However, the form of the latitude distribution (for the small range of latitudes considered) was found to have little impact on the periodicities identified in the results.
For each latitude, the 4992 test particles are initialized along the R direction at distances of 100 + M × 6.25 × 10⁻⁴ AU, where the particles are numbered from M = 0 to M = 4991. These initial separations correspond to 1 hour dust travel time (93 600 km spatial separation). The total number of particles and their spacing in time was chosen to ensure that a sufficient number of particles reach the detection region for wavelet analysis. Various distributions of particle initial spacing were tested, including a random distribution, but again, this had little impact on the periodicity of particles reaching the detection region.
From their initial locations, the test particles are allowed to propagate sunward. They experience variable Lorentz forces due to the periodic variations imposed on the solar wind flow velocity and magnetic field direction. These forces cause deflection of the particles in the  direction. The magnetic field magnitude increases as the particles moves sunward following Eq. (2), which causes the magnitude of the Lorentz force-driven deflections to increase closer to the Sun.
Figure 7 shows a wavelet analysis of the particles reaching the detection region in a similar format to figures in Sect. 4. Figure 7a shows the number of test particles reaching the detection region per day. Figure 7b shows a wavelet spectrogram of the arrived particle data. A complex Morlet wavelet was used in this analysis (similar to Sect. 4), but with normalized bandwidth B = 1.0 and normalized center frequency C = 1.0. Figure 7c shows the wavelet power averaged across all data. Peaks are present near 27 days and harmonics (13.5 days, 9 days).
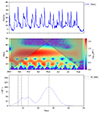 |
Fig. 7. Analysis of periodicities in the arrival of ISD grains near 1 AU. (a) Counts of dust arrival per day in the detection region near 1 AU. (b) Wavelet spectrogram of the daily dust count data from (a), with cone of influence regions indicated in transparent gray. (c) Wavelet power spectral values averaged over the entire simulation time, as a function of oscillation period. Vertical dashed gray lines are at periodicities corresponding to the approximate solar rotation period of 27 days and its harmonics: 27/2 = 13.5 days, 27/3 = 9 days, and 27/4 = 6.75 days. |
5.3. Toy model interpretation
To improve physical interpretation of the toy model results, aspects of the model were enabled or disabled, and the results analyzed. Figure 8 examines the consequences of enabling or disabling the periodic magnetic field polarization switching, and enabling or disabling the periodic fast solar wind parcels.
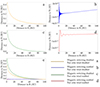 |
Fig. 8. Test particle trajectories as toy model parameters are enabled or disabled. (a) Both magnetic field switching and fast solar wind disabled. (b) Magnetic field switching enabled, fast solar wind disabled. (c) Magnetic field switching disabled, fast solar wind enabled. (d) Both magnetic field switching and fast solar wind enabled. |
Figure 8a (yellow curve) shows a test particle trajectory when both magnetic switching and fast solar wind parcels are disabled. In this case, the particle is continuously deflected in  , consistent with a single polarization of the magnetic field.
Figure 8b (blue curve) shows a test particle trajectory when magnetic switching is enabled and fast solar wind parcels are disabled. In this case, the particle deflection oscillates in  , changing direction each time the sign of the magnetic field switches. The particle shows a net deflection from N = 0, but the deflection is small relative to the other test cases. The particle deflection reversals are numerous and increase in magnitude as the particle travels into regions of higher magnetic field strength closer to the Sun.
Figure 8c (green curve) shows a test particle trajectory when magnetic switching is disabled and fast solar wind parcels are enabled. In this case, the particle deflects in a similar way to Fig. 8a, but the magnitude of the deflection is enhanced. This occurs because the fast solar wind parcels increase the magnitude of the integrated Lorentz force acceleration (larger vsw, larger Br,1AU).
Figure 8d (red curve) shows a test particle trajectory with both magnetic switching and fast solar wind parcels enabled. In this case, the particle shows a small number of oscillations about N = 0 as it travels toward the Sun. The oscillations increase in magnitude as the particle travels into regions of higher magnetic field strength closer to the Sun. Figure 8e shows all plots on the same axis for comparison.
These model experiments show that: (i) without a variable magnetic field direction, test particles that begin near N = 0 will be deflected far from N = 0 and are unlikely to encounter Earth, (ii) the presence of fast solar wind streams increases the magnitude of any given test particle deflection, because the dust particle periodically encounters enhanced solar wind flow velocity and enhanced magnetic field strength, (iii) when both solar wind magnetic field and solar wind flow velocity vary periodically, the combined motion results in a small number (< 10) of N = 0 crossings during the 100 AU traversed.
The toy model presented here demonstrates that: (i) typical order-of-magnitude variations in solar wind magnetic field strength and flow velocity associated with solar rotation (due to the HCS and fast solar wind streams) can have sufficient strength to alter the trajectories of a representative ISD particle such that they may or may not intersect a target near Earth in a periodic manner. (ii) periodic changes in magnetic field directionality are significantly more important than periodic changes in solar wind velocity or periodic changes in magnetic field strength for imposing a periodicity onto ISD that reach 1 AU, and (iii) only ISD originating from a narrow range of starting latitudes are deflected significantly enough to produce periodicity near 1 AU.
6. Discussion
In this study, dust observations made by the STEREO spacecraft at 1 AU were analyzed. Dust detections were found to be modulated at a period comparable to the solar rotation period on both STEREO A and STEREO B. This observation strongly supports a recent similar observation made using the Wind spacecraft (Baalmann et al. 2024).
In the STEREO data, dust periodicities near the solar rotation rate were found to be stronger at times when the spacecraft are moving against the ISD flow direction and during the solar global magnetic field polarity that leads to focusing of ISD grains toward the ecliptic (focusing period).
One important consideration for these data is that the detection of dust impacts using electric field antennas is velocity-dependent. The amount of charge produced during a hypervelocity impact depends strongly on the impact velocity (e.g., McBride & McDonnell 1999; Collette et al. 2014), and the amount of charge produced determines the voltage impulse signal amplitude (e.g., Shen et al. 2021). Because the voltage thresholds used for detection are fixed, the detectability of dust impacts varies with impactor velocity.
ISD flow through the Solar System is directional, with a flow that is approximately spatially uniform on the scale size of 1 AU, originating from a direction within 8° of the ecliptic plane (Landgraf & Grün 1998). Therefore, when the azimuthal velocity of either STEREO spacecraft about the Sun is parallel to the ISD flow, the relative impact velocity for ISD grains will be lower, and dust detectability will change: a slower dust grain must be much more massive to produce the same impact charge as a fast dust grain. Because the mass distribution of ISD grains is such that there are more low-mass grains than high-mass grains (Sterken et al. 2019), fewer ISD grains will be detected when the spacecraft orbital motion is with to the ISD flow. Conversely, when the STEREO azimuthal velocity about the Sun is against to the ISD flow, ISD detectability will be enhanced.
The impact of detection velocity modulation on the identified dust flux periodicities near the solar rotation period is discussed in detail in Baalmann et al. (2024) in the context of the Wind spacecraft. Using a Fourier-based analysis, Baalmann et al. (2024) observe a weak spectral peak near the solar rotation period during times when there is little detectable ISD (spacecraft moving with the ISD flow direction and during the defocusing phase), indicating that IDPs may also be affected by solar rotation. The wavelet analysis used here does not have sufficiently narrow frequency resolution to distinguish a spectral peak when the spacecraft are moving with the ISD flow direction or during the defocusing phase.
During the focusing interval, STEREO A and STEREO B both observe wavelet power peaks near the solar rotation period (∼27 days) that have similar amplitudes. However, there are some differences between the STEREO A and STEREO B observations.
First, the STEREO A and STEREO B dust modulation spectral signatures peak at slightly different periods. The STEREO A dust modulation signal peaks at ∼26 days (Fig. 2), while the STEREO B signal peaks at ∼28 days (Fig. 4). By comparison, Wind observes a dust modulation signal at ∼27 days (Baalmann et al. 2024), the time period of a Carrington rotation as viewed from Earth. These differences do not appear to be consistent with differences in the synodic rotation rate of the Sun as viewed by STEREO A, Wind, and STEREO B. STEREO A (B) travels slightly faster (slower) than Earth about the Sun, so the solar synodic rotation period as viewed from STEREO A (B) should be longer (shorter) than the solar synodic rotation period as viewed from Earth. This is opposite to the direction of the observed periodicity shift. Therefore, the physical origin of these frequency shifts is not clear at this time.
Second, the wavelet power peaks on STEREO B (Fig. 4c) show distinct minor peaks at harmonics of the solar rotation rate (near 13.5 days, 9 days). The wavelet power peaks from STEREO A (Fig. 2c) show some peaks near these frequencies, but they are not as distinct on STEREO B. Baalmann et al. (2024) also report dust flux periodicity at 13.5 days and 9 days. STEREO A and STEREO B are nearly identical mechanically, so there should be negligible differences in dust detection collection area. There are documented differences in the flux of single versus triple hit observations on each spacecraft (Malaspina et al. 2015), but it is unclear how these differences could influence the harmonic spectral peaks.
This study used a two-dimensional toy model to evaluate whether solar-rotation variability in solar wind magnetic field and flow velocity are capable of altering ISD trajectories within the heliosphere significantly enough to produce ISD modulation at 1 AU at the solar rotation period.
The toy model uses many simplifying assumptions, and therefore has strong limitations. The model does not consider forces due to solar radiation pressure or gravity. It only examines particles that enter the heliosphere at low latitudes relative to the solar rotation plane. The true ISD entrance angle with respect to the solar rotation plane was not modeled (though this angle is likely only a few degrees; Landgraf & Grün 1998; Giles 1999). The model only considers dust grains of a single charge-to-mass ratio and a single β value. It assumes homogeneous spacing of fast solar wind streams and magnetic polarity reversals, which is only true on average during solar minimum. The model allows regions of enhanced solar wind speed to travel independently of the magnetic field polarization, which is not physical. Instead, any given parcel of solar wind should retain its magnetic polarity as it travels away from the Sun. Only two fixed solar wind velocities were considered. The entrance of dust grains into the heliosphere is not modeled. Dust grains are constrained to move in a two-dimensional plane, and no variation of the dust velocity in the third dimension is modeled.
Furthermore, at ∼26 km/s, the time for ISD to travel from 100 AU to 1 AU is ∼18 years. This is longer than the ∼11 years between solar global magnetic polarity flips. The model does not include the 11-year polarity flip. However, the impact of the 11-year polarity flip was investigated using the model.
When the model was augmented to include a global polarity flip after 11 years, it made a negligible difference in the arrival of ISD at 1 AU in most circumstances. This is because the majority of the ISD deflection from the solar rotation plane occurs in the inner heliosphere (< 10 AU), where the magnetic field strength (and therefore the Lorentz force) becomes large. If the dust encounters a global magnetic polarity flip outside of ∼10 AU, the trajectory experiences a minor disruption, but retains a similar probability of encountering the detection region as in the circumstance where no 11-year polarity flip is included. If the dust encounters the global magnetic polarity flip inside of ∼10 AU, the disruption to the trajectory can increase the probability of the dust “missing” the detection region at 1 AU. Given that ISD requires ∼1.6 years to travel ∼9 AU, the time interval of enhanced disruption to dust trajectories is small relative to the total dust travel time of ∼18 years; therefore, only a small portion of the ISD detected by STEREO is expected be strongly influenced by the 11-year global magnetic polarity change.
Despite this long list of simplifications, the toy model results suggest that Lorentz force interactions between charged ISD grains and the solar-rotation-induced variability of the solar wind can result in a modulation of ISD fluxes near Earth near the solar rotation period. Detailed simulations with fewer simplifications should be carried out in the future to test this result more robustly.
7. Conclusion
This study has identified a modulation of dust detection by the STEREO spacecraft at 1 AU with a period comparable to the solar rotation period. This modulation agrees with the identification of a similar modulation using Wind spacecraft data, as reported by Baalmann et al. (2024). The independent detection of this phenomenon on multiple spacecraft (Wind, STEREO-A, and STEREO-B) strongly supports the conclusion that this is a physical effect and not an artifact of spacecraft data processing.
The analysis of STEREO data presented here shows that the observed dust modulation near the solar rotation period is strongest when STEREO is moving against the ISD flow direction and during the ISD focusing phase. This suggests that the trajectories of ISD grains are strongly influenced by the variability of solar wind properties at the solar rotation rate.
The toy model presented here suggests that the periodic variability of solar wind properties near the solar rotation rate is capable of producing ISD flux modulation at 1 AU with similar periodicities. Variability in the Lorentz force due to changes in the direction of the interplanetary magnetic field are identified as a critical factor shaping ISD trajectories, consistent with the conclusions of prior studies (Morfill & Grün 1979; Gruen et al. 1994; Landgraf 2000; Sterken et al. 2012).
Further study is required to explore the mechanisms by which interplanetary dust detection is modulated by solar rotation periodicities.
Acknowledgments
SC and DM acknowledge support from STEM Routes Uplift program (Packard Foundation 2021-72553), the Undergraduate Research Opportunities Program (UROP) at the University of Colorado Boulder, NASA grant #80NSSC23K0286, and NASA grant #80NSSC22K0753. VJS, LRB, and SH received funding from the European Union’s Horizon 2020 research and innovation programme under grant agreement N° 851544 – ASTRODUST. We acknowledge use of NASA/GSFC’s Space Physics Data Facility’s OMNIWeb service, and OMNI data.
References
- Baalmann, L., Hunziker, S., Péronne, A., et al. 2024, Astron. Astrophys. J. [Google Scholar]
- Bale, S. D., Kasper, J. C., Howes, G. G., et al. 2009, Phys. Rev. Lett., 103, 211101 [NASA ADS] [CrossRef] [Google Scholar]
- Berčič, L., Maksimović, M., Halekas, J. S., et al. 2021, ApJ, 921, 83 [CrossRef] [Google Scholar]
- Bougeret, J. L., Goetz, K., Kaiser, M. L., et al. 2008, Space Sci. Rev., 136, 487 [CrossRef] [Google Scholar]
- Briand, C. 2015, J. Plasma Phys., 81, 325810204 [CrossRef] [Google Scholar]
- Burlaga, L. F., Ness, N. F., Wang, Y. M., & Sheeley, N. R. 2002, J. Geophys. Res. (Space Phys.), 107, 1410 [NASA ADS] [Google Scholar]
- Collette, A., Grün, E., Malaspina, D., & Sternovsky, Z. 2014, J. Geophys. Res. (Space Phys.), 119, 6019 [NASA ADS] [CrossRef] [Google Scholar]
- Czechowski, A., & Mann, I. 2003, J. Geophys. Res. (Space Phys.), 108, 8038 [NASA ADS] [CrossRef] [Google Scholar]
- Garrett, H. B. 1981, Rev. Geophys. Space Phys., 19, 577 [CrossRef] [Google Scholar]
- Giles, P. M. 1999, Ph.D. Thesis, Stanford University [Google Scholar]
- Gosling, J. T., & Pizzo, V. J. 1999, Space Sci. Rev., 89, 21 [NASA ADS] [CrossRef] [Google Scholar]
- Gruen, E., Gustafson, B., Mann, I., et al. 1994, A&A, 286, 915 [NASA ADS] [Google Scholar]
- Grün, E., Zook, H. A., Baguhl, M., et al. 1993, Nature, 362, 428 [Google Scholar]
- Hamilton, D. P., Grün, E., & Baguhl, M. 1996, ASP Conf. Ser., 104, 31 [NASA ADS] [Google Scholar]
- Hervig, M. E., Malaspina, D., Sterken, V., et al. 2022, J. Geophys. Res. (Space Phys.), 127, e2022JA030749 [NASA ADS] [CrossRef] [Google Scholar]
- Imada, S., Matoba, K., Fujiyama, M., & Iijima, H. 2020, Earth Planets Space, 72, 182 [NASA ADS] [CrossRef] [Google Scholar]
- Kaiser, M. L., Kucera, T. A., Davila, J. M., et al. 2008, Space Sci. Rev., 136, 5 [Google Scholar]
- Kellogg, P. J., Goetz, K., & Monson, S. J. 2016, J. Geophys. Res. (Space Phys.), 121, 966 [NASA ADS] [CrossRef] [Google Scholar]
- Koschny, D., Soja, R. H., Engrand, C., et al. 2019, Space Sci. Rev., 215, 34 [NASA ADS] [CrossRef] [Google Scholar]
- Krieger, A. S., Timothy, A. F., & Roelof, E. C. 1973, Sol. Phys., 29, 505 [NASA ADS] [CrossRef] [Google Scholar]
- Landgraf, M. 2000, J. Geophys. Res., 105, 10303 [NASA ADS] [CrossRef] [Google Scholar]
- Landgraf, M., & Grün, E. 1998, IAU Colloq., 506, 381 [NASA ADS] [Google Scholar]
- Landgraf, M., Liou, J. C., Zook, H. A., & Grün, E. 2002, ApJ, 123, 2857 [CrossRef] [Google Scholar]
- Larrodera, C., & Cid, C. 2020, A&A, 635, A44 [NASA ADS] [CrossRef] [EDP Sciences] [Google Scholar]
- Leamon, R. J., McIntosh, S. W., & Title, A. M. 2022, Front. Astron. Space Sci., 9, 886670 [NASA ADS] [CrossRef] [Google Scholar]
- Malaspina, D. M., & Wilson, L. B. 2016, J. Geophys. Res. (Space Phys.), 121, 9369 [NASA ADS] [CrossRef] [Google Scholar]
- Malaspina, D. M., Andersson, L., Ergun, R. E., et al. 2014, Geophys. Res. Lett., 41, 5693 [NASA ADS] [CrossRef] [Google Scholar]
- Malaspina, D. M., Wygant, J. R., Ergun, R. E., et al. 2015, J. Geophys. Res. (Space Phys.), 120, 4246 [NASA ADS] [CrossRef] [Google Scholar]
- McBride, N., McDonnell, J. A. M., 1999, Planet. Space Sci., 47, 1005 [Google Scholar]
- McComas, D. J., Bzowski, M., Frisch, P., et al. 2015, ApJ, 801, 28 [NASA ADS] [CrossRef] [Google Scholar]
- Meyer-Vernet, N., Maksimovic, M., Czechowski, A., et al. 2009, Sol. Phys., 256, 463 [NASA ADS] [CrossRef] [Google Scholar]
- Morfill, G. E., & Grün, E. 1979, Planet. Space Sci., 27, 1283 [NASA ADS] [CrossRef] [Google Scholar]
- Papitashvili, N., & King, J. 2020, OMNI Hourly Data, NASA SpacePhysics Data Facility, https://doi.org/10.48322/1shr-ht18, accessed: 2024-06-30 [Google Scholar]
- Parker, E. N. 1958, ApJ, 128, 664 [Google Scholar]
- Pusack, A., Malaspina, D. M., Szalay, J. R., et al. 2021, Planet. Sci. J., 2, 186 [CrossRef] [Google Scholar]
- Shen, M. M., Sternovsky, Z., Garzelli, A., & Malaspina, D. M. 2021, J. Geophys. Res. (Space Phys.), 126, e29645 [NASA ADS] [Google Scholar]
- Shen, C., Ren, N., Qureshi, M. N. S., & Guo, Y. 2022, J. Geophys. Res. (Space Phys.), 127, e2022JA030782 [NASA ADS] [CrossRef] [Google Scholar]
- Smith, E. J. 2001, J. Geophys. Res., 106, 15819 [NASA ADS] [CrossRef] [Google Scholar]
- Sterken, V. J., Altobelli, N., Kempf, S., et al. 2012, A&A, 538, A102 [NASA ADS] [CrossRef] [EDP Sciences] [Google Scholar]
- Sterken, V. J., Strub, P., Krüger, H., von Steiger, R., & Frisch, P. 2015, ApJ, 812, 141 [NASA ADS] [CrossRef] [Google Scholar]
- Sterken, V. J., Westphal, A. J., Altobelli, N., Malaspina, D., & Postberg, F. 2019, Space Sci. Rev., 215, 43 [NASA ADS] [CrossRef] [Google Scholar]
- Strub, P., Sterken, V. J., Soja, R., et al. 2019, A&A, 621, A54 [NASA ADS] [CrossRef] [EDP Sciences] [Google Scholar]
- Tong, Y., Vasko, I. Y., Artemyev, A. V., Bale, S. D., & Mozer, F. S. 2019, ApJ, 878, 41 [Google Scholar]
- Witte, M. 2004, A&A, 426, 835 [NASA ADS] [CrossRef] [EDP Sciences] [Google Scholar]
- Wood, S. R., Malaspina, D. M., Andersson, L., & Horanyi, M. 2015, J. Geophys. Res. (Space Phys.), 120, 7121 [NASA ADS] [CrossRef] [Google Scholar]
- Zaslavsky, A., Meyer-Vernet, N., Mann, I., et al. 2012, J. Geophys. Res. (Space Phys.), 117, A05102 [Google Scholar]
All Figures
|
Fig. 1. Dust count rates as a function of time on the STEREO spacecraft. (a) Dust counts per day (blue) on STEREO A, and dust counts per day smoothed using a 61-day median running window (orange). (b) Same as (a), but for STEREO B. (c) Sun spot number per day as a function of time (blue), and sunspot data smoothed using a 61-day median running window (orange). |
| In the text | |
|
Fig. 2. STEREO A observations of dust and its periodicity during an ISD focusing interval. (a) Daily dust count rate (blue) and median-smoothed count rate data (orange). (b) Indications of when STEREO A is moving in (red) or against (green) the interstellar flow direction. (c) Wavelet spectrogram of the daily dust count data from (a). (d) Wavelet power spectral values averaged over time, as a function of oscillation period. The three lines indicate averages over different time intervals: when STEREO A moves against the ISD flow (solid green), when it moves with the ISD flow (dashed red), and all time during the STEREO A focusing interval (dotted blue). |
| In the text | |
|
Fig. 3. STEREO A observations of dust and its periodicity during an ISD defocusing interval. The format is the same as in Fig. 2. |
| In the text | |
|
Fig. 4. STEREO B observations of dust and its periodicity during an ISD focusing interval. The format is the same as in Fig. 2. |
| In the text | |
|
Fig. 5. Analysis of periodicity in the solar wind magnetic field polarity near 1 AU. The format is the same as in Fig. 2 except that vector component Bx is shown in (a), while the wavelet analysis in (b) and (c) is applied to only the signed unit vector (Bx/|Bx|). |
| In the text | |
|
Fig. 6. Analysis of periodicity in the solar wind speed near 1 AU. The format is the same as in Fig. 2. |
| In the text | |
|
Fig. 7. Analysis of periodicities in the arrival of ISD grains near 1 AU. (a) Counts of dust arrival per day in the detection region near 1 AU. (b) Wavelet spectrogram of the daily dust count data from (a), with cone of influence regions indicated in transparent gray. (c) Wavelet power spectral values averaged over the entire simulation time, as a function of oscillation period. Vertical dashed gray lines are at periodicities corresponding to the approximate solar rotation period of 27 days and its harmonics: 27/2 = 13.5 days, 27/3 = 9 days, and 27/4 = 6.75 days. |
| In the text | |
|
Fig. 8. Test particle trajectories as toy model parameters are enabled or disabled. (a) Both magnetic field switching and fast solar wind disabled. (b) Magnetic field switching enabled, fast solar wind disabled. (c) Magnetic field switching disabled, fast solar wind enabled. (d) Both magnetic field switching and fast solar wind enabled. |
| In the text | |
Current usage metrics show cumulative count of Article Views (full-text article views including HTML views, PDF and ePub downloads, according to the available data) and Abstracts Views on Vision4Press platform.
Data correspond to usage on the plateform after 2015. The current usage metrics is available 48-96 hours after online publication and is updated daily on week days.
Initial download of the metrics may take a while.