Fig. 7.
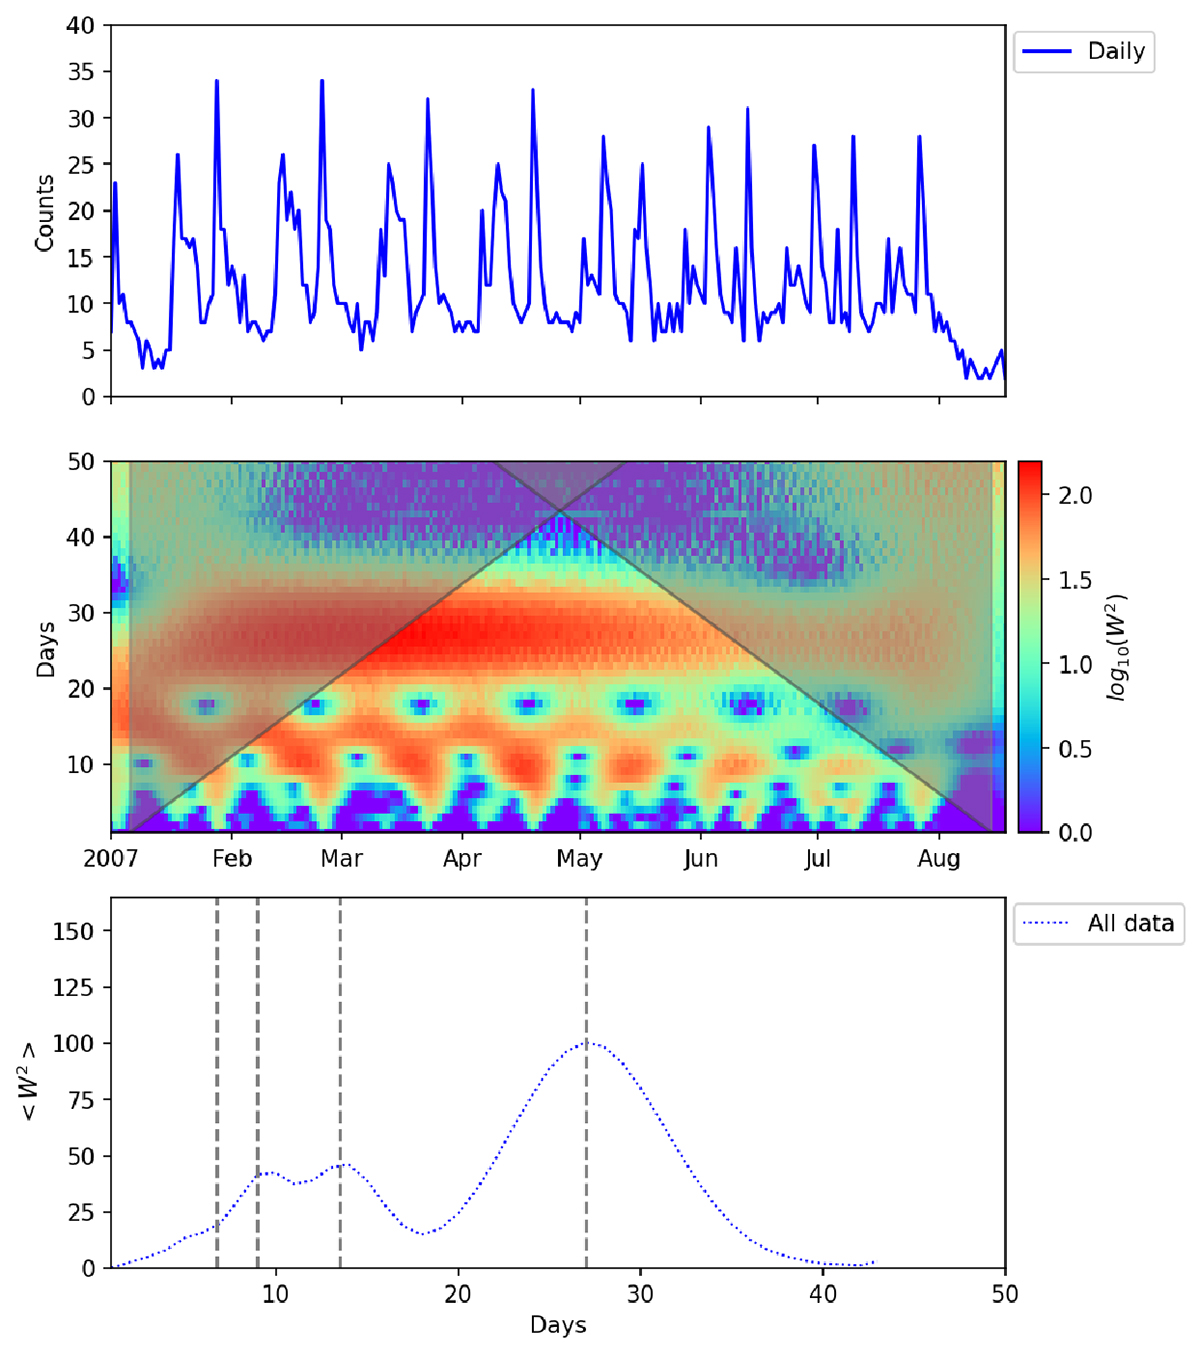
Download original image
Analysis of periodicities in the arrival of ISD grains near 1 AU. (a) Counts of dust arrival per day in the detection region near 1 AU. (b) Wavelet spectrogram of the daily dust count data from (a), with cone of influence regions indicated in transparent gray. (c) Wavelet power spectral values averaged over the entire simulation time, as a function of oscillation period. Vertical dashed gray lines are at periodicities corresponding to the approximate solar rotation period of 27 days and its harmonics: 27/2 = 13.5 days, 27/3 = 9 days, and 27/4 = 6.75 days.
Current usage metrics show cumulative count of Article Views (full-text article views including HTML views, PDF and ePub downloads, according to the available data) and Abstracts Views on Vision4Press platform.
Data correspond to usage on the plateform after 2015. The current usage metrics is available 48-96 hours after online publication and is updated daily on week days.
Initial download of the metrics may take a while.