Fig. 2.
Download original image
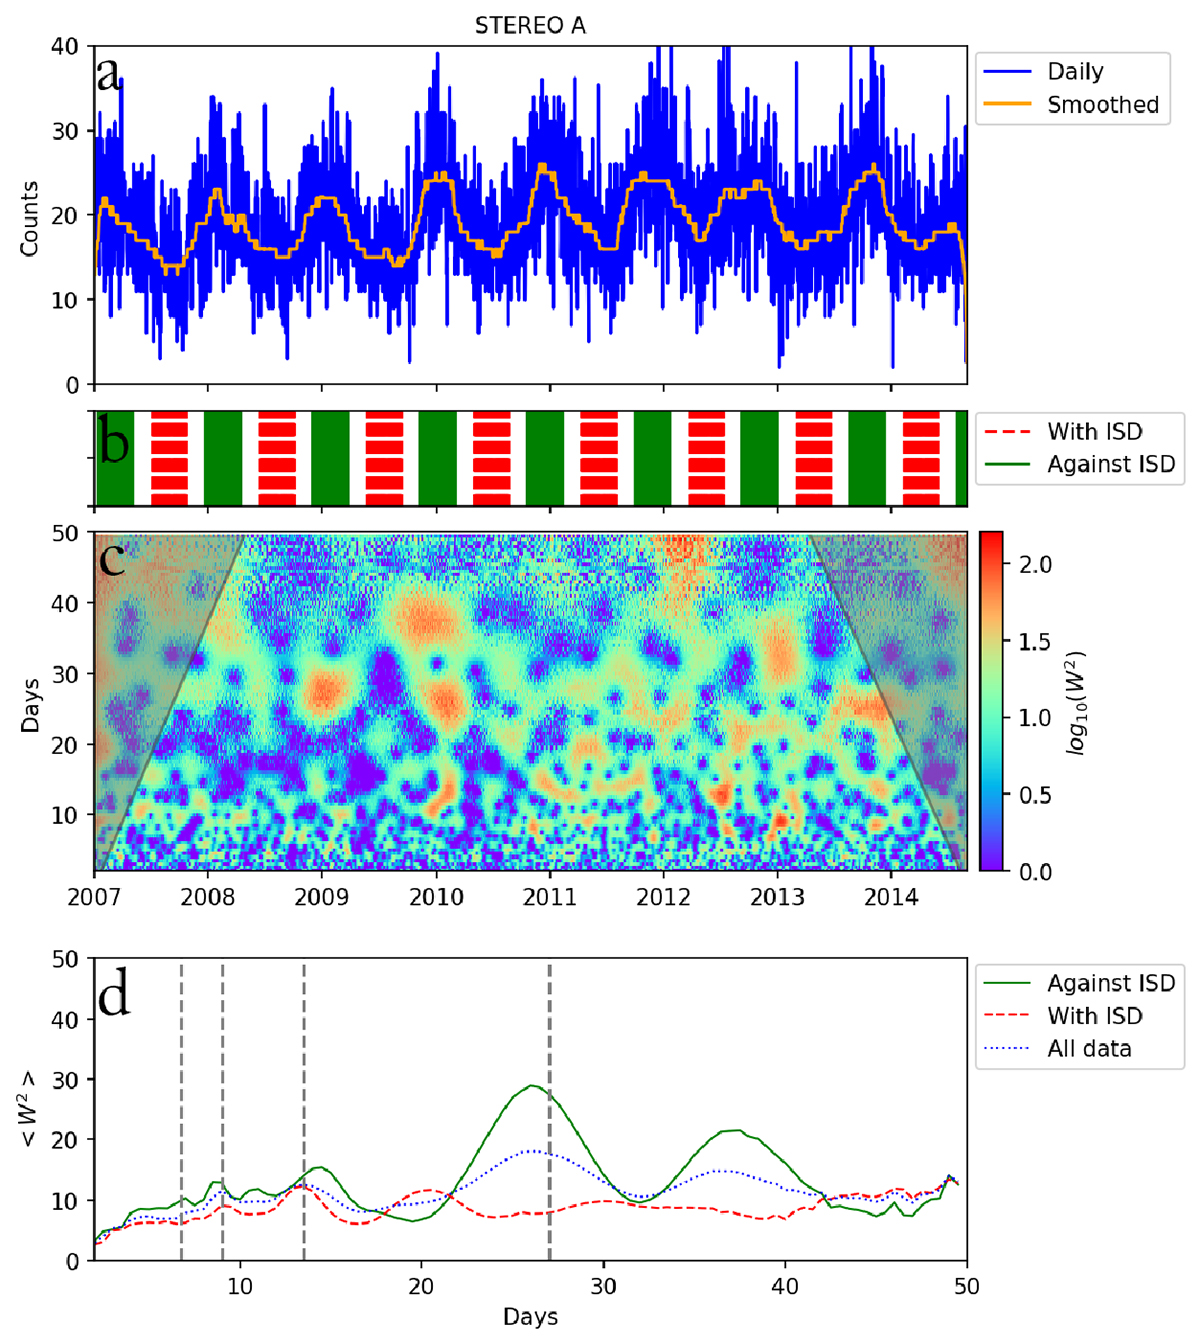
STEREO A observations of dust and its periodicity during an ISD focusing interval. (a) Daily dust count rate (blue) and median-smoothed count rate data (orange). (b) Indications of when STEREO A is moving in (red) or against (green) the interstellar flow direction. (c) Wavelet spectrogram of the daily dust count data from (a). (d) Wavelet power spectral values averaged over time, as a function of oscillation period. The three lines indicate averages over different time intervals: when STEREO A moves against the ISD flow (solid green), when it moves with the ISD flow (dashed red), and all time during the STEREO A focusing interval (dotted blue).
Current usage metrics show cumulative count of Article Views (full-text article views including HTML views, PDF and ePub downloads, according to the available data) and Abstracts Views on Vision4Press platform.
Data correspond to usage on the plateform after 2015. The current usage metrics is available 48-96 hours after online publication and is updated daily on week days.
Initial download of the metrics may take a while.