| Issue |
A&A
Volume 691, November 2024
|
|
|---|---|---|
| Article Number | L14 | |
| Number of page(s) | 9 | |
| Section | Letters to the Editor | |
| DOI | https://doi.org/10.1051/0004-6361/202451977 | |
| Published online | 13 November 2024 | |
Letter to the Editor
Contemporaneous high-angular-resolution imaging of the AGB star W Hya in vibrationally excited H2O lines and visible polarized light with ALMA and VLT/SPHERE-ZIMPOL
1
Instituto de Astrofísica, Departamento de Física y Astronomía, Facultad de Ciencias Exactas, Universidad Andrés Bello, Fernández Concha 700, Las Condes, Santiago, Chile
2
Department of Physics and Astronomy, Uppsala University, Box 516 751 20 Uppsala, Sweden
3
Max-Planck-Institut für Radioastronomie, Auf dem Hügel 69, 53121 Bonn, Germany
⋆ Corresponding author; This email address is being protected from spambots. You need JavaScript enabled to view it.
Received:
23
August
2024
Accepted:
22
October
2024
Abstract
Aims. We present contemporaneous high-angular-resolution millimeter imaging and visible polarimetric imaging of the nearby asymptotic giant branch (AGB) star W Hya to better understand the dynamics and dust formation within a few stellar radii.
Methods. The star W Hya was observed in two vibrationally excited H2O lines at 268 and 251 GHz with Atacama Large Millimeter/submillimeter Array (ALMA) at a spatial resolution of 16 × 20 mas and at 748 and 820 nm at a resolution of 26 × 27 mas with the Very Large Telescope (VLT)/Spectro-Polarimetric High-contrast Exoplanet REsearch (SPHERE)-Zurich Imaging Polarimeter (ZIMPOL).
Results. ALMA’s high spatial resolution allowed us to image strong emission of the vibrationally excited H2O line at 268 GHz (v2 = 2, JKa, Kc = 65, 2–74, 3) over the stellar surface instead of absorption against the continuum, which is expected for thermal excitation. Strong, spotty emission was also detected along and just outside the stellar disk limb at an angular distance of ∼40 mas (∼1.9 R⋆), extending to ∼60 mas (∼2.9 R⋆). Another H2O line (v2 = 2, JKa, Kc = 92, 8–83, 5) at 251 GHz with a similar upper-level energy was tentatively identified, which shows absorption over the stellar surface. This suggests that the emission over the surface seen in the 268 GHz H2O line is suprathermal or even maser emission. The estimated gas temperature and H2O density are consistent with the radiatively pumped masers. The 268 GHz H2O line reveals global infall at up to ∼15 km s−1 within 2–3 R⋆, but outflows at up to ∼8 km s−1 are also present. The polarized intensity maps obtained in the visible reveal clumpy dust clouds forming within ∼40 mas (∼1.9 R⋆) with a particularly prominent cloud in the SW quadrant and a weaker cloud in the east. The 268 GHz H2O emission overlaps very well with the visible polarized intensity maps, which suggests that both the nonthermal and likely maser H2O emission and the dust originate from dense, cool pockets in the inhomogeneous atmosphere within ∼2–3 R⋆.
Key words: techniques: interferometric / stars: AGB and post-AGB / circumstellar matter / stars: imaging / stars: mass-loss / infrared: stars
© The Authors 2024
 Open Access article, published by EDP Sciences, under the terms of the Creative Commons Attribution License (https://creativecommons.org/licenses/by/4.0), which permits unrestricted use, distribution, and reproduction in any medium, provided the original work is properly cited.
This article is published in open access under the Subscribe to Open model. This email address is being protected from spambots. You need JavaScript enabled to view it. to support open access publication.
1. Introduction
Mass loss on the asymptotic giant branch (AGB) plays an important role not only in stellar evolution but also in the chemical evolution of galaxies. The initial–final mass relation of low- and intermediate-mass stars shows that stars can lose up to ∼80% of their initial mass before they evolve to white dwarfs (Cummmings et al. 2018). Despite such importance, the mass-loss mechanism in AGB stars is not yet fully understood. According to the pulsation-enhanced dust-driven outflow scenario, large-amplitude stellar pulsation levitates the material, which leads to density enhancement at the cool, upper atmosphere, where dust can form, and the radiation pressure on the dust grains can drive the mass loss (Höfner & Olofsson 2018). The recent 3D models of AGB stars show that convection can also levitate the material, which leads to clumpy stellar winds (Freytag & Höfner 2023).
To clarify the long-standing problem of the AGB mass loss, it is indispensable to probe the region within ∼10 R⋆, where dust forms and the wind accelerates. The oxygen-rich AGB star W Hya has been studied with various observational techniques from the visible to the infrared to the radio (e.g., Zhao-Geisler et al. 2011; Khouri et al. 2015, and references therein) because of its proximity ( pc, Vlemmings et al. 2003). The light curve shows clear periodicity (Woodruff et al. 2008) with a period of 389 days (Uttenthaler et al. 2011). Woodruff et al. (2009) show that the minimum near-infrared uniform-disk (UD) diameter of W Hya at phase 0.58 (near minimum light) is ∼36 mas at 1.2–1.3 μm. This is considered to correspond to the star’s angular diameter as seen in the deepest photospheric layers. We converted the UD diameter to the fully darkened disk diameter by multiplying it by the factor 1.15 derived by Zhao-Geisler et al. (2011). This resulted in a stellar angular diameter of 41.4 mas (i.e., 20.7 mas as the star’s angular radius R⋆).
Taking advantage of visible polarimetric imaging with the Spectro-Polarimetric High-contrast Exoplanet REsearch (SPHERE)-Zurich Imaging Polarimeter (ZIMPOL) instrument (Beuzit et al. 2008; Schmid et al. 2018) at the Very Large Telescope (VLT), Ohnaka et al. (2016) spatially resolved the clumpy dust clouds forming around W Hya at an angular distance of ∼50 mas (∼2.4 R⋆), which is similar to the angular distance derived by Norris et al. (2012) based on polarimetric aperture-masking experiments. The modeling of Norris et al. (2012) and Ohnaka et al. (2016) suggests a predominance of large (0.3–0.5 μm), transparent grains of Al2O3, Mg2SiO4, or MgSiO3 in the clumpy clouds, lending support to the scenario of scattering-driven mass loss (Höfner 2008). Furthermore, the second-epoch ZIMPOL observations by Ohnaka et al. (2017) revealed the morphological change in the dust clouds as well as a change in the grain size from 0.4–0.5 μm to ∼0.1 μm. Similar clumpy dust cloud formation has been imaged in other nearby AGB stars, R Dor, IK Tau, and o Cet (Khouri et al. 2016, 2018; Adam & Ohnaka 2019). Using the Atacama Large Millimeter/submillimeter Array (ALMA), Takigawa et al. (2017) imaged W Hya in the gas-phase AlO line at 344 GHz at an epoch between two ZIMPOL observations of Ohnaka et al. (2016, 2017). Takigawa et al. (2017) found that the distribution of AlO is in excellent agreement with the clumpy dust clouds seen in the polarized intensity maps. In this Letter, we present contemporaneous high-angular-resolution imaging of W Hya in two vibrationally excited H2O lines with ALMA and visible polarimetric imaging with VLT/SPHERE-ZIMPOL.
2. Observations and data reduction
We observed W Hya with ALMA on 2019 June 8 (UTC) using the C43-10 configuration (Program ID: 2018.1.01239.S, P.I.: K. Ohnaka), when the variability phase of W Hya was 0.53 at minimum light. The shortest and longest baselines were 83.1 m and 16.2 km, respectively. The largest recoverable scale is 190 mas. We observed in nine spectral windows between 250.7 and 268.2 GHz. Two vibrationally excited H2O lines reported in this Letter are located in the spectral windows centered at 250.727199 and 268.168335 GHz with bandwidths of 468.75 and 937.50 MHz observed at velocity resolutions of 1.17 and 1.09 km s−1, respectively.
The ALMA data were reduced with the Common Astronomy Software Applications (CASA version 5.6.1-8; The CASA Team 2022), following standard calibration procedures with the ALMA pipeline. We also self-calibrated the data with the continuum of W Hya. The image reconstruction was carried out with the task tclean with a robust parameter of 0.5. In total, we identified nearly 60 molecular lines, which include H2O, 29SiO, 30SiO, Si17O, OH, SO2, 34SO2, SO18O, AlO, AlOH, TiO, 49TiO, 50TiO, TiO2, SO, and HCN. The complete results will be presented in a forthcoming paper (Ohnaka et al., in prep.). The images of the H2O lines at 251 and 268 GHz were obtained with a restoring beam of 21 × 18 mas and 20 × 17 mas, respectively. The root mean square (RMS) noise is estimated to be 0.56 mJy/beam in both spectral windows.
We also used archival polarimetric imaging data of W Hya taken at 748 and 820 nm on 2019 May 30 (UTC), just nine days before our ALMA observations, using VLT/SPHERE-ZIMPOL as part of the program 0103.D-0168 (P.I.: T. Khouri). The spatial resolution estimated from the 2D Gaussian fit to the point spread function (PSF) reference star is 26 × 27 mas. The observations and data reduction are described in Appendix A.
3. Vibrationally excited H2O line at 268 GHz (v2 = 2, 65, 2–74, 3)
Figure B.1 shows the continuum image obtained in the 268.2 GHz spectral window. Fitting the continuum image with a uniform elliptical disk results in a major and minor axis of 59.1 ± 0.3 mas and 57.7 ± 0.2 mas (∼1.4 times larger than our adopted stellar angular diameter, which was also obtained near minimum light), with the position angle of the major axis being 16 ± 23°. The uniform elliptical disk fitting also results in an intensity of 36.87 ± 0.10 mJy/beam. This corresponds to a brightness temperature (Tb) of 2210 ± 6 K. We do not find a hot spot as found in the 338 GHz continuum by Vlemmings et al. (2017).
Figure 1 shows the continuum-subtracted channel maps of the vibrationally excited H2O line (v2 = 2, 65, 2 − 74, 3, Eu= 6039.00 K) at 268.149117 GHz. We adopted a systemic velocity (Vsys) of 40.4 km s−1 in the local standard of rest (LSR) derived by Khouri et al. (2014a). The relative velocity with respect to the systemic velocity (Vrel = VLSR − Vsys) is also given in each panel. The continuum-subtracted channel maps reveal that absorption is seen over the stellar disk at Vrel = −6 to 0 km s−1, which is expected because of the absorption due to the cooler gas in front of the stellar disk. However, the continuum-subtracted images from Vrel ≈ −3.0 to ∼7.5 km s−1 show noticeable emission over the stellar disk, indicating excess emission on top of the continuum. In addition, prominent, spotty emission is seen along and just outside the limb of the stellar disk at an angular distance of ∼40 mas (∼1.9 R⋆), extending to ∼60 mas (∼2.9 R⋆). The strongest emission is seen in the east-southeast at a radius of ∼50 mas (1.9 R⋆) at Vrel = −1.5 km s−1 with an intensity of ∼80 mJy/beam (Tb = 4130 K). This is approximately twice as strong as the continuum intensity (already subtracted in the images shown in the figure) over the stellar disk, despite the high energy level of the line.
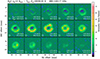 |
Fig. 1. Continuum-subtracted channel maps of W Hya obtained in the vibrationally excited H2O maser line (v2 = 2, JKa, Kc = 65, 2–74, 3, Eu = 6039.0 K) at 268.149117 GHz. The gray circles represent the ellipse fitted to the millimeter continuum image. In the lower right corner of each panel, the LSR velocity and the relative velocity (Vrel = VLSR − Vsys, Vsys = 40.4 km s−1) are shown. The restoring beam size is shown in the lower left corner of each panel. North is up, and east to the left. |
We extracted spatially resolved spectra of the H2O line at four positions over the stellar disk and on four salient emission spots away from the limb of the stellar disk, as labeled in Fig. C.1a. The spectra obtained over the stellar disk (Figs. C.1b–e) show that the emission peak is redshifted by 3–5 km s−1. However, the emission is broad, with the red wing extending to Vrel ≈ 15 km s−1 (position 2) and the blue wing extending down to −8 km s−1 (position 3). This suggests that the bulk of the material in front of the star within ∼60 mas is infalling with strong turbulent motion and/or that the H2O emission originates from layers with different velocities (both infall and outflow) due to pulsation or convection with the major contribution coming from the layers infalling at 3–5 km s−1. Wong et al. (2016) also found the presence of both infall and outflow in o Cet observed with ALMA near minimum light. We discuss the dynamics seen in our ALMA data in Sect. 7. The spectra extracted off the limb of the stellar disk (Figs. C.1f–i) show that the emission from positions 7 and 8 is as broad as that obtained at positions 3 and 4. Although the emission at positions 5 and 6 is much narrower, the spectrum at position 5 shows broad emission ranging from Vrel = −8 to 8 km s−1, and the red wing at position 6 is broader than the blue wing.
4. Vibrationally excited H2O line at 251 GHz (v2 = 2,92,8–83,5)
We also identified – albeit tentatively – another vibrationally excited H2O line (v2 = 2, 92, 8–83, 5, Eu = 6141.05 K) at a rest frequency of 250.756830 GHz (Furtenbacher et al. 2020). The uncertainty in the rest frequency of this H2O line will be discussed in greater detail in a forthcoming paper.
Figure 2 shows the channel maps obtained for this H2O line (images at Vrel > 3.0 km s−1 are not shown, because they are affected by the blend due to the adjacent Si17O line at 250.744695 GHz). While this H2O line at 251 GHz and that at 268 GHz (Sect. 3) are both in the v2 = 2 state with similar upper-level energies (6141 and 6039 K, respectively), the 251 GHz H2O line predominantly shows absorption over the stellar disk, which is in marked contrast to the prominent emission seen in the 268 GHz line across many velocity channels. The spatially resolved spectra of the 251 GHz H2O line show blueshifted absorption over the stellar disk (Fig. C.1, left column, blue lines), with the deepest absorption blueshifted by 3–4 km s−1 at positions 1 and 2 (Figs. C.1b and c).
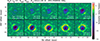 |
Fig. 2. Continuum-subtracted channel maps of W Hya obtained for the vibrationally excited H2O line (v2 = 2, JKa, Kc = 92, 8–83, 5, Eu = 6141.05 K) at 250.756830 GHz, shown in the same manner as Fig. 1. The channel maps at the velocities more redshifted than Vrel = 3.0 km s−1 are not shown, because the signals are affected by the adjacent Si17O line (v = 0, J = 6 − 5) at 250.744695 GHz. |
In the red supergiant (RSG) VY CMa, Tenenbaum et al. (2010) reported an unidentified line at rest frequencies from ∼250.712 to 250.765 GHz, which is likely a blend of the lines of 30SiO (v = 2, J = 6 − 5, 250.727751 GHz), Si17O (v = 0, J = 6 − 5, 250.744695 GHz), and H2O (v2 = 2, 92, 8–83, 5). Richards et al. (2024) detected the 251 GHz H2O line toward VY CMa and concluded that the line is quasi-thermal. Our observation of the (tentatively) identified 251 GHz H2O line seen in absorption over the stellar surface suggests that this is also the case for W Hya.
5. Nonthermal origin of the 268 GHz H2O line
Both the 251 and 268 GHz v2 = 2 H2O lines have similar upper-level energies of ∼6040–6140 K. Nevertheless, the former line is only seen in absorption. Therefore, the excess emission in the 268 GHz line is unlikely caused by hot gas in front of the star, and the net emission over the stellar disk in the continuum-subtracted images of the 268 GHz H2O line indicates suprathermal (Tex > Tkin) or even maser emission (Tex < 0), where Tex and Tkin denote the excitation temperature and kinetic temperature, respectively. Until recently there were few detections of this vibrationally excited (v2 = 2) H2O line in AGB stars and RSGs reported in the literature. Tenenbaum et al. (2010) detected a remarkably strong maser in this line toward the RSG VY CMa. Weak emission in this line was also reported in the AGB stars IK Tau (Velilla Prieto et al. 2017) and R Dor (De Beck & Olofsson 2018), and the RSG NML Cyg (Singh et al. 2022). Recently, Baudry et al. (2023) reported the widespread presence of this H2O line in 15 out of 17 AGB stars and RSGs observed with ALMA, many of which show signs of maser action.
Figure D.1 shows the negative optical depth (maser depth) of the 268 GHz H2O line as a function of the gas temperature (kinetic temperature Tkin) and the ortho-H2O number density at three dust temperatures (M. Gray, priv. comm.) based on the models of Gray et al. (2016) and similar to Fig. 17 of Baudry et al. (2023). We note a change of the maser pumping regime with increasing dust temperature. With the presence of cool dust (Td ≲ 600 K), the 268 GHz H2O maser is predominantly collisionally pumped, and it requires both a rather high gas temperature of ≳1500 K and an H2O density of ≳106 cm−3. With hot dust (Td ≳ 900 K), maser action can occur at a lower gas temperature (≲900 K) and H2O density. The pulsation+dust-driven models of Bladh et al. (2019) show that the density and gas temperature at 2–3 R⋆ are 10−14–10−15 g cm−3 and 700–1500 K, respectively. These mass densities correspond to H2 number densities of 1.5 × 10⁸–1.5 × 109 cm−3, which translates into H2O densities of 8 × 10⁴–8 × 105 cm−3 with an ortho-H2O abundance of 6 × 10⁻⁴ (Khouri et al. 2014b). This is consistent with the radiative pumping regime if the dust temperature is ≳900 K, which is indeed the case as presented below. Therefore, the excess emission of the 268 GHz H2O line over the stellar disk can be due to maser amplification. We note that (Vlemmings et al. 2021) detected emission of the CO v = 1J = 3 − 2 line over the surface of W Hya, which they interpreted as masers.
6. Comparison between the 268 GHz H2O v2 = 2 emission and dust distribution
If the 268 GHz H2O emission is due to maser action in the radiative pumping regime, it traces cool, dense regions, which also provide conditions favorable for dust to form. To examine whether there is a correlation between the H2O emission and dust formation, we compared the 268 GHz H2O emission image with the visible polarimetric imaging data obtained with VLT/SPHERE-ZIMPOL. We registered the SPHERE images to the ALMA image as follows. Instead of taking the offset intensity peak position, we fitted the SPHERE images with a uniform elliptical disk (Fig. 3c, color map). The central position of the fitted elliptical disk was registered to the center of the ALMA continuum image, which was also determined by the uniform elliptical disk fitting described in Sect. 3.
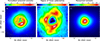 |
Fig. 3. Comparison between the SPHERE-ZIMPOL polarimetric imaging data and ALMA images of W Hya. Panel (a): Color map representing the polarized intensity map obtained at 820 nm with a spatial resolution of 26 × 27 mas. The continuum-subtracted integrated intensity map of the 268 GHz H2O line (v2 = 2, JKa, Kc = 65, 2–74, 3) obtained from Vrel = −1.5 to 1.5 km s−1 is plotted with the contours. The dark gray contours correspond to 3, 40, 80, 120, and 160 mJy/beam km s−1, while the magenta one corresponds to −5 mJy/beam km s−1. Panel (b): Color map representing the map of the degree of linear polarization obtained at 820 nm. The contours show the integrated intensity map of the 268 GHz H2O line as in panel (a). Panel (c): Color map representing the total intensity map obtained at 820 nm. The contours represent the 268 GHz continuum image. The outermost contour corresponds to 50% of the peak intensity, which approximately marks the millimeter continuum stellar disk size. The inner three contours correspond to 97.5, 98.5, and 99.5% of the peak intensity, which show the slightly offset intensity peak. |
Figure 3a (color map) shows the polarized intensity map obtained at 820 nm at a spatial resolution comparable to our ALMA images. The polarized intensity represents the radiation scattered off dust grains, and in an optically thin case, a polarized intensity map reflects the spatial distribution of the dust grains. Figure 3a reveals clumpy dust clouds forming at a radius of ∼40 mas (∼1.9 R⋆). The map of the degree of polarization (Fig. 3b, color map) shows clumpy dust structures extending up to ∼150 mas. Three regions with enhanced polarization of 10–12% are seen in the north-northwest (NNW), east, and south. In both panels, the integrated intensity of the 268 GHz H2O line near the systemic velocity is shown with the contours.
Comparison between the polarized intensity map and the 268 GHz H2O emission reveals noticeable correlation. The strong H2O emission in the south overlaps very well with the large dust cloud showing high polarized intensity. The H2O emission spots in the east and NNW also coincide with the dust clouds. The overall shape of the H2O emission with the NNW extension can also be recognized in the polarized intensity map. The previous analyses of the clumpy dust clouds forming close to the star in W Hya show a dust temperature of ∼1500 K (Ohnaka et al. 2016, 2017). This fulfills the high dust temperature condition necessary for the radiatively pumped 268 GHz H2O maser. Therefore, the agreement between the H2O emission and the polarization maps is consistent with the scenario that the H2O emission is of a maser origin.
The total intensity map obtained with ZIMPOL is presented in Fig. 3c. The aforementioned uniform elliptical disk fit results in major and minor axes of 60.6 ± 0.3 mas and 54.3 ± 0.3 mas, respectively, and a position angle of the major axis of 24 ± 4°. This size in the visible is comparable to the millimeter continuum size. The intensity peak is offset to the northwest (NW) by ∼7 mas (∼0.3 R⋆) from the stellar disk center. The overlaid 268 GHz continuum image (contours) also shows a slight offset of the intensity peak of ∼7 mas to the NW, although the intensity contrast is much weaker. It is possible that the asymmetry in the ZIMPOL and ALMA data originates from the same inhomogeneity in the atmosphere. For completeness, a comparison of the H2O emission with the ZIMPOL data obtained at 748 nm is presented in Appendix E, which is very similar to Fig. 3.
7. Discussion and conclusion
We detected unexpectedly strong nonthermal emission of the 268 GHz H2O line covering nearly the entire surface of the AGB star W Hya, in marked contrast to the thermal absorption seen in the (tentatively identified) 251 GHz H2O line. The H2O gas in front of the star shows infall at up to 15 km s−1 and outflow at up to ∼8 km s−1 within ∼2–3 R⋆, with the major contribution to the emission originating from the material infalling at 3–5 km s−1. If the H2O line emission traces dense, cool pockets as indicated by the maser models, and the grains and gas are kinematically coupled, the observed spatial correlation between dust and H2O indicates that the dust clouds are predominantly infalling but with some contribution from outflowing material.
The dynamics within 2–3 R⋆ predicted by the 1D dynamical models (Höfner et al. 2016, 2022) is dominated by the expanding and infalling layers generated by stellar pulsation with velocities of up to 15 km s−1 (infall) and ∼10 km s−1 (outflow). The latest 3D models (Freytag & Höfner 2023) show that dust forms and grows in large clumps, some of which are accelerated to ∼25 km s−1. However, they also show that there are dust grains that do not grow to the size sufficient for outward acceleration and that fall back to the star at up to ∼25 km s−1. The infall and outflow velocities observed in the 268 GHz H2O line are in broad agreement with these theoretical models. Furthermore, Liljegren et al. (2017, Fig. 5) show that dust grains start to form in infalling material, and they are not immediately accelerated outward. This is qualitatively consistent with our findings (assuming the kinematical coupling of dust and gas). Radiative transfer modeling of the ZIMPOL data will allow us to constrain the grain size, which in turn will help us estimate the radiation pressure on the grains. Also, the grains that started to form in the infalling material are expected to be small, which can be tested by the grain size derived from the modeling.
Acknowledgments
This work is based on observations made with the Atacama Large Millimeter/submillimeter Array (Program ID: 2018.1.01239.S) and observations collected at the European Southern Observatory under ESO programme 0103.D-0168(B). K.O. acknowledges the support of the Agencia Nacional de Investigación Científica y Desarrollo (ANID) through the FONDECYT Regular grant 1240301. K.T.W. acknowledges support from the European Research Council (ERC) under the European Union’s Horizon 2020 research and innovation programme (Grant agreement no. 883867, project EXWINGS). We thank M. D. Gray for kindly providing us with the results of his maser models. This research made use of the SIMBAD database, operated at the CDS, Strasbourg, France.
References
- Adam, C., & Ohnaka, K. 2019, A&A, 628, A132 [NASA ADS] [CrossRef] [EDP Sciences] [Google Scholar]
- Baudry, A., Wong, K. T., Etoka, S., et al. 2023, A&A, 674, A125 [NASA ADS] [CrossRef] [EDP Sciences] [Google Scholar]
- Beuzit, J.-L., Feldt, M., Dohlen, K., et al. 2008, SPIE Proc., 7014, 18 [NASA ADS] [Google Scholar]
- Bladh, S., Liljegren, S., Höfner, S., Aringer, B., & Marigo, P. 2019, A&A, 626, A100 [NASA ADS] [CrossRef] [EDP Sciences] [Google Scholar]
- Cummmings, J. D., Kalirai, J. S., Tremblay, P.-E., Ramirez-Ruiz, E., & Choi, J. 2018, ApJ, 866, 21 [NASA ADS] [CrossRef] [Google Scholar]
- De Beck, E., & Olofsson, H. 2018, A&A, 615, A8 [NASA ADS] [CrossRef] [EDP Sciences] [Google Scholar]
- Freytag, B., & Höfner, S. 2023, A&A, 669, A155 [NASA ADS] [CrossRef] [EDP Sciences] [Google Scholar]
- Furtenbacher, T., Tóbiás, R., Tennyson, J., et al. 2020, J. Phys. Chem. Ref. Data, 49, 043103 [NASA ADS] [CrossRef] [Google Scholar]
- Gray, M. D., Baudry, A., Richards, A. M. S., et al. 2016, MNRAS, 456, 374 [NASA ADS] [CrossRef] [Google Scholar]
- Höfner, S. 2008, A&A, 491, L1 [NASA ADS] [CrossRef] [EDP Sciences] [Google Scholar]
- Höfner, S., & Olofsson, H. 2018, A&ARv, 26, 1 [Google Scholar]
- Höfner, S., Bladh, S., Aringer, B., & Ahuja, R. 2016, A&A, 594, A108 [NASA ADS] [CrossRef] [EDP Sciences] [Google Scholar]
- Höfner, S., Bladh, S., Aringer, B., & Eriksson, K. 2022, A&A, 657, A109 [NASA ADS] [CrossRef] [EDP Sciences] [Google Scholar]
- Khouri, T., de Koter, A., Decin, L., et al. 2014a, A&A, 561, A5 [NASA ADS] [CrossRef] [EDP Sciences] [Google Scholar]
- Khouri, T., de Koter, A., Decin, L., et al. 2014b, A&A, 570, A67 [NASA ADS] [CrossRef] [EDP Sciences] [Google Scholar]
- Khouri, T., Waters, L. B. F. M., de Koter, A., et al. 2015, A&A, 577, A114 [NASA ADS] [CrossRef] [EDP Sciences] [Google Scholar]
- Khouri, T., Maercker, M., Waters, L. B. F. M., et al. 2016, A&A, 591, A70 [NASA ADS] [CrossRef] [EDP Sciences] [Google Scholar]
- Khouri, T., Vlemmings, W. H. T., Olofsson, H., et al. 2018, A&A, 620, A75 [NASA ADS] [CrossRef] [EDP Sciences] [Google Scholar]
- Liljegren, S., Höfner, S., Eriksson, K., & Nowotny, W. 2017, A&A, 606, A6 [NASA ADS] [CrossRef] [EDP Sciences] [Google Scholar]
- Norris, B., Tuthill, P. G., Ireland, M. J., et al. 2012, Nature, 484, 220 [NASA ADS] [CrossRef] [Google Scholar]
- Ohnaka, K., Weigelt, G., & Hofmann, K.-H. 2016, A&A, 589, A91 [NASA ADS] [CrossRef] [EDP Sciences] [Google Scholar]
- Ohnaka, K., Weigelt, G., & Hofmann, K.-H. 2017, A&A, 597, A20 [NASA ADS] [CrossRef] [EDP Sciences] [Google Scholar]
- Richards, A. M. S., Asaki, Y., Baudry, A., et al. 2024, Proc. IAU Symp., 380, 389 [NASA ADS] [Google Scholar]
- Schmid, H. M., Bazzon, A., Roelfsema, R., et al. 2018, A&A, 619, A9 [NASA ADS] [CrossRef] [EDP Sciences] [Google Scholar]
- Singh, A. P., Edwards, J. L., & Ziurys, L. M. 2022, AJ, 164, 230 [NASA ADS] [CrossRef] [Google Scholar]
- Takigawa, A., Kamizuka, T., Tachibana, S., & Yamamura, I. 2017, Sci. Adv., 3, eaao2149 [NASA ADS] [CrossRef] [Google Scholar]
- Tenenbaum, E. D., Dodd, J. L., Milam, S. N., Woolf, N. J., & Ziurys, L. M. 2010, ApJ, 720, L102 [NASA ADS] [CrossRef] [Google Scholar]
- The CASA Team (Bean, B., et al.) 2022, PASP, 134, 114501 [NASA ADS] [CrossRef] [Google Scholar]
- Uttenthaler, S., Van Stiphout, K., Voet, K., et al. 2011, A&A, 531, A88 [NASA ADS] [CrossRef] [EDP Sciences] [Google Scholar]
- Velilla Prieto, L., Sánchez Contreras, C., Cernicharo, J., et al. 2017, A&A, 597, A25 [NASA ADS] [CrossRef] [EDP Sciences] [Google Scholar]
- Vlemmings, W. H. T., van Langevelde, H. J., Diamond, P. J., Habing, H. J., & Schilizzi, R. T. 2003, A&A, 407, 213 [NASA ADS] [CrossRef] [EDP Sciences] [Google Scholar]
- Vlemmings, W., Khouri, T., O’Gorman, E., et al. 2017, Nat. Ast., 1, 848 [CrossRef] [Google Scholar]
- Vlemmings, W., Khouri, T., & Tafoya, D. 2021, A&A, 654, A18 [NASA ADS] [CrossRef] [EDP Sciences] [Google Scholar]
- Wong, K. T., Kamiński, T., Menten, K. M., & Wyrowski, F. 2016, A&A, 590, A127 [NASA ADS] [CrossRef] [EDP Sciences] [Google Scholar]
- Woodruff, H. C., Tuthill, P. G., Monnier, J. D., et al. 2008, ApJ, 673, 418 [NASA ADS] [CrossRef] [Google Scholar]
- Woodruff, H. C., Ireland, M. J., Tuthill, P. G., et al. 2009, ApJ, 691, 1328 [NASA ADS] [CrossRef] [Google Scholar]
- Zhao-Geisler, R., Quirrenbach, A., Köhler, R., Lopez, B., & Leinert, C. 2011, A&A, 530, A120 [NASA ADS] [CrossRef] [EDP Sciences] [Google Scholar]
Appendix A: SPHERE-ZIMPOL observations of W Hya
The archival SPHERE-ZIMPOL data used in our present work were taken on 2019 May 30 (UTC) with the filters Cnt820 (central wavelength λc = 817.3 nm and full width at half maximum (FWHM) Δλ = 19.8 nm) and Cnt748 (λc = 747.4 nm and Δλ = 20.6 nm). The star HD118877 was observed as a reference for the PSF. A summary of the ZIMPOL observations is given in Table. A.1.
We reduced the SPHERE-ZIMPOL data using the pipeline version 0.40.0 in the same manner as described in our previous studies (Ohnaka et al. 2016, 2017; Adam & Ohnaka 2019) and obtained the maps of total (i.e., polarized + unpolarized) intensity, polarized intensity, and the degree of linear polarization. The Strehl ratios of the data of W Hya at the observed wavelengths were estimated from the H-band Strehl ratio recorded in the auxiliary files (GEN-SPARTA data) of the SPHERE observations by applying the Maréchal approximation (Adam & Ohnaka 2019). The Strehl ratios of the data of the PSF reference HD118877 were directly measured from the observed total intensity maps. The derived Strehl ratios of the observations of W Hya and HD118877 are ∼0.5 and ∼0.3, respectively, in the visible. The 2D Gaussian fit to the total intensity maps of the PSF reference HD118877 resulted in PSF FWHMs of 26 × 27 mas.
SPHERE-ZIMPOL observations of W Hya and the PSF reference star HD118877.
Appendix B: Millimeter continuum image of W Hya
Figure B.1 shows the image of W Hya obtained in the 268 GHz continuum with a restoring beam of 18 × 16 mas. The angular diameter of ∼60 mas obtained by fitting with a uniform elliptical disk is ∼1.4 times larger than the stellar angular diameter of 40.7 mas. The intensity peak is slightly offset by ∼7 mas (∼0.34 R⋆) to the NW from the disk center. However, the asymmetry in the intensity is 1% at most, as plotted with the contours in Fig. B.1.
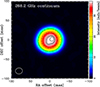 |
Fig. B.1. Continuum image of W Hya obtained in the spectral window centered at 268.2 GHz with a restoring beam of 18 × 16 mas. The contours correspond to 97.5, 98.5, and 99.5% of the maximum intensity and show the slight offset of the intensity peak. The outer black dotted line represents the elliptical fit to the image (59.1 × 57.7 mas), while the inner black dotted circle represents the stellar angular diameter of 40.7 mas obtained in the near-infrared. |
Appendix C: Spatially resolved spectra of the v2 = 2 H2O lines
Figure C.1 shows the spatially resolved spectra of the H2O lines v2 = 2, 65, 2–74, 3 and v2 = 2, 92, 8–83, 5 extracted from the continuum-subtracted data.
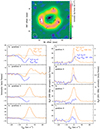 |
Fig. C.1. Spatially resolved spectra of two vibrationally excited H2O lines detected toward W Hya. Panel (a): The continuum-subtracted intensity map of the 268 GHz H2O line (v2 = 2, 65, 2–74, 3) integrated from Vrel = −1.5 to 1.5 km s−1 to show the most prominent emission components. The crosses and numbers correspond to the positions where the spatially resolved spectra shown in the lower two columns were obtained (the spectra were extracted at the marked pixels). Panels (b)–(i): Spatially resolved spectra obtained at positions 1–4 over the stellar disk and positions 5–8 off the limb of the stellar disk. The orange and blue lines show the continuum-subtracted spectra of the H2O lines v2 = 2, 65, 2–74, 3 (268 GHz) and v2 = 2, 92, 8–83, 5 (251 GHz), respectively. In panels (f)–(i), the left and right ordinates correspond to the intensity of the lines at 268 and 251 GHz, respectively. The spectra of the v2 = 2, 92, 8–83, 5 line are shown only up to Vrel = 3.2 km s−1, because the data at more redshifted velocities are affected by the blend due to the adjacent Si17O line at 250.744695 GHz. The weak emission seen at Vrel < −20 km s−1 in the 268 GHz line in panels (f)–(i) is due to the SO2 (v2 = 1, 113, 9–112, 10) line at 268.169791 GHz. The dotted lines in panels (b)–(e) mark the RMS noise level. |
Appendix D: 268 GHz H2O maser conditions
Figure D.1 shows the negative optical depth of the 268 GHz H2O line (v2 = 2, 65, 2–74, 3) as a function of the gas temperature (kinetic temperature) and the ortho-H2O number density at three different dust temperatures based on the model of Gray et al. (2016).
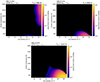 |
Fig. D.1. Negative optical depth (maser depth) of the 268 GHz H2O line (v2 = 2, 65, 2–74, 3) as a function of the gas temperature (kinetic temperature) and the ortho-H2O number density at dust temperatures (Td) of 500, 900, and 1300 K. |
Appendix E: Comparison of the ALMA image of the 268 GHz H2O v2 = 2 line with the ZIMPOL data obtained at 748 nm
Figure E.1 shows a comparison of the ALMA image of the 268 GHz H2O line (v2 = 2, JKa, Kc = 65, 2–74, 3) with the ZIMPOL data obtained at 748 nm. The results are very similar to those shown in Fig. 3. The degree of polarization at 748 nm is slightly lower than that measured at 820 nm.
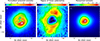 |
Fig. E.1. Comparison between the SPHERE-ZIMPOL polarimetric imaging data obtained at 748 nm and ALMA images of the 268 GHz H2O line (v2 = 2, JKa, Kc = 65, 2–74, 3) toward W Hya, shown in the same manner as Fig. 3. |
All Tables
All Figures
|
Fig. 1. Continuum-subtracted channel maps of W Hya obtained in the vibrationally excited H2O maser line (v2 = 2, JKa, Kc = 65, 2–74, 3, Eu = 6039.0 K) at 268.149117 GHz. The gray circles represent the ellipse fitted to the millimeter continuum image. In the lower right corner of each panel, the LSR velocity and the relative velocity (Vrel = VLSR − Vsys, Vsys = 40.4 km s−1) are shown. The restoring beam size is shown in the lower left corner of each panel. North is up, and east to the left. |
| In the text | |
|
Fig. 2. Continuum-subtracted channel maps of W Hya obtained for the vibrationally excited H2O line (v2 = 2, JKa, Kc = 92, 8–83, 5, Eu = 6141.05 K) at 250.756830 GHz, shown in the same manner as Fig. 1. The channel maps at the velocities more redshifted than Vrel = 3.0 km s−1 are not shown, because the signals are affected by the adjacent Si17O line (v = 0, J = 6 − 5) at 250.744695 GHz. |
| In the text | |
|
Fig. 3. Comparison between the SPHERE-ZIMPOL polarimetric imaging data and ALMA images of W Hya. Panel (a): Color map representing the polarized intensity map obtained at 820 nm with a spatial resolution of 26 × 27 mas. The continuum-subtracted integrated intensity map of the 268 GHz H2O line (v2 = 2, JKa, Kc = 65, 2–74, 3) obtained from Vrel = −1.5 to 1.5 km s−1 is plotted with the contours. The dark gray contours correspond to 3, 40, 80, 120, and 160 mJy/beam km s−1, while the magenta one corresponds to −5 mJy/beam km s−1. Panel (b): Color map representing the map of the degree of linear polarization obtained at 820 nm. The contours show the integrated intensity map of the 268 GHz H2O line as in panel (a). Panel (c): Color map representing the total intensity map obtained at 820 nm. The contours represent the 268 GHz continuum image. The outermost contour corresponds to 50% of the peak intensity, which approximately marks the millimeter continuum stellar disk size. The inner three contours correspond to 97.5, 98.5, and 99.5% of the peak intensity, which show the slightly offset intensity peak. |
| In the text | |
|
Fig. B.1. Continuum image of W Hya obtained in the spectral window centered at 268.2 GHz with a restoring beam of 18 × 16 mas. The contours correspond to 97.5, 98.5, and 99.5% of the maximum intensity and show the slight offset of the intensity peak. The outer black dotted line represents the elliptical fit to the image (59.1 × 57.7 mas), while the inner black dotted circle represents the stellar angular diameter of 40.7 mas obtained in the near-infrared. |
| In the text | |
|
Fig. C.1. Spatially resolved spectra of two vibrationally excited H2O lines detected toward W Hya. Panel (a): The continuum-subtracted intensity map of the 268 GHz H2O line (v2 = 2, 65, 2–74, 3) integrated from Vrel = −1.5 to 1.5 km s−1 to show the most prominent emission components. The crosses and numbers correspond to the positions where the spatially resolved spectra shown in the lower two columns were obtained (the spectra were extracted at the marked pixels). Panels (b)–(i): Spatially resolved spectra obtained at positions 1–4 over the stellar disk and positions 5–8 off the limb of the stellar disk. The orange and blue lines show the continuum-subtracted spectra of the H2O lines v2 = 2, 65, 2–74, 3 (268 GHz) and v2 = 2, 92, 8–83, 5 (251 GHz), respectively. In panels (f)–(i), the left and right ordinates correspond to the intensity of the lines at 268 and 251 GHz, respectively. The spectra of the v2 = 2, 92, 8–83, 5 line are shown only up to Vrel = 3.2 km s−1, because the data at more redshifted velocities are affected by the blend due to the adjacent Si17O line at 250.744695 GHz. The weak emission seen at Vrel < −20 km s−1 in the 268 GHz line in panels (f)–(i) is due to the SO2 (v2 = 1, 113, 9–112, 10) line at 268.169791 GHz. The dotted lines in panels (b)–(e) mark the RMS noise level. |
| In the text | |
|
Fig. D.1. Negative optical depth (maser depth) of the 268 GHz H2O line (v2 = 2, 65, 2–74, 3) as a function of the gas temperature (kinetic temperature) and the ortho-H2O number density at dust temperatures (Td) of 500, 900, and 1300 K. |
| In the text | |
|
Fig. E.1. Comparison between the SPHERE-ZIMPOL polarimetric imaging data obtained at 748 nm and ALMA images of the 268 GHz H2O line (v2 = 2, JKa, Kc = 65, 2–74, 3) toward W Hya, shown in the same manner as Fig. 3. |
| In the text | |
Current usage metrics show cumulative count of Article Views (full-text article views including HTML views, PDF and ePub downloads, according to the available data) and Abstracts Views on Vision4Press platform.
Data correspond to usage on the plateform after 2015. The current usage metrics is available 48-96 hours after online publication and is updated daily on week days.
Initial download of the metrics may take a while.