Fig. 3.
Download original image
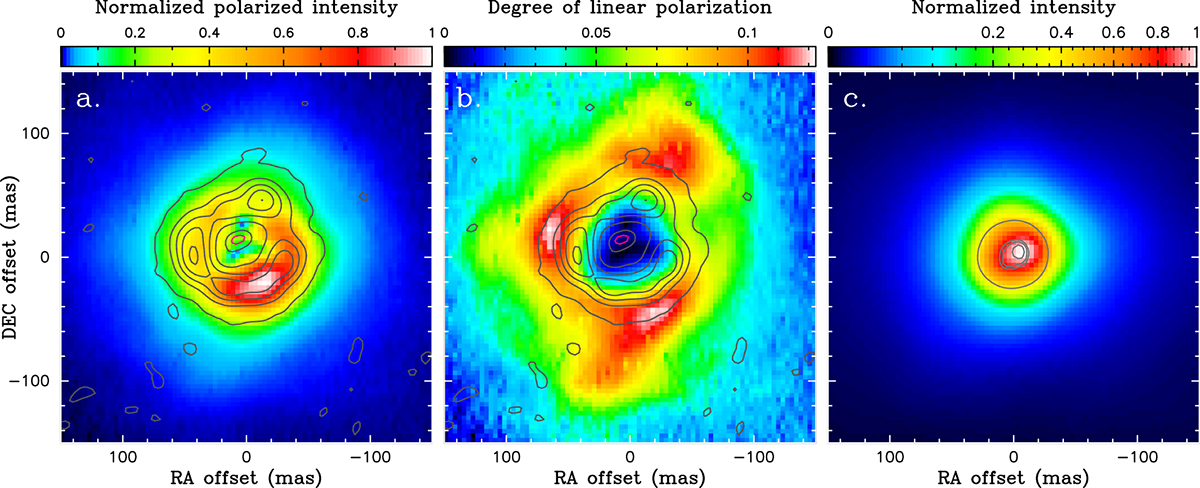
Comparison between the SPHERE-ZIMPOL polarimetric imaging data and ALMA images of W Hya. Panel (a): Color map representing the polarized intensity map obtained at 820 nm with a spatial resolution of 26 × 27 mas. The continuum-subtracted integrated intensity map of the 268 GHz H2O line (v2 = 2, JKa, Kc = 65, 2–74, 3) obtained from Vrel = −1.5 to 1.5 km s−1 is plotted with the contours. The dark gray contours correspond to 3, 40, 80, 120, and 160 mJy/beam km s−1, while the magenta one corresponds to −5 mJy/beam km s−1. Panel (b): Color map representing the map of the degree of linear polarization obtained at 820 nm. The contours show the integrated intensity map of the 268 GHz H2O line as in panel (a). Panel (c): Color map representing the total intensity map obtained at 820 nm. The contours represent the 268 GHz continuum image. The outermost contour corresponds to 50% of the peak intensity, which approximately marks the millimeter continuum stellar disk size. The inner three contours correspond to 97.5, 98.5, and 99.5% of the peak intensity, which show the slightly offset intensity peak.
Current usage metrics show cumulative count of Article Views (full-text article views including HTML views, PDF and ePub downloads, according to the available data) and Abstracts Views on Vision4Press platform.
Data correspond to usage on the plateform after 2015. The current usage metrics is available 48-96 hours after online publication and is updated daily on week days.
Initial download of the metrics may take a while.