| Issue |
A&A
Volume 608, December 2017
|
|
|---|---|---|
| Article Number | A55 | |
| Number of page(s) | 23 | |
| Section | Interstellar and circumstellar matter | |
| DOI | https://doi.org/10.1051/0004-6361/201730782 | |
| Published online | 07 December 2017 | |
Study of the aluminium content in AGB winds using ALMA
Indications for the presence of gas-phase (Al2O3)n clusters
1 Instituut voor Sterrenkunde, Katholieke Universiteit Leuven, Celestijnenlaan 200D, 3001 Leuven, Belgium
e-mail: This email address is being protected from spambots. You need JavaScript enabled to view it.
2 JBCA, Department of Physics and Astronomy, University of Manchester, Manchester M13 9PL, UK
3 SRON Netherlands Institute for Space Research, PO Box 800, 9700 AV Groningen, The Netherlands
4 Anton Pannekoek Institute for Astronomy, University of Amsterdam, PO Box 94249, 1090 GE Amsterdam, The Netherlands
5 Osservatorio Astronomico di Teramo, INAF, 64100 Teramo, Italy
6 Department of Earth and Space Sciences, Chalmers University of Technology, Onsala Space Observatory, 439 92 Onsala, Sweden
7 Radboud University, Institute for Molecules and Materials, FELIX Laboratory, Toernooiveld 7c, 6525 ED Nijmegen, The Netherlands
8 NASA/GSFC, Mail Code 690, Greenbelt, MD 20771, USA
Received: 14 March 2017
Accepted: 1 September 2017
Abstract
Context. The condensation of inorganic dust grains in the winds of evolved stars is poorly understood. As of today, it is not yet known which molecular clusters form the first dust grains in oxygen-rich (C/O < 1) asymptotic giant branch (AGB) winds. Aluminium oxides and iron-free silicates are often put forward as promising candidates for the first dust seeds.
Aims. We aim to constrain the dust formation histories in the winds of oxygen-rich AGB stars.
Methods. We obtained Atacama Large Millimeter/sub-millimeter array (ALMA) observations with a spatial resolution of 120 × 150 mas tracing the dust formation region of the low mass-loss rate AGB star, R Dor, and the high mass-loss rate AGB star, IK Tau. We detected emission line profiles of AlO, AlOH, and AlCl in the ALMA data and used these line profiles to derive a lower limit of atomic aluminium incorporated in molecules. This constrains the aluminium budget that can condense into grains.
Results. Radiative transfer models constrain the fractional abundances of AlO, AlOH, and AlCl in IK Tau and R Dor. We show that the gas-phase aluminium chemistry is completely different in both stars with a remarkable difference in the AlO and AlOH abundance stratification. The amount of aluminium locked up in these three molecules is small, ≤1.1 × 10⁻⁷ w.r.t. H2, for both stars, i.e. only ≤2% of the total aluminium budget. An important result is that AlO and AlOH, which are the direct precursors of alumina (Al2O3) grains, are detected well beyond the onset of the dust condensation, which proves that the aluminium oxide condensation cycle is not fully efficient. The ALMA observations allow us to quantitatively assess the current generation of theoretical dynamical-chemical models for AGB winds. We discuss how the current proposed scenario of aluminium dust condensation for low mass-loss rate AGB stars within a few stellar radii from the star, in particular for R Dor and W Hya, poses a challenge if one wishes to explain both the dust spectral features in the spectral energy distribution (SED) in interferometric data and in the polarized light signal. In particular, the estimated grain temperature of Al2O3 is too high for the grains to retain their amorphous structure. We advocate that large gas-phase (Al2O3)n clusters (n > 34) can be the potential agents of the broad 11 μm feature in the SED and in the interferometric data and we propose potential formation mechanisms for these large clusters.
Key words: stars: AGB and post-AGB / stars: individual: IK Tau and R Dor / astrochemistry / instrumentation: interferometers / stars: mass-loss / circumstellar matter
© ESO, 2017
 Open Access article, published by EDP Sciences, under the terms of the Creative Commons Attribution License (http://creativecommons.org/licenses/by/4.0),
which permits unrestricted use, distribution, and reproduction in any medium, provided the original work is properly cited.
Open Access article, published by EDP Sciences, under the terms of the Creative Commons Attribution License (http://creativecommons.org/licenses/by/4.0),
which permits unrestricted use, distribution, and reproduction in any medium, provided the original work is properly cited.
1. Introduction
It is well known from observations that low and intermediate mass stars (0.8 M⊙ <M < 8 M⊙) develop a low-velocity (v ~ 5–15 km s-1) stellar wind at the end of their life during the asymptotic giant branch (AGB) phase. At a mass-loss rate between 10-8 to 10-4 M⊙/yr, material is stripped away from the stellar surface. Convection-induced pulsations lift material to greater heights where the temperature is low enough for gas to condense into dust grains (Habing & Olofsson 2003; Freytag et al. 2017). Radiation pressure on these grains is thought to be the main trigger for the onset of the stellar wind. While theoretical simulations based on this scenario predict stellar wind properties in broad agreement with observations of carbon-rich (C/O > 1) AGB stars, more fine-tuning of the models is required for oxygen-rich (O-rich) AGB stars. Indeed, in these O-rich environments, the first dust seeds thought to form close to the stellar surface are metal oxides and pure Fe-free silicates such as Al2O3, SiO2, TiO2, Mg2SiO4, and MgSiO3 (Gail & Sedlmayr 1999). While their low near-infrared extinction efficiency prevents them from sublimating, it means that these glassy condensates make a negligible contribution to the radiative acceleration. The formation of both carbon and silicate grains (Höfner & Andersen 2007) or scattering of stellar radiation by micron-sized (~0.3 μm) Fe-free silicates (Höfner 2008) have been proposed as possible alternatives to solve this acceleration deficit. After its postulation in 2008 by Höfner et al., the latter scenario got more and more support from observations; the first such observations were reported by Norris et al. (2012) using VLT/NACO data of three low mass-loss rate AGB stars (R Dor, W Hya, and R Leo). The mid-infrared interferometric observations of the semi-regular AGB star RT Vir with the MIDI instrument at VLTI also lent support to the presence of iron-free silicates between 2 and 3 stellar radii (Sacuto et al. 2013). Recent polarized light data obtained with the VLT/SPHERE instrument offer us another way to look at the inner wind chemical and morphological structure. Again, these data prove the presence of grains close to the star, albeit it is not evident to put stringent constraints on the grain size (Khouri et al. 2016; Ohnaka et al. 2016). However, neither the NACO or the SPHERE data can pinpoint the exact chemical constitution of these micron-sized transparent grains.
Considering the abundance of molecular species and the temperatures at which they can exist in solid phase, thermodynamic equilibrium studies show that possible candidates for the first nucleation seeds are SiO, SiO2, MgO, Fe, Al2O3, TiO, and TiO2 (Jeong et al. 2003). However, taking into account the thermodynamic properties, MgO nucleation is thought to be completely negligible in O-rich AGB stars. Although Al2O3 dust is stable at very high temperatures, gaseous Al2O3 has a low abundance, calling into question its role as the first candidate. For a long time, TiO and TiO2 were considered to be the best candidates as primary condensates, since the nucleation rate of the more abundant SiO was thought to peak around 600 K (as based on the thermodynamic model of Schick 1960, using a single laboratory determination of the SiO vapour pressure), which is significantly lower than the typical temperatures at the inner edge of the dust shells. However, more recent laboratory experiments by Nuth & Ferguson (2006) and Gail et al. (2013) have proved that the onset of SiO nucleation starts at much higher temperatures than was previously found, although the calculated SiO condensation temperatures are still ~100 K lower than the observed temperatures of around 880 K. Recent ALMA observations of TiO and TiO2 transitions in Mira (o Ceti) show these two molecules are abundant in the gas phase, implying titanium oxides may not be important first condensates as previously thought (Kamiński et al. 2017).
The A-X infrared bands of AlO have been detected on a fair fraction of AGB stars (Banerjee et al. 2012). Rotational transitions of AlO and AlOH were reported for the oxygen-rich supergiant VY CMa by Tenenbaum & Ziurys (2009, 2010). Kamiński et al. (2016) have reported on the detection of several AlO lines in o Ceti with ALMA. The remarkable integrated-intensity map of the N = 6–5 AlO transition at 230 GHz indicates the molecule is present within 4 R⋆ from the stellar surface and shows a patchy distribution. The molecule AlOH was also potentially detected in Herschel and APEX data, while AlH and atomic Al I lines were detected in optical spectra. Takigawa et al. (2016) have reported on ALMA long-baseline observations of several molecules, including AlO, in W Hya. Finally, De Beck et al. (2017) has studied eight oxygen-rich AGB stars; AlO could clearly be identified in two of these stars and for four other targets tentative detections were shown.
Another quest focusses on the potential chemical differentiation between grains formed in low mass-loss rate versus high mass-loss rate O-rich AGB stars. Observations indicate that low mass-loss rate stars form primarily dust that preserves the spectral properties of Al2O3, and stars with higher mass-loss rates form dust with properties of warm silicate oxides (Karovicova et al. 2013)1. It is absolutely unknown if the silicates form via a heteromolecular homogeneous nucleation process consuming Mg, SiO, and H2O molecules (Goumans & Bromley 2012) or if the silicates form on top of the alumina grains (heterogeneous growth), hence gradually accelerating the wind.
A promising way to unravel the coupling between nucleation and wind generation is by studying at high spatial resolution the molecules contributing to the dust formation. This possibility is offered by ALMA (the Atacama Large Millimeter/submillimeter array). We were granted ALMA Cycle 2 observing time (project 2013.1.00166.S) to investigate the molecular content in the inner wind region of the low mass-loss rate semi-regular AGB star R Dor (Ṁ ~ 9 × 10⁻⁸ M⊙/yr) and the high mass-loss rate Mira star IK Tau (Ṁ ~ 4.5 × 10⁻⁶ M⊙/yr). We obtained the first ALMA spectral scan for O-rich AGB stars in band 7 at a spatial resolution of ~0.̋12 × 0.̋15. The full data scan will be presented in Decin et al. (in prep.). In this paper, we wish to advance our knowledge of aluminium-bearing molecules, clusters, and grains in AGB winds by considering the two stars above and another low mass-loss rate AGB star, W Hya. Some properties of the three targets are introduced in Sect. 2.1. The ALMA observations of R Dor and IK Tau are presented in Sect. 2.2. Since the aim is to correlate the gaseous aluminium content with the amount of aluminium locked up into grains, we briefly summarize the most important dust properties of the three targets in Sect. 2.3. The results of the ALMA data analysis are presented in Sect. 3. The molecular abundance fractions of AlO, AlOH, and AlCl are derived, and the aluminium fraction incorporated in gas-phase and solid-state species is presented. We show that observations indicate the potential presence of large gas-phase (Al2O3)n clusters in Sect. 4 and discuss how these large clusters can be formed. In addition, we calculate the emission of very small (Al2O3)n (n ≤ 4) clusters. The conclusions are summarized in Sect. 5.
2. Observations
2.1. Target selection
To study the intricate coupling between gas and dust chemistry and the impact of the formation of some type of dust species on the wind dynamics, for our ALMA observations we selected the two O-rich AGB stars that best represent the classes of low mass-loss rate and high mass-loss rate O-rich AGB stars, R Dor and IK Tau. The reasons for their selection are their proximity (60 pc and 260 pc, respectively), their rich infrared and submillimeter spectra with signatures of many dust species and molecules, and the fact that both targets are very well studied with various instruments. Each target has a very different dust emission spectrum (see Sect. 2.3); the spectrum of IK Tau is dominated by amorphous olivine dust (magnesium-iron silicates (Mg2−x,Fex)SiO4, with 0 ≤ x ≤ 2), while the infrared spectrum of R Dor does not show the presence of olivine dust but species such as corundum (an aluminium oxide, Al2O3), the aluminium-calcium bearing silicate gehlenite, the magnesium-aluminium member spinel, and CO2 gas have been detected (Heras & Hony 2005; Khouri 2014). This supports the hypothesis that the dust condensation sequence in the low mass-loss rate object R Dor has experienced a process called “freeze-out” (Tielens 1990), where the sequence is not completed and stops at an intermediate product when the wind density drops below the density required for the next step; in this particular case the freeze-out occurs after the formation of aluminium oxide with only a small amount of silicon condensing into dust grains.
In IK Tau the formation of silicon-bearing dust species seems to be much more efficient. This can happen through either a one-step process, i.e. the growth of micron-sized Fe-free silicates close the central star, or a two-step process might take place, i.e. the growth of aluminium oxides around a few stellar radii (R⋆), after which the grains were coated with silicates around ~10 stellar radii.
R Dor is the closest AGB star to our Sun with a gas mass-loss rate value of ~0.9−2 × 10⁻⁷ M⊙/yr and an expansion velocity of only ~5.7 km s-1 (Schöier et al. 2004; Khouri 2014; Maercker et al. 2016; Van de Sande et al. 2017). This star is a semi-regular variable with two pulsation modes that have periods of 332 days and about 175 days; the latter mode has a much smaller amplitude (Bedding et al. 1998). The angular diameter of this star is ~60 mas (Bedding et al. 1997; Norris et al. 2012). From an analysis of Herschel and sub-millimeter data, Khouri (2014) and Van de Sande et al. (2017) have derived that some 90% of atomic silicon is locked up in gaseous SiO and the remainder in silicates. Data from VLTI/NACO and SPHERE/ZIMPOL support the presence of a close halo of large transparent grains (~0.3 μm) at ~1.5−2 R⋆ (Norris et al. 2012; Khouri et al. 2016).
IK Tau is a high mass-loss rate Mira-type AGB star with a gas mass-loss rate of ~4.5× 10⁻⁶ M⊙/yr, an expansion velocity of 17.7 km s-1 (Decin et al. 2010a; Maercker et al. 2016), and a pulsation period of ~470 days (Wing & Lockwood 1973). The angular diameter is estimated around 20 mas (Decin et al. 2010a). Currently, a dozen different molecules and some of their isotopologues have been discovered in IK Tau, including CO, HCN, SiO, SiS, SO, SO2, NaCl, NS, NO, HCO+, H2CO, PO, PN, and H2S (Milam et al. 2007; Kim et al. 2010; Decin et al. 2010a,b; De Beck et al. 2013, 2015; Velilla Prieto et al. 2017). Some molecules including SiO and SiS are depleted in the circumstellar envelope, possibly owing to condensation onto dust grains. Other molecules such as HCN demonstrate the impact of pulsation-driven shocks in the inner wind zone which forces the chemistry into a non-equilibrium state (Duari et al. 1999; Cherchneff 2006).
W Hya resembles in many aspects the low mass-loss rate AGB star R Dor. Thanks to is proximity (~78 pc; Knapp et al. 2003) and its brightness, R Dor is also well studied with various observational techniques from the visible to the radio. This semi-regular variable has a light curve showing a clear periodicity with period of 389 days (Uttenthaler et al. 2011). The molecular abundance stratification in its circumstellar envelope was studied in detail by Khouri et al. (2014a,b). Based on an extensive grid of CO, SiO, H2O, and HCN lines (and some of their isotopologues) the thermodynamic structure of the wind was derived and they deduced that about one-third of the silicon atoms is locked up in dust particles. The SED of W Hya is characterized by the same dust emission peaks as R Dor (see Sect. 2.3) and also for this star large scattering grains in a halo close the star are detected via polarized light signal (Norris et al. 2012; Ohnaka et al. 2016). W Hya was also observed by ALMA in band 7 (project 2015.1.01466.S, P.I. A. Takigawa) with a spatial resolution of ~40 mas at three selected frequency bands (330.40–331.34 GHz, 342.40–343.34 GHz, and 344.03–345.91 GHz) encompassing the AlO N = 9–8 and AlOH J = 11–10 transition. AlO is detected in their data (Takigawa et al. 2016).
2.2. ALMA observations
2.2.1. ALMA observing strategy
Spectral scans of IK Tau and R Dor were obtained covering the frequencies between 335–362 GHz, using four separate observations each during August-September 2015. The observations and data reduction used the ALMA pipeline for calibration; we followed this by identifying and imaging the line-free continuum, which was then used for self-calibration. The solutions were applied to all data and spectral cubes were made adjusted to constant vLSR. The process is described in more detail in Decin et al. (in prep.); here, we concentrate on the parameters affecting the Al compound cubes. The astrometric accuracy is ~17 mas and the flux scale is accurate to ~7%. The relative accuracy (e.g. aligning different lines in the same source) is limited only by the signal-to-noise (S/N) and would be <1 mas for S/N of 200, or 33 mas (about 1 pixel) for a faint 3σ detection of a compact source. The rms noise (σrms) varies across the band depending on intrinsic atmospheric transmission and the weather at the time of observations. The final image parameters are summarized in Table 1. Owing to the different elevations as seen from ALMA, we achieved a higher resolution and used a smaller pixel size (30 mas versus 40 mas) for R Dor versus IK Tau. For each line, we made cubes at higher and lower spectral resolution (see info in Table 1) using different weighting and spectral averaging. In addition, for AlO, we further smoothed the wide-channel data set with a 500 mas Gaussian kernel. The other lines detected and the sub-mm continuum properties will be discussed in future papers.
ALMA observation parameters for the Al-compounds in IK Tau and R Dor.
2.2.2. Al-bearing species detected with ALMA
Chemical models show that the most likely carriers of aluminium in the wind of oxygen-rich evolved stars are AlH, AlO, AlOH, AlO2, and AlCl (Gobrecht et al. 2016). AlO2 is also predicted to be abundant along with some other small aluminium clusters very close to the star. The main isomers of AlO2 is linear and its rotational lines are not observable. AlO, AlOH, AlH, and Al were detected in o Ceti (Kamiński et al. 2016). AlH does not have a rotational line transition in the targeted ALMA frequency range. The following other three aluminium-bearing molecules are detected in IK Tau and R Dor with ALMA: AlO N = 9−8 (rest frequency, νrest, at 345.457 GHz, lower state energy Elow = 66 K), AlOH J = 11−10 (νrest = 346.156 GHz, Elow = 83 K), and AlCl J = 24−23 (νrest = 349.444 GHz, Elow = 193 K).
The transitions of these three molecules are split up by hyperfine components due to the nuclear spin, I = 5/2, of aluminium. AlOH and AlCl are closed-shell species with a  ground state. AlO is a radical with a 2Σ ground state. The rotational levels of this molecule are therefore split by both fine and hyperfine interactions. The net result is that each rotational transition consists of 10−12 favourable, closely spaced, hyperfine components (Tenenbaum & Ziurys 2009, 2010).
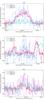 |
Fig. 1 ALMA AlO, AlOH, and AlCl data extracted for an aperture size of 320 mas (300 mas) and 800 mas (1000 mas) for IK Tau (R Dor). The frequency range is shifted to rest frequency using a local standard of rest velocity, vLSR, of 35 km s-1 for IK Tau and of 7 km s-1 for R Dor. Close to the AlOH emission, NS |

Figure 1 shows the flux densities extracted for an aperture size of 320 mas (300 mas) and 800 mas (1000 mas) for IK Tau (R Dor). The channel maps for AlOH in IK Tau and AlO in R Dor are shown in Figs. 2 and 3, respectively. The other channel maps are presented in Appendix A. Table 2 gives the measured properties of each molecular transition, including the velocity width, the shift of the centroid w.r.t. the LSR velocity of the star, the angular width, and the peak flux and integrated flux within the specified velocity interval. The angular width was obtained from the zeroth moment (total intensity) by measuring the mean flux in annuli of 60 (80) mas, centred on the position of R Dor (IK Tau), assumed to be the continuum peak. The angular size was taken as the distance out to 2σrms. The measurements were also used to compute the azimuthally averaged flux densities to compare with 1D models solving the non-LTE radiative transfer equation for the specific molecule and with models solving the chemical network by Gobrecht et al. (2016) in Sect. 3. The emission of some molecular transitions shows some irregular morphologies (as described in the next subsections) but there is no obvious preferred direction, so this is a reasonable approximation although not allowing for clumpiness.
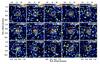 |
Fig. 2 Channel maps (colour scale in mJy) of the AlOH J = 11–10 transition in IK Tau. White contours are the continuum at (−1, 1, 4, 16, 64, 256) × 0.3 mJy. The ordinate and co-ordinate axis give the offset of the right ascension and declination, respectively, in units of arcseconds. The ALMA beam size is shown in the bottom left corner of the top panel. |
Spectral properties of AlO, AlOH, and AlCl as observed with ALMA in IK Tau (top part of the table) and R Dor (bottom part).
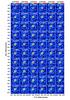 |
Fig. 3 Channel maps (colour scale in mJy) of the AlO N = 9–8 transition in R Dor. White contours are the continuum at (−1, 1, 4, 16, 64, 256) × 0.15 mJy. The ordinate and co-ordinate axis give the offset of the right ascension and declination, respectively, in units of arcseconds. The ALMA beam size is shown in the bottom left corner of the top panel. |
IK Tau
-
AlO: looking at Fig. A.1, AlO remains at first sight barely detected in IK Tau. This is reflected by the line profile for the 320 mas extraction aperture (Fig. 1). However, enlarging the extraction aperture to 800 mas, a clear signature of AlO emission is seen with a peak flux of 0.19 Jy and integrated line flux of 3.2 Jy km s-1. The SMA observations by De Beck et al. (2017) also show a weak AlO emission feature with an integrated line flux of 2.33 Jy km s-1 for an aperture of 1 × 1′′. This points towards faint extended AlO emission that is probably genuinely clumpy. To verify this idea, we averaged the AlO emission over five channels and smoothed the emission with a 0.̋5 Gaussian kernel; see Fig. A.2. Albeit the S/N is still low and we caution that the smoothing is on a scale comparable to the maximum recoverable scale (MRS), this figure indeed hints at extended clumpy emission.
-
AlOH: the channel maps of IK Tau show a clear detection of AlOH with a peak strength around 0.07–0.12 Jy (depending on the extraction aperture; Fig. 2). The emission is centred around the peak of the continuum emission and has an angular width of ~240 mas.
-
AlCl: around the vLSR of ~35 km s-1 almost no AlCl emission is seen, but the emission increases in strength at blue-shifted velocities (Fig. A.3). This is reflected in the asymmetric AlCl line profile in Fig. 1.
R Dor
-
AlO: the bright AlO N = 9–8 is easily picked up by the ALMA instrument with a peak flux of ~0.13–0.17 Jy for the two different extraction apertures. The emission is smooth and concentrated around the peak of the continuum emission (Fig. 3). At an offset of ~280 mas to the south-east, enhanced AlO emission is seen in many channel maps (Fig. A.4). At the same offset location other molecules (including AlOH, SO, SiO, CO, and SO2; see Decin et al., in prep.) show excess emission as well with the main peak having a blue-shifted frequency offset of 15–20 MHz.
-
AlOH: the AlOH emission in R Dor is very weak and just above 3σrms for the 300 mas extraction aperture (Fig. 1). The main emission around vLSR is slightly off-centre (as compared to the peak of the continuum emission; Fig. A.5). As noted already for AlO, a brighter clump of emission is visible around 280 mas to the south-east (Fig. A.6).
-
AlCl: almost no AlCl emission is visible around vLSR for the 300 mas aperture (Fig. A.7), but brighter emission becomes apparent at larger velocities with a peak flux around 0.02–0.06 Jy and an integrated flux of 0.1–0.3 Jy km s-1 (depending on the extraction aperture).
The different velocity offsets for AlCl, on the red-shifted versus blue-shifted sides of the systemic velocity, for R Dor versus IK Tau cautions us to consider a potential blend or misidentification of this species.
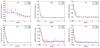 |
Fig. 4 Azimuthally averaged flux density in function of the angular distance from the central star for IK Tau (top) and R Dor (bottom), respectively. The ALMA data are shown in red with the vertical bars denoting the uncertainty. The radiative transfer model predictions are shown in blue (see Sect. 3.1). |
2.3. Infrared continuum emission
Both R Dor and W Hya were observed with the Short Wavelength Spectrometer (SWS) on board of the Infrared Space Observatory (ISO) using the AOT01 observing mode. R Dor was observed at so-called speed 1, while for W Hya both speed 1 and speed 3 were used. The spectral resolution for the speed 3 data is around 700–1000 and is a factor of ~2 worse for the speed 1 data. Interferences in the instrument however cause fringes in the ISO band 3 data (12–29 μm), particularly in the case of the higher resolution observations. Unfortunately, no ISO-SWS data are available for IK Tau, where the only infrared spectrum available is from IRAS-LRS data (see Fig. 5).
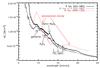 |
Fig. 5 Infrared spectrum of R Dor (black, full line), W Hya (gray, full line, scaled with a factor 1.5), and IK Tau (red, dashed line). Spectral features arising from dust species such as crystalline and amorphous Al2O3, gehlenite (Ca2Al2SiO7), and so-called astronomical silicates (amorphous olivines with different relative magnesium and iron fractions; de Vries et al. 2010) are indicated. |
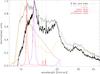 |
Fig. 6 Continuum subtracted and normalized SED of R Dor and W Hya (in full black and gray lines, respectively). Characteristic (scaled) emission patterns of different dust species are shown in the coloured dashed lines. The gray vertical dotted lines indicate CO2 molecular emission (Justtanont et al. 1998; Ryde et al. 1999). |
The SPHERE/ZIMPOL data of R Dor and W Hya (Khouri et al. 2016; Ohnaka et al. 2016) confirm the earlier result by Norris et al. (2012) that a halo of large transparent grains is present at ~1.5–3 R⋆. Estimated grain sizes are around 0.3–0.5 μm and Fe-free silicates or Al2O3 are put forward as the possible dust species that produce the scattered light.
Zhao-Geisler et al. (2011) monitored W Hya with MIDI/VLTI (8–13 μm, spectral resolution of 30) during nearly three pulsation cycles. From the spectrally dispersed visibility data, the authors concluded that the Fe-rich silicate emission seen around 10 μm in the ISO-SWS data arises from a region fairly far away from the star, at radii larger than 30 times the photospheric radius. Using image reconstruction techniques, Zhao-Geisler et al. (2015) were able to spatially resolve the dust formation region close to the star and deduced that the data signal the presence of a dust layer of presumably amorphous aluminium oxide (Al2O3) at ~2 R⋆. The observations suggest that the formation of amorphous Al2O3 occurs mainly around or after visual minimum (Zhao-Geisler et al. 2012).
VLTI/MIDI data are also available for R Dor. However the fringe-track data do not contain any interferometric signals. The beams were probably not overlapped correctly, as the data were taken for test purposes. No MIDI data are available for IK Tau.
The SED of W Hya together with infrared images and optical scattered light fractions were analysed by Khouri et al. (2015). The only way to explain all observed signatures, and in particular the amorphous Al2O3 emission in the SED, was by implementing a so-called gravitationally bound dust shell (GBDS) close to the star at around 1.5 to 3 stellar radii in their radiative transfer model. Observations and models of AGB winds have long shown the existence of dense gas layers that are rich in molecules and dust that are gravitationally bound to the star (Bowen 1988; Willacy & Cherchneff 1998; Tsuji 2000; Ireland et al. 2004; Ohnaka et al. 2005; Cherchneff 2006; Wittkowski et al. 2007). In the GBDS, the ratio of the radiation pressure on the grains to the gravitational attraction (called the Γ-factor) is still smaller than 1 so that the dust particles can reside close to the star without being pushed outwards. This allows the material to potentially grow in size, and Γ can become larger than 1 only once their size is larger than 0.1–0.3 μm. This idea of a GBDS was recently shown to fit well with the theoretical dynamical wind models of Höfner et al. (2016), who allowed for the formation of composite grains with an Al2O3 core and a silicate mantle at slightly larger distances than the Al2O3 GBDS shell, thereby giving the wind a kick start. The location of the GBDS coincides with the region in which large transparent grains are detected in polarized light images (Norris et al. 2012; Ohnaka et al. 2016), albeit this does not imply by necessity that the species responsible for the Al2O3 emission in the SED are the same species that cause the stellar light to be scattered. Thus, it is still possible that the scattering agents are Fe-free silicates, since these can remain fairly cold and hence do not produce signatures in the thermal infrared.
The poor quality of the infrared continuum data of IK Tau led us to decide not to analyse the dust content in this object, but to focus on the dust composition of R Dor and W Hya. We combined the available IR data for the latter two objects and subtracted the stellar continuum (represented as a black body with temperatures of 3000 K for R Dor and of 2500 K for W Hya) to visualize better their dust spectral features; see Fig. 6. The emission bands of some dust aluminium bearing dust species are plotted along with some CO2 and H2O molecular emission features.
3. Results
In this section, we first determine the mean fractional abundances of AlO, AlOH, and AlCl in the inner winds of R Dor and IK Tau (Sect. 3.1). These results are then compared quantitatively to the theoretical dynamical-chemical model predicting the inner wind abundance structure (Sect. 3.2). The amount of aluminium locked up in gaseous species turns out to be low, leaving ample room for aluminium to be incorporated into dust grains. However, as we discuss in Sect. 3.3, the estimated grain temperatures for aluminium oxide (Al2O3) at ~2 R⋆ is high, which suggests that the grains are annealed and hence have a crystalline lattice structure. This outcome implies a tension in the interpretation of the 11 μm spectral feature, present in the SED and interferometric data. We hypothesize that large gas-phase aluminium oxide clusters are the cause of the 11 μm feature and explain how these large clusters can be formed (Sect. 4).
3.1. Abundances of aluminium-bearing molecules
To establish the abundance and distribution of AlO, AlOH, and AlCl, we modelled the ALMA data using a non-LTE radiative transfer model of the circumstellar envelope (CSE). We use a code based on the Accelerated Lambda Iteration (ALI) method (Maercker et al. 2008), which allows us to retrieve the global mean molecular density by assuming a 1D geometry. Collisional excitation rates have not been published for any of these three molecules. For that reason, we used the values for the HCN-H2 system (Green & Thaddeus 1974) as substitute for AlOH (cf. Tenenbaum & Ziurys 2010) and the values of SiO-H2 (Dayou & Balança 2006) for AlO and AlCl (cf. Kamiński et al. 2016), scaling for the difference in molecular weight. The collisional rates are used in the form they appear in the LAMDA database2 (Schöier et al. 2005). To check for the dependency on collisional excitation rates, we also ran models using the CS-H2 cross sections (Turner et al. 1992) and found no significant difference in results. The first 30 rotational levels in the ground vibrational state were considered for AlOH and the first 40 such levels were considered for AlO and AlCl. Our treatment of the radiative transfer does not deal with the (hyper)fine structure components, and is therefore limited to the prediction of rotational lines N → N′ or J → J′ with Δ N or Δ J equal to 1. Therefore, all levels treated are described by one quantum number, N or J. The final line profile is computed by splitting the predicted total intensity over the different (hyper)fine components according to their relative quantum-mechanical line strength, S, as given in CDMS3 (Müller et al. 2001, 2005). This approach is only valid under LTE conditions.
For an angular diameter of 20 mas and a distance of 260 pc, the stellar radius of IK Tau is ~3.8 × 1013 cm, while the angular diameter of 57 mas and the distance of 60 pc translates into a stellar radius of ~2.5 × 1013 cm for R Dor. The gas kinetic temperature is assumed to follow a power law (Justtanont et al. 1994; Groenewegen 1994; Decin et al. 2006)  (1)and the gas velocity profile is parametrized using a β-type law
 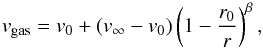 (2)with r the distance to the star, v∞ the terminal velocity, and v0 the velocity at radius r0 at which the wind is launched and which is set to the local sound speed. The gas velocity within the dust condensation radius, r <r0, is assumed to be 2 km s-1. The turbulent velocity for both stars is assumed to be 1 km s-1. The gas density, ρ(r), is calculated from the equation of mass conservation
  (3)The main input parameters for R Dor and IK Tau are listed in Table 3, following Maercker et al. (2016). These properties are simplified estimates, for example the velocity structure inside the dust formation radius is complex, but are adequate for 1D modelling in the regions where these Al compounds have been observed. For all molecular species, the fractional abundance structure with respect to H2 was varied until a fit with the ALMA azimuthally averaged flux density was achieved (see Fig. 4). In some cases, the fractional abundance declines according to a Gaussian profile centred on the star, and hence is described by following equation
 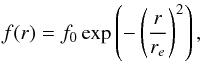 (4)with f0 the initial abundance and re the e-folding radius.
Input parameters for the non-LTE radiative transfer modelling.
The retrieved fractional abundance structures are shown in Fig. 7. Clearly both stars show very different distributions of Al-bearing molecules. For IK Tau, AlOH could be modelled assuming a Gaussian distribution with a peak central abundance of 4.4 × 10⁻⁹ and an e-folding radius, re, of 22 R⋆. As could be deduced already from Figs. 1 and A.2, the AlO emission might be clumpy and not show a centrally peaked abundance structure. The data could be modelled assuming a constant abundance of 4.4 × 10⁻⁸ from 50–160 R⋆. If the AlCl identification is correct (see Sect. 2.2), then the data are compatible with a Gaussian distribution with peak central abundance of 9 × 10⁻¹⁰ and re of 40 R⋆. The AlOH emission in R Dor can be approximated with a constant slab with abundance of 1.4 × 10⁻⁹ from the stellar surface out to 12 R⋆. The AlO and AlCl distribution in R Dor follow a Gaussian distribution with peak central abundance of 8.4 × 10⁻⁸ and 2.5 × 10⁻⁸ and e-folding radius of 3.8 R⋆ and 2.4 R⋆, respectively. The good correspondence between the observed and predicted emission of AlO in R Dor, allowing for the splitting over the different hyperfine components, is shown in Fig. 8.
While we can trace the fractional abundance above 1 × 10⁻⁹ within ~150 R⋆ for IK Tau, the ALMA Al-data of R Dor only cover the first 25 R⋆. The factor ~6 difference in spatial extent is in line with the factor ~50 in mass-loss rate and hence sensitivity to some particle density assuming a density law, which is proportional to r-2.
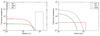 |
Fig. 7 Retrieved fractional abundance structure [AlO/H2], [AlOH/H2], and [AlCl/H2] for IK Tau (left) and R Dor (right). |
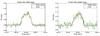 |
Fig. 8 Comparison between the extracted ALMA AlO spectra of R Dor (green) and the predicted line profile (red) for an AlO abundance structure as given in Fig. 7 for the 300 mas (left) and 1000 mas (right) extraction aperture. |
For the low-mass loss rate star o Ceti, Kamiński et al. (2016) derived AlO abundance from ALMA data in the range 10-9–10-7 and concluded a small amount of aluminium was locked up in AlO. Our AlO abundance for R Dor shown in Fig. 7 is compatible with this value range and we reach a similar conclusion regarding the small Al content in Al-bearing molecules. Indeed, assuming a solar aluminium content of [Al/H] = 3 × 10⁻⁶, our results imply that for both stars only a small fraction of aluminium (≲2%) is locked up in AlO, AlOH, and AlCl.
3.2. Gas-phase aluminium budget
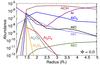 |
Fig. 9 Predicted abundances of aluminium-bearing molecules with respect to the total gas number density as a function of radius. The chemical models are presented by Gobrecht et al. (2016); only the aluminium-species are shown. Model simulations for a star resembling IK Tau at phase φ = 0.0. |
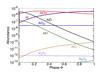 |
Fig. 10 Predicted abundances of aluminium-bearing molecules with respect to the total gas number density as a function of phase φ at 5 R⋆. Chemical models are based on the pulsation-induced shock dynamics presented by Gobrecht et al. (2016) for a star resembling IK Tau; the analogous results at 1 R⋆ are shown in their Fig. 6. |
The deduced AlO, AlOH, and AlCl abundances of IK Tau can be compared directly to the chemical predictions by Gobrecht et al. (2016). They modelled the synthesis of molecules and dust in the inner wind of IK Tau (r < 5 R⋆) by considering the effect of periodic shocks induced by the stellar pulsation. The non-equilibrium chemistry in the shocked gas layers was followed between 1 and 10 R⋆ by solving a chemical kinetic network including 100 species and 424 reactions. The condensation of dust is described by a Brownian formalism using the simplifying assumption that the gaseous dimers of forsterite (Mg2SiO4), enstatite (MgSiO3), and aluminia (Al2O3) are the initial dust seeds and considering coalescence and coagulation of these dimers to form the dust grains.
The aluminium species in the network of Gobrecht et al. (2016) include Al, AlH, AlO, AlOH, AlO2, AlCl, Al2, and Al2O. The aluminium dust precursors are described by Al2O2, Al2O3, and Al4O6. The predicted abundances of the aluminium species as a function of radius and phase φ4 are shown in Figs. 9 and 10, respectively. Al2 and Al2O have very low abundances and therefore do not appear in the plots. The plot in Fig. 9 can be interpreted as a snapshot of the inner wind just after the passage of a shock (at phase φ = 0.0) assuming shock fronts every 0.5 R⋆. A full pulsation cycle corresponds to phase 1.0. Phase 0.0 also corresponds also to a snapshot after a full pulsation cycle. However, at this point, the gas densities have been rescaled from the previous radial position and just have been shocked again at the new radial position (see description in Gobrecht et al. 2016).
For a period of 470 days and with T0 at JD ~ 2 453 025 (Matsumoto et al. 2008), the ALMA data of IK Tau are obtained around φ = 0.98. The method applied by Gobrecht et al. (2016) implies that a relative comparison between the retrieved and predicted molecular abundance stratifications is best carried out using Fig. 9, while the absolute scaling can be seen in Fig. 10. Taking the predicted abundances at 5 R⋆ (Fig. 10) at phase φ = 0.98 as representative values for the comparison with the profiles retrieved from the ALMA data (left panel in Fig. 7), we can see that both the observations and chemical models predict a higher abundance for AlOH than for AlO. However, the retrieved AlOH abundance at 5 R⋆ is 2 orders of magnitudes lower than predicted. The ALMA data indeed show that the fractional AlO abundance (r < 50 R⋆) is very low (<10-10) in accord with the predictions, but remarkably we see that an active Al-chemistry is taking place further out in the wind yielding an increase in AlO emission. We derive a mean AlO fractional abundance of ~5 × 10⁻⁸ between 50–150 R⋆ for IK Tau with the emission mainly arising from clumps at that radial distance. The increase in AlO abundance coincides with a strong decrease in AlOH abundance, suggesting that AlOH is converted to AlO. Another possibility is that desorption or sputtering release AlO from grains back into its gaseous form. If no line blend is blurring the AlCl identification, then the ALMA data show that the AlCl abundance in IK Tau is a factor ~40 higher than predicted.
With an inner dust condensation radius around 2.4 × 1014 cm (or ~120 mas in diameter), the ALMA observations of IK Tau are not sensitive to the potential presence of transparent grains closer to the star and the ALMA beam is too large to confirm the predicted strong radial variation in molecular abundance within 5 R⋆ (as visible in Fig. 9). The stellar angular diameter of R Dor is much larger, θD ~ 57 mas. Although a direct comparison with Figs. 9, 10 should be carried out with care since the shock velocities are expected to be smaller for R Dor, our ALMA data do not corroborate any strong radial variation in AlO and AlOH abundance within the first 10 stellar radii. In addition, the AlCl abundance decreases with radial distance in contrast to the chemical network predictions.
For both targets, the resolution of our ALMA observations allows us to trace the molecular abundances at the smallest radii at which dust has been detected. AlO and AlOH are directly associated with the nucleation of alumina and their retrieved abundances are indeed much lower than in the pure gas-phase models of Gobrecht et al. (2016). But clearly not all available AlO and AlOH molecules participate in that dust formation process. In addition, the ALMA results on R Dor prove that a second phase of dust formation, which is proposed to occur slightly beyond the GBDS, is (almost) not consuming AlO. This supports the scenario suggested by Höfner et al. (2016) that the growth of silicates (potentially on top of already existing alumina grains) is a trigger for the wind to get launched.
It would be of interest to monitor the changes in abundance structure in function of the pulsation phase and confront such changes with the predictions shown in Fig. 10. This kind of data could then be used to benchmark and improve current chemical models that implement gas dynamics. Kamiński et al. (2016) have reported some variability in the AlO emission of the low mass-loss rate Mira star o Ceti, but currently no link with the pulsation cycle is apparent.
Although the current comparison points towards improvements to be made in the chemical model predictions, a conclusion from the ALMA data in combination with these models is that the fraction of aluminium that is locked up in simple aluminium-bearing molecules seems small. That is, the combined fractional abundance of Al-molecules that are thought to form easily in the inner wind region is only ~5 × 10⁻⁸. Furthermore, since the formation of the more complex Al2O3 and its dimer (Al2O3)2 is described by termolecular recombination and hence requires high densities, these higher order molecules also only consume a tiny fraction of the available aluminium (see Fig. 10.
The most difficult gaseous aluminium form to constrain is that of atomic aluminium. The atomic aluminium abundance is predicted to be high when the parcel of material is close to the star (r < 2.5 R⋆) for phases φ > 0.2. Exactly at the shock front, phase φ = 0, the high temperature ensures a high Al abundance, but as a consequence of the declining temperature for later phases the atomic Al abundance decreases rapidly. Beyond 3 R⋆, molecular Al-species are transformed in atomic Al because of the decreasing gas densities with distance from the star. We performed an in-depth study of the high spectral resolution optical Mercator/Hermes (Raskin et al. 2011) data of IK Tau and W Hya (no observations are available for R Dor) to check for the presence of atomic Al in the outer atmosphere/inner wind of both stars. Molecular line veiling complicates the analysis of the data. We could not identify either absorption or emission atomic Al lines. This does not imply that no atomic Al is present, but at least the quantity is too low for it to be detected amongst the molecular lines. An analogous conclusion was drawn by Kamiński et al. (2016) for the low mass-loss rate AGB star o Ceti; thus, they concluded that Al is locked in molecules and dust.
This ensemble of considerations supports the conclusion that only a minor fraction of Al resides in Al-bearing molecules and that the atomic Al abundance is difficult to constrain. An important outcome from these ALMA data is that the aluminium condensation process, considered to be the first condensation cycle to start in AGB stars (Tielens 1990), is for sure not fully efficient since the gaseous precursors of the aluminium grains are detected in and beyond the dust formation region.
3.3. Aluminium depletion into grains
Presolar grains prove that aluminium oxide grains are formed in oxygen-rich AGB stars. The circumstellar Al2O3-grains are relatively abundant in meteorites (Nittler et al. 1997), albeit perhaps not as abundant as one would expect if all aluminium would condense in these grains (Alexander 1997). This result from meteorite studies now gets some support by our analysis of the ALMA data, confirming that a fraction of the aluminium is still present in its gaseous form after its passage through the dust formation region. At least for a few silicate grains, the meteoretic studies show that the aluminium oxides are at the core of the silicate grain suggesting that Al2O3 is the first solid to form in the CSE (Nittler et al. 2008; Vollmer et al. 2006). Both crystalline and amorphous Al2O3 enclosures have been detected (Stroud et al. 2004). The variation in the crystal structure and Ti content of these presolar grains demonstrate that Al2O3 can condense in the absence of TiO2 seed clusters but that Ti may be important in determining the lattice structure.
The SED analysis of R Dor and W Hya turned out to be challenging in terms of the aluminium content (Khouri 2014; Khouri et al. 2015). Based on constraints from gas-phase models and solar abundances, Khouri et al. were unable to model the SEDs of both stars in the spectral region around 11 μm when considering aluminium condensates only to be present in the stellar outflow (see dotted line in Fig. 11). One can fit the broad 11 μm feature in the SED by invoking the presence of a gravitational bound dust shell (GBDS; see Sect. 2.3 for a more detailed explanation on this terminology) of amorphous Al2O3 grains at ~2 R⋆ (see dashed line in Fig. 11). The GBDS can contain both small and large Al2O3 grains. The model for R Dor (W Hya) requires an Al2O3 dust mass in the GBDS of ~5.7 × 10⁻¹⁰M⊙ (~1.5 × 10⁻⁹M⊙), which would correspond to a gas mass of 7.5 × 10⁻⁶M⊙ (2 × 10⁻⁵M⊙) if one would assume full aluminium condensation. Whether this is compliant (or not) with the total aluminium content is difficult to assess since the region where the GBDS resides is known to be highly variable in density due to the stellar pulsations with variations up to one order of magnitude (Höfner et al. 2016).
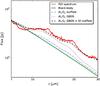 |
Fig. 11 Infrared SED of R Dor. ISO data are shown in red. The black body represents the stellar emission at a temperature of 3000 K, the blue dash-dotted line indicates a model assuming a 100% condensation of aluminium into amorphous Al2O3 that resides in the stellar outflow, the brown dotted line shows the model fit for Al2O3 residing in the GBDS, while the black dashed line represents a model fit for amorphous Al2O3 that is present in the GBDS and silicates in the stellar outflow. |
The GBDS results (Khouri 2014; Khouri et al. 2015), scattered light data (Norris et al. 2012; Khouri et al. 2016; Ohnaka et al. 2016), interferometric results (Zhao-Geisler et al. 2015), and theoretical models (Höfner et al. 2016; Gobrecht et al. 2016) build up evidence for a shell of aluminium oxide grains at 1.5–3 R⋆. The kinetic gas temperature in that region is around 1500–2000 K. Optical constants are measured for amorphous Al2O3 grains, but only for wavelengths beyond 0.2 μm (Koike et al. 1995) or beyond 7.8 μm (Begemann et al. 1997). Depending on the replica used for the short-wavelength range and under the assumption of thermodynamic equilibrium, the estimated temperature of the amorphous alumina grains at that spatial region would be around 1200–1600 K (Khouri et al. 2015). However, amorphous alumina can only exist below 1000 K (Levin et al. 1998; Levin & Brandon 2005). At temperatures around 1500 K, crystalline α-alumina can form, while below 1300 K crystalline γ-alumina can exist. Because the grain temperature in the 1.5–3 R⋆ region is higher than the annealing temperature, this would imply a structural transformation of Al2O3 to its crystalline form. The thermal infrared spectrum of R Dor and W Hya is not compatible with the presence of Al2O3 grains with a crystalline γ-lattice structure (see Fig. 6). As shown in Fig. 6 crystalline α-Al2O3 can indeed explain the 13 μm feature in the SED. A crystallinity degree of 5% can explain the 13 μm feature in W Hya, while for R Dor the estimated crystallinity degree is around 12%. These crystalline grains might be the scattering agents of the polarized light emission.
However, this makes us question how to explain the broad 11 μm feature in the SED of R Dor and W Hya and, in particular, the MIDI data of W Hya, which clearly show that emission arises very close to the star. A potential answer to that question is that the 11 μm feature does not signal the presence of solid-state amorphous aluminium oxide, but – to the contrary – points towards the existence of large neutral gas-phase aluminium oxide clusters (see Sect. 4). Individual (Al2O3)n clusters may exist above 1500 K. Our analysis does not exclude the existence of amorphous aluminium oxides in the wind, but only at larger distances from the star where temperatures are cooler.
4. Discussion: indication for the presence of aluminium oxide clusters
If amorphous alumina dust grains are not the carrier of the MIDI and ISO spectral signature at 11 μm, then the interesting possibility exists that large aluminium oxide clusters are present, and detected, just above the stellar surface. Indeed, an outcome of the experimental IR-REMPI studies by van Heijnsbergen et al. (2003) is that large AlO·(Al2O3)n clusters (n > 34) exhibit a spectral signature that is very similar to that of amorphous Al2O3, while smaller AlO·(Al2O3)n clusters (around n = 15) show the best match with that of crystalline γ-Al2O3 (see Fig. 12). Because of the non-linear regime in which the IR-REMPI results are obtained, one cannot however estimate the amount of clusters present in the beam. This renders the impossibility of quantifying the amount of large aluminium oxide clusters that would be needed to explain the 11 μm feature.
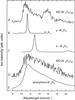 |
Fig. 12 Comparison of gas-phase vibrational spectra for AlO·(Al2O3)n with n = 28 (A) and for n = 53 (D) to the infrared absorption spectra of bulk aluminium oxide lattices (B = crystalline γ-Al2O3; C = crystalline α-Al2O3; E = amorphous Al2O3). This result is obtained by van Heijnsbergen et al. (2003). |
If the 11 μm feature indicates the presence of large (n > 34) aluminium oxide clusters, then one should wonder if smaller clusters are present as well and if they can be detected. The experiments by van Heijnsbergen et al. (2003) and Demyk et al. (2004) show that clusters with n = 15–40 show two vibrational bands: one around 11.8 μm and another one around 15 μm. Comparing this to the emission features of solid-state aluminium oxide lattices identifies these gas-phase clusters as having a structure similar to crystalline γ-Al2O3 instead of α-Al2O3(corundum), which is the thermodynamically most stable form of the bulk (see Fig. 12). The infrared observations of W Hya and R Dor do not display an obvious emission component around 15 μm. This does not imply by necessity that these n = 15–40 sized clusters are not present, but at least they are not abundant enough to leave any spectral imprint.
A variety of processes including dust production in type II supernovae and AGB stars, dust destruction by supernova shocks, grain growth, and grain-grain collisions determine the grain size distribution in the interstellar medium of galaxies (Asano et al. 2013). Shattering is crucial in producing small grains (≲0.01 μm). The size distribution of interstellar dust grains in our Milky Way is dominated by small particles, i.e. nd(a) da ∝ a− 7/2 da (Mathis et al. 1977). Also in our own Earth’s atmosphere, fresh aerosols that are created in situ from the gas phase by nucleation display a number distribution heavily skewed towards the very small particles (Seinfeld et al. 1998). It is therefore interesting to look for the presence of very small clusters in AGB winds. Current capacities in quantum chemical computations give us the possibility to test this proposition on the prevailing presence of very small clusters; see next section.
4.1. Emission of very small (Al2O3)n (n ≤ 4) aluminium oxide clusters
A way to test if very small Al2O3 polymers are present is via the detection of their vibrational frequencies. These bands arise owing to the presence of internal bending and stretching modes in the cluster. As the energy and geometry, the vibrational spectrum differs from isomer to isomer and thus can be seen as a spectral fingerprint.
Several theoretical and experimental studies on the structure and spectroscopy of small alumina clusters have been performed. Demyk et al. (2004) and Sierka et al. (2007) measured the IR-REMPI spectra of laboratory-produced AlO·(Al2O3)n clusters down to n = 7, whereas Li & Cheng (2012) provided structures for a selection of alumina clusters obtained from density functional theory (DFT) calculations. Because there is no way to currently predict the most likely cluster composition in the outflow and because these clusters would probably cover a wide range in both stoichiometry and atomic sizes, we took the simple approach of calculating the spectral properties of a range of stoichiometric alumina clusters to estimate where observable lines might exist. For n = 1–4 we determined the most stable structures of the neutral aluminium oxide clusters using DFT; see Fig. 13. The computations were accomplished by the GAUSSIAN 09 package (Frisch et al. 2009) using the hybrid B3LYP (Becke, three parameter, Lee-Yang-Parr; Lee et al. 1988; Miehlich et al. 1989; Becke 1993) exchange-correlation functional with a 6-311+g∗ basis set. The binding energy and stability of electronic systems including clusters are pressure and temperature-dependent, respectively. Variations in temperature and density imply that the energy levels of the clusters may shift and that the order of the most stable clusters may change. We calculated how the stability5 of the considered small alumina clusters is affected in various ways for conditions occurring in the CSE (with pressure p = 0.001–50 Pa and temperature T = 500–3000 K). For Al2O3, the first excited structural isomer is a linear chain and has a potential energy 0.1 eV above the kite-shaped triplet ground state. The linear form is slightly more stable above 1000 K and the kite-shaped triplet structure is favoured below 1000 K. Considering (Al2O3)2, the energy difference of the ground state to the first excited state is relatively large (0.48 eV) and therefore structure 2A (see Fig. 1 in Li & Cheng 2012) is also the most stable in circumstellar conditions. For n = 3, we find five stable structures in an energy interval of only 0.13 eV for the alumina trimer. In circumstellar conditions, however, the first excited state 3B (Li & Cheng 2012) is the most stable configuration. For a temperature of 1500 K, the ground and first excited state of (Al2O3)4 are almost identical in potential energy. Below 1500 K isomer 4A is favoured, above 1500 K structure 4B (Li & Cheng 2012), which is only stable for pressures above 0.1 Pa. Overall, the Gibbs free energy of formation for alumina clusters depends significantly on T, but not much on density or pressure.
For each of the optimized structures, the vibrational spectrum of the ground-state clusters was calculated (see Fig. 13). The predicted spectra compare well with the experimental results by Demyk et al. (2004) and the calculated linear infrared absorption spectra by Sierka et al. (2007) for small cluster sizes (see Fig. 14), with the strongest peaks in the 10–11 μm region and an ensemble of smaller peaks around 14 μm. Implementing the stable clusters in thermo-chemistry calculations for densities down to 1 × 10⁻⁴ dyne cm-2 (Höfner et al. 2016) and temperatures up to 1800 K and allowing the small clusters to grow via monomer addition indicates that (Al2O3)3 seems to be the best candidate for possible detection in CSEs (see Table 4).
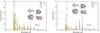 |
Fig. 13 Vibrational spectrum of the (Al2O3)n, n = 1–4, ground-state clusters and their corresponding structures. The structures (for n = 1–4) are depicted with increasing n from left to right and from top to bottom. The black line represents a Lorentzian distribution with HWHM parameter γ = 0.2 for all peaks. The left panel shows the intensity in units of km/mole; the right panel the opacity in units of cm2/g. |
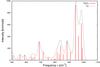 |
Fig. 14 Intensity of the (Al2O3)4 ground-state cluster vs. frequency convoluted with a Lorentzian function with FWHM of 24 cm-1. To be compared with Fig. 2d in Sierka et al. (2007). |
Overview of the aluminia nucleation by monomer (Al2O3) addition at different temperatures T (in K) and pressures p (in dyne cm-2).
We tested whether the spectral features present in the infrared SED of R Dor and W Hya could be explained by the vibrational frequencies of these small aluminium oxide clusters (see Fig. 15). However, the low spectral resolution (around 300) of the ISO/SWS speed 1 data for both stars makes it impossible to draw any firm conclusions. Albeit a positive correlation can be noticed between various absorption peaks in the ISO data and the predicted cluster spectra, we caution against over-interpretation of these results. Specifically, molecular line veiling by other molecules, which might be present in the extra-molecular layer created by pulsation-induced density enhancements, result in an ensemble of emission and absorption features that complicates any potential identification. High spectral resolution data in the 10–20 μm regime (as might be obtained in the future using the E-ELT/METIS instrument) are paramount to answer the question on the potential presence and vibrational excitation of these small aluminium oxide clusters.
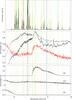 |
Fig. 15 Top panel: normalized opacity of the (Al2O3)n clusters convoluted with a Lorentzian profile with a FWHM of 0.03 μm. The full coloured lines represent the opacities normalized for each cluster entity separately (with the same colour coding as in Fig. 13), while the dotted coloured lines indicate the wavelength position of all ground-state vibrational frequencies of the stable (Al2O3)n (n = 1−4) clusters. Middle panel: comparison between the (stellar continuum subtracted and normalized) SED of R Dor (full black line) and W Hya (full gray line) with the predicted vibrational frequencies of the stable (Al2O3)n (n = 1−4) clusters (vertical coloured lines). The gray areas indicate the region with some of the largest (Al2O3)n opacities. The dashed gray lines indicate the CO2 lines as discussed by Justtanont et al. (2004). The full red line represents the (stellar continuum subtracted and normalized) emission for a slab model containing H2O, SiO, and SiS. The column densities for all species were taken to be 1 × 1020 cm-2 at 0.5R⋆ above the stellar surface for a temperature of 2000 K. The individual contributions of H2O, SiO, and SiS are shown in the bottom panel. The column densities of the molecules were not chosen to fit the ISO/SWS data, but serve as illustrative examples on the molecular line veiling. |
4.2. Skewed cluster-size distribution
The more pronounced evidence of large (n > 34) (Al2O3)n clusters warrants a discussion on the possibility of whether a physico-chemical situation might occur resulting in a skewed cluster-size distribution towards large cluster sizes. Clusters can grow via two direct pathways, i.e. by adding monomers and by sticking together after a collision. Since the number of seeds is low, the chance of colliding with monomers is higher than of collision with larger polymers, so the first pathway seems to be preferred. The region around 2 R⋆ coincides with the GBDS, i.e. a higher density region where species can stay longer without being pushed outwards. This might create a favourable condition for clusters to grow to large sizes. These large aluminium oxides can be very stable at high temperatures because of their ability to undergo thermo-ionic emission rather than dissociation (Demyk et al. 2004). That is, the clusters preferentially emit an electron, which is a unique property that is only observed for very strongly bound species. This ability might also greatly enhance the growth efficiencies of the clusters, since the transient complex that is formed during the growth reaction process might also stabilize via the emission of an electron.
Growth by adding monomers is hence a potential process for the creation of larger clusters, with a preference for specific cluster sizes initiating coagulation. Energy considerations in this highly turbulent region just above the stellar atmosphere should be taken into account to answer the question regarding the favourable cluster size for coagulation. There are no calculations, including the whole spectrum from small to large aluminium oxide clusters, currently available to answer this question. Generally, the alumina clusters (including the very small clusters) show an ionic character with alternating Al−O bondings. Moreover, some of the low-lying small clusters exhibit a trigonal symmetry (like bulk-corundum). One thus expects that the coagulation might start at rather small cluster sizes (n = 3,4). Our calculations including only the n = 1−4 (Al2O3)n clusters indeed show a preference for the n = 3 cluster size. A similar behaviour is noted for (SiO)n for which the matrix isolation experiment by Stranz (1980) shows that SiO monomers, dimers, and trimers can be seen, but then the material seems to transition to the bulk phase. If coagulation were to commence from small cluster sizes, then we would not expect to see (much) large clusters, but we assume that these are in fact present, as indicated by the observed 11 μm spectral feature.
Large clusters could, however, be formed by alternative pathways. One possibility is the formation of large clusters by surface processes; i.e. a heterogeneous nucleation process during which large clusters are formed on the surface of existing grains and subsequently ejected. Nozzle experiments show that a substantial quantity of large metal clusters can be formed and ejected that way (Knauer 1987). The NACO and SPHERE data prove that grains (of still unknown composition) are ubiquitous close to the star. These grains might serve as surfaces for cluster growth to occur. Vapourization of solid material might offer another explication for a skewed cluster-size distribution towards large sizes. The Al2O3 grain temperatures in the region around 2 R⋆ are high (Sect. 3.3) and might lead to the crystallization of the bulk material. If energetically favourable, the material might also get partly vapourized, thereby producing large clusters. This kind of behaviour is noted during formation kinetics experiments and computer simulations for the nucleation and growth rates of metal vapours (Yamada et al. 1987). The recent SPHERE data of Khouri et al. (2016) show that the solid-state material is grouped into irregular, clumpy structures. Backwarming occurring between the dust clumps and the star might locally increase the temperature (Fleischer et al. 1995), favouring vapourization to take place.
5. Conclusions
In this paper we have studied the aluminium content in a low and a high mass-loss rate oxygen-rich AGB star, R Dor and IK Tau, respectively. The aim was to reveal the role of aluminium species in the initiation of the stellar wind. We therefore observed both stars with ALMA at high spatial resolution (~150 mas) to trace the dust formation region via aluminium bearing molecules (AlO, AlOH, and AlCl). The azimuthally averaged flux densities in function of the angular distance from the central star were fitted using a non-LTE radiative transfer code to retrieve the fractional abundances of the molecules. The gas-phase aluminium chemistry is largely different for both stars, in particular the AlO and AlOH fractional abundances. In IK Tau AlOH is clearly detected, while traces of clumpy structures containing AlO are only apparent beyond 50 R⋆. In contrast, AlO is ~70 times more abundant than AlOH in R Dor. These three molecules consume only ≲2% of the total aluminium budget. Hence, there is ample opportunity to form aluminium-bearing dust species. AlO and AlOH are direct precursors of these aluminium-bearing grains and both molecules are detected well beyond the dust condensation radius. This implies that the aluminium dust condensation cycle is not fully efficient.
To assess the aluminium dust content in oxygen-rich AGB stars, we also included the well-studied low mass-loss rate star W Hya. We discuss how the spectral features present in the SED, polarized light signal, and interferometric data point towards the presence of a halo of large (and small) transparent grains close the star. A candidate species for these grains is amorphous Al2O3. However, at a distance of only 1.5 R⋆ the estimated grain temperature is >1000 K, i.e. too high for the grains to retain their amorphous lattice structure. The grains should anneal and form a crystalline compound. Indeed, the typical 13 μm features signalling the presence of crystalline Al2O3(α-Al2O3) is seen in the SEDs of W Hya and R Dor. One is then left with the question how to explain the broad 11 μm feature in the SED and interferometric data. On the basis of the experimental work by van Heijnsbergen et al. (2003) and Demyk et al. (2004), we propose that large gas-phase (Al2O3)n clusters (n > 34) are the species that produce the signatures seen in the SED and interferometric data. Using density functional theory (DFT) we calculate the stability and emissivity of very small (Al2O3)n clusters (for n = 1−4). Although we cannot draw firm conclusions on the presence of such small clusters in AGB winds, we notice a positive correlation between various absorption peaks in the ISO data and our predicted spectra. Future E-ELT/METIS observations will be crucial to answer the question of whether very small clusters (n ≲ 4) are present in the inner winds of AGB stars.
This differentiation does not mean that no silicates are present in low mass-loss rate stars. Their presence might stay unnoticed in the spectral energy distribution (SED) owing to, for instance, their glassy character.
The pulsation phase is defined as the decimal part of (t−T0) /P, where T0 is the epoch of the start of the pulsation cycle and P is the period.
This value is calculated from the Gibbs free energy. The entropy is given by the partition function (with contributions from electronic, translational, vibrational, and vibrational motion) of which the translational part depends on the pressure.
Acknowledgments
L.D. acknowledges support from the ERC consolidator grant 646758 AEROSOL and the FWO Research Project grant G024112N. We acknowledge the CINECA award under the ISCRA initiative for the availability of high performance computing resources and support. This paper makes use of the following ALMA data: ADS/JAO.ALMA2013.0.00166.S. ALMA is a partnership of ESO (representing its member states), NSF (USA) and NINS (Japan), together with NRC (Canada) and NSC and ASIAA (Taiwan), in cooperation with the Republic of Chile. The Joint ALMA Observatory is operated by ESO, AUI/NRAO, and NAOJ. We thank Willem Jan de Wit for his contribution to the reduction of the VLTI/MIDI data of R Dor. We acknowledge with thanks the variable star observations from the AAVSO International Database contributed by observers worldwide. Based on observations obtained with the HERMES spectrograph, which is supported by the Research Foundation – Flanders (FWO), Belgium, the Research Council of KU Leuven, Belgium, the Fonds National de la Recherche Scientifique (F.R.S.-FNRS), Belgium, the Royal Observatory of Belgium, the Observatoire de Genève, Switzerland, and the Thüringer Landessternwarte Tautenburg, Germany.
References
- Alexander, C. M. O. 1997, in AIP Conf. Ser., eds. E. K. Zinner, & T. J. Bernatowicz, 402, 567 [Google Scholar]
- Asano, R. S., Takeuchi, T. T., Hirashita, H., & Nozawa, T. 2013, MNRAS, 432, 637 [NASA ADS] [CrossRef] [Google Scholar]
- Banerjee, D. P. K., Varricatt, W. P., Mathew, B., Launila, O., & Ashok, N. M. 2012, ApJ, 753, L20 [NASA ADS] [CrossRef] [Google Scholar]
- Becke, A. D. 1993, J. Chem. Phys., 98, 5648 [NASA ADS] [CrossRef] [Google Scholar]
- Bedding, T. R., Zijlstra, A. A., von der Luhe, O., et al. 1997, MNRAS, 286, 957 [NASA ADS] [CrossRef] [Google Scholar]
- Bedding, T. R., Zijlstra, A. A., Jones, A., & Foster, G. 1998, MNRAS, 301, 1073 [NASA ADS] [CrossRef] [Google Scholar]
- Begemann, B., Dorschner, J., Henning, T., et al. 1997, ApJ, 476, 199 [NASA ADS] [CrossRef] [Google Scholar]
- Bowen, G. H. 1988, ApJ, 329, 299 [NASA ADS] [CrossRef] [Google Scholar]
- Cherchneff, I. 2006, A&A, 456, 1001 [NASA ADS] [CrossRef] [EDP Sciences] [Google Scholar]
- Dayou, F., & Balança, C. 2006, A&A, 459, 297 [NASA ADS] [CrossRef] [EDP Sciences] [Google Scholar]
- De Beck, E., Kamiński, T., Patel, N. A., et al. 2013, A&A, 558, A132 [NASA ADS] [CrossRef] [EDP Sciences] [Google Scholar]
- De Beck, E., Kamiński, T., Menten, K. M., et al. 2015, in Why Galaxies Care about AGB Stars III: A Closer Look in Space and Time, eds. F. Kerschbaum, R. F. Wing, & J. Hron, ASP Conf. Ser., 497, 73 [Google Scholar]
- De Beck, E., Decin, L., Ramstedt, S., et al. 2017, A&A, 598, A53 [NASA ADS] [CrossRef] [EDP Sciences] [Google Scholar]
- de Vries, B. L., Min, M., Waters, L. B. F. M., Blommaert, J. A. D. L., & Kemper, F. 2010, A&A, 516, A86 [NASA ADS] [CrossRef] [EDP Sciences] [Google Scholar]
- Decin, L., Hony, S., de Koter, A., et al. 2006, A&A, 456, 549 [NASA ADS] [CrossRef] [EDP Sciences] [Google Scholar]
- Decin, L., De Beck, E., Brünken, S., et al. 2010a, A&A, 516, A69 [NASA ADS] [CrossRef] [EDP Sciences] [Google Scholar]
- Decin, L., Justtanont, K., De Beck, E., et al. 2010b, A&A, 521, L4 [Google Scholar]
- Demyk, K., van Heijnsbergen, D., von Helden, G., & Meijer, G. 2004, A&A, 420, 547 [NASA ADS] [CrossRef] [EDP Sciences] [Google Scholar]
- Duari, D., Cherchneff, I., & Willacy, K. 1999, A&A, 341, L47 [NASA ADS] [Google Scholar]
- Fleischer, A. J., Gauger, A., & Sedlmayr, E. 1995, A&A, 297, 543 [NASA ADS] [Google Scholar]
- Freytag, B., Liljegren, S., & Höfner, S. 2017, A&A, 600, A137 [NASA ADS] [CrossRef] [EDP Sciences] [Google Scholar]
- Frisch, M. J., Trucks, G. W., Schlegel, H. B., Scuseria, G. E., & Robb, M. A., et al. 2009, Gaussian 09 Revision D.01 (Wallingford, CT: Gaussian Inc.) [Google Scholar]
- Gail, H.-P., & Sedlmayr, E. 1999, A&A, 347, 594 [NASA ADS] [Google Scholar]
- Gail, H.-P., Wetzel, S., Pucci, A., & Tamanai, A. 2013, A&A, 555, A119 [NASA ADS] [CrossRef] [EDP Sciences] [Google Scholar]
- Gobrecht, D., Cherchneff, I., Sarangi, A., Plane, J. M. C., & Bromley, S. T. 2016, A&A, 585, A6 [NASA ADS] [CrossRef] [EDP Sciences] [Google Scholar]
- Goumans, T., & Bromley, S. T. 2012, MNRAS, 420, 3344 [NASA ADS] [Google Scholar]
- Green, S., & Thaddeus, P. 1974, ApJ, 191, 653 [NASA ADS] [CrossRef] [Google Scholar]
- Groenewegen, M. A. T. 1994, A&A, 290, 531 [NASA ADS] [Google Scholar]
- Habing, H. J., & Olofsson, H., eds. 2003, Asymptotic Giant Branch Stars (New York, Berlin: Springer) [Google Scholar]
- Heras, A. M., & Hony, S. 2005, A&A, 439, 171 [NASA ADS] [CrossRef] [EDP Sciences] [Google Scholar]
- Höfner, S. 2008, A&A, 491, L1 [NASA ADS] [CrossRef] [EDP Sciences] [Google Scholar]
- Höfner, S., & Andersen, A. C. 2007, A&A, 465, L39 [NASA ADS] [CrossRef] [EDP Sciences] [Google Scholar]
- Höfner, S., Bladh, S., Aringer, B., & Ahuja, R. 2016, A&A, 594, A108 [NASA ADS] [CrossRef] [EDP Sciences] [Google Scholar]
- Ireland, M. J., Tuthill, P. G., Bedding, T. R., Robertson, J. G., & Jacob, A. P. 2004, MNRAS, 350, 365 [NASA ADS] [CrossRef] [Google Scholar]
- Jeong, K. S., Winters, J. M., Le Bertre, T., & Sedlmayr, E. 2003, A&A, 407, 191 [NASA ADS] [CrossRef] [EDP Sciences] [Google Scholar]
- Justtanont, K., Skinner, C. J., & Tielens, A. G. G. M. 1994, ApJ, 435, 852 [NASA ADS] [CrossRef] [Google Scholar]
- Justtanont, K., Feuchtgruber, H., de Jong, T., et al. 1998, A&A, 330, L17 [NASA ADS] [Google Scholar]
- Justtanont, K., de Jong, T., Tielens, A. G. G. M., Feuchtgruber, H., & Waters, L. B. F. M. 2004, A&A, 417, 625 [NASA ADS] [CrossRef] [EDP Sciences] [Google Scholar]
- Kamiński, T., Wong, K. T., Schmidt, M. R., et al. 2016, A&A, 592, A42 [NASA ADS] [CrossRef] [EDP Sciences] [Google Scholar]
- Kamiński, T., Müller, H. S. P., Schmidt, M. R., et al. 2017, A&A, 599, A59 [NASA ADS] [CrossRef] [EDP Sciences] [Google Scholar]
- Karovicova, I., Wittkowski, M., Ohnaka, K., et al. 2013, A&A, 560, A75 [NASA ADS] [CrossRef] [EDP Sciences] [Google Scholar]
- Khouri, T. 2014, Ph.D. Thesis, University of Amsterdam [Google Scholar]
- Khouri, T., de Koter, A., Decin, L., et al. 2014a, A&A, 561, A5 [NASA ADS] [CrossRef] [EDP Sciences] [Google Scholar]
- Khouri, T., de Koter, A., Decin, L., et al. 2014b, A&A, 570, A67 [NASA ADS] [CrossRef] [EDP Sciences] [Google Scholar]
- Khouri, T., Waters, L. B. F. M., de Koter, A., et al. 2015, A&A, 577, A114 [NASA ADS] [CrossRef] [EDP Sciences] [Google Scholar]
- Khouri, T., Maercker, M., Waters, L. B. F. M., et al. 2016, A&A, 591, A70 [NASA ADS] [CrossRef] [EDP Sciences] [Google Scholar]
- Kim, H., Wyrowski, F., Menten, K. M., & Decin, L. 2010, A&A, 516, A68 [NASA ADS] [CrossRef] [EDP Sciences] [Google Scholar]
- Knapp, G. R., Pourbaix, D., Platais, I., & Jorissen, A. 2003, A&A, 403, 993 [NASA ADS] [CrossRef] [EDP Sciences] [Google Scholar]
- Knauer, W. 1987, J. Appl. Phys., 62, 841 [NASA ADS] [CrossRef] [Google Scholar]
- Koike, C., Kaito, C., Yamamoto, T., et al. 1995, Icarus, 114, 203 [NASA ADS] [CrossRef] [Google Scholar]
- Lee, C., Yang, W., & Parr, R. G. 1988, Phys. Status Solidi: Appl. Res., 37, 785 [Google Scholar]
- Levin, I., & Brandon, D. G. 2005, J. Am. Ceram. Soc., 81, 1995 [CrossRef] [Google Scholar]
- Levin, I., Gemming, T., & Brandon, D. G. 1998, Phys. Status Solidi: Appl. Res., 166, 197 [NASA ADS] [CrossRef] [Google Scholar]
- Li, R., & Cheng, L. 2012, Comp. Theor. Chem., 996, 125 [CrossRef] [Google Scholar]
- Maercker, M., Schöier, F. L., Olofsson, H., Bergman, P., & Ramstedt, S. 2008, A&A, 479, 779 [NASA ADS] [CrossRef] [EDP Sciences] [Google Scholar]
- Maercker, M., Danilovich, T., Olofsson, H., et al. 2016, A&A, 591, A44 [Google Scholar]
- Mathis, J. S., Rumpl, W., & Nordsieck, K. H. 1977, ApJ, 217, 425 [NASA ADS] [CrossRef] [Google Scholar]
- Matsumoto, N., Omodaka, T., Imai, H., et al. 2008, PASJ, 60, 1039 [NASA ADS] [Google Scholar]
- Miehlich, B., Savin, A., Stoll, H., & Preuss, H. 1989, Chem. Phys. Lett., 157, 200 [NASA ADS] [CrossRef] [Google Scholar]
- Milam, S. N., Apponi, A. J., Woolf, N. J., & Ziurys, L. M. 2007, ApJ, 668, L131 [NASA ADS] [CrossRef] [Google Scholar]
- Müller, H. S. P., Thorwirth, S., Roth, D. A., & Winnewisser, G. 2001, A&A, 370, L49 [NASA ADS] [CrossRef] [EDP Sciences] [Google Scholar]
- Müller, H. S. P., Schlöder, F., Stutzki, J., & Winnewisser, G. 2005, J. Mol. Struct., 742, 215 [NASA ADS] [CrossRef] [Google Scholar]
- Nittler, L. R., Alexander, O., Gao, X., Walker, R. M., & Zinner, E. 1997, ApJ, 483, 475 [NASA ADS] [CrossRef] [Google Scholar]
- Nittler, L. R., Alexander, C. M. O., Gallino, R., et al. 2008, ApJ, 682, 1450 [NASA ADS] [CrossRef] [Google Scholar]
- Norris, B. R. M., Tuthill, P. G., Ireland, M. J., et al. 2012, Nature, 484, 220 [NASA ADS] [CrossRef] [PubMed] [Google Scholar]
- Nuth, III, J. A., & Ferguson, F. T. 2006, ApJ, 649, 1178 [NASA ADS] [CrossRef] [Google Scholar]
- Ohnaka, K., Bergeat, J., Driebe, T., et al. 2005, A&A, 429, 1057 [NASA ADS] [CrossRef] [EDP Sciences] [Google Scholar]
- Ohnaka, K., Weigelt, G., & Hofmann, K.-H. 2016, A&A, 589, A91 [NASA ADS] [CrossRef] [EDP Sciences] [Google Scholar]
- Raskin, G., van Winckel, H., Hensberge, H., et al. 2011, A&A, 526, A69 [NASA ADS] [CrossRef] [EDP Sciences] [Google Scholar]
- Ryde, N., Eriksson, K., & Gustafsson, B. 1999, A&A, 341, 579 [NASA ADS] [Google Scholar]
- Sacuto, S., Ramstedt, S., Höfner, S., et al. 2013, A&A, 551, A72 [NASA ADS] [CrossRef] [EDP Sciences] [Google Scholar]
- Schick, H. L. 1960, Chem. Rev., 60, 331 [CrossRef] [Google Scholar]
- Schöier, F. L., Olofsson, H., Wong, T., Lindqvist, M., & Kerschbaum, F. 2004, A&A, 422, 651 [NASA ADS] [CrossRef] [EDP Sciences] [Google Scholar]
- Schöier, F. L., van der Tak, F. F. S., van Dishoeck, E. F., & Black, J. H. 2005, A&A, 432, 369 [NASA ADS] [CrossRef] [EDP Sciences] [Google Scholar]
- Seinfeld, J. H., Pandis, S. N., & Noone, K. 1998, Phys. Today, 51, 88 [CrossRef] [Google Scholar]
- Sierka, M., Döbler, J., Sauer, J., et al. 2007, Angew. Chem. Int. Ed., 46, 3372 [CrossRef] [Google Scholar]
- Stranz, D. D. 1980, Ph.D. Thesis, Maryland University, College Park [Google Scholar]
- Stroud, R. M., Nittler, L. R., & Alexander, C. M. O. 2004, Science, 305, 1455 [NASA ADS] [CrossRef] [PubMed] [Google Scholar]
- Takigawa, A., Kamizuka, T., Tachibana, S., & Yamamura, I. 2016, LPI Contributions, 1921, 6543 [NASA ADS] [Google Scholar]
- Tenenbaum, E. D., & Ziurys, L. M. 2009, ApJ, 694, L59 [NASA ADS] [CrossRef] [Google Scholar]
- Tenenbaum, E. D., & Ziurys, L. M. 2010, ApJ, 712, L93 [NASA ADS] [CrossRef] [Google Scholar]
- Tielens, A. G. G. M. 1990, in From Miras to Planetary Nebulae: Which Path for Stellar Evolution? eds. M. O. Mennessier, & A. Omont, 186 [Google Scholar]
- Tsuji, T. 2000, ApJ, 540, L99 [NASA ADS] [CrossRef] [Google Scholar]
- Turner, B. E., Chan, K.-W., Green, S., & Lubowich, D. A. 1992, ApJ, 399, 114 [NASA ADS] [CrossRef] [Google Scholar]
- Uttenthaler, S., van Stiphout, K., Voet, K., et al. 2011, A&A, 531, A88 [NASA ADS] [CrossRef] [EDP Sciences] [Google Scholar]
- Van de Sande, M., Decin, L., Lombaert, R., et al. 2017, A&A, in press, DOI: 10.1051/0004-6361/201731298 [Google Scholar]
- van Heijnsbergen, D., Demyk, K., Duncan, M. A., Meijer, G., & von Helden, G. 2003, Phys. Chem. Chem. Phys., 5, 2515 [Google Scholar]
- Velilla Prieto, L., Sánchez Contreras, C., Cernicharo, J., et al. 2017, A&A, 597, A25 [NASA ADS] [CrossRef] [EDP Sciences] [Google Scholar]
- Vollmer, C., Hoppe, P., Brenker, F., & Palme, H. 2006, in Lunar and Planetary Science Conference, 37, eds. S. Mackwell, & E. Stansbery [Google Scholar]
- Willacy, K., & Cherchneff, I. 1998, A&A, 330, 676 [NASA ADS] [Google Scholar]
- Wing, R. F., & Lockwood, G. W. 1973, ApJ, 184, 873 [NASA ADS] [CrossRef] [Google Scholar]
- Wittkowski, M., Boboltz, D. A., Ohnaka, K., Driebe, T., & Scholz, M. 2007, A&A, 470, 191 [NASA ADS] [CrossRef] [EDP Sciences] [Google Scholar]
- Yamada, I., Usui, H., & Takagi, T. 1987, J. Phys. Chem., 91, 2463 [CrossRef] [Google Scholar]
- Zhao-Geisler, R., Quirrenbach, A., Köhler, R., Lopez, B., & Leinert, C. 2011, A&A, 530, A120 [NASA ADS] [CrossRef] [EDP Sciences] [Google Scholar]
- Zhao-Geisler, R., Quirrenbach, A., Köhler, R., & Lopez, B. 2012, A&A, 545, A56 [NASA ADS] [CrossRef] [EDP Sciences] [Google Scholar]
- Zhao-Geisler, R., Köhler, R., Kemper, F., et al. 2015, PASP, 127, 732 [NASA ADS] [CrossRef] [Google Scholar]
Appendix A: Additional ALMA channel maps in AlO, AlOH, and AlCl for IK Tau and R Dor
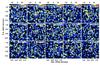 |
Fig. A.1 Channel maps (colour scale in mJy) of the AlO N = 9−8 transition in IK Tau. White contours indicate the continuum at (−1, 1, 4, 16, 64, 256) × 0.3 mJy. The ordinate and co-ordinate axis give the offset of the right ascension and declination, respectively, in units of arcseconds. The ALMA beam size is shown in the bottom left corner of the top panel. |
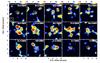 |
Fig. A.2 Same as for Fig. A.1, but the AlO emission in the wind of IK Tau is averaged over 5 channels and smoothed with 0.̋5 Gaussian kernel. |
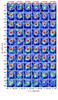 |
Fig. A.4 Channel maps (colour scale in mJy) of the AlO N = 9–8 transition in R Dor, zooming in the inner 0.̋2 region. White contours are the continuum at (−1, 1, 4, 16, 64, 256) × 0.15 mJy. The ordinate and co-ordinate axis give the offset of the right ascension and declination, respectively, in units of arcseconds. The ALMA beam size is shown in the bottom left corner of the top panel. |
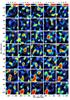 |
Fig. A.6 Same as for Fig. A.4, but zooming into the AlOH emission in the inner 0.̋2 region in the wind of R Dor. |
All Tables
Spectral properties of AlO, AlOH, and AlCl as observed with ALMA in IK Tau (top part of the table) and R Dor (bottom part).
Overview of the aluminia nucleation by monomer (Al2O3) addition at different temperatures T (in K) and pressures p (in dyne cm-2).
All Figures
|
Fig. 1 ALMA AlO, AlOH, and AlCl data extracted for an aperture size of 320 mas (300 mas) and 800 mas (1000 mas) for IK Tau (R Dor). The frequency range is shifted to rest frequency using a local standard of rest velocity, vLSR, of 35 km s-1 for IK Tau and of 7 km s-1 for R Dor. Close to the AlOH emission, NS |
| In the text | |
|
Fig. 2 Channel maps (colour scale in mJy) of the AlOH J = 11–10 transition in IK Tau. White contours are the continuum at (−1, 1, 4, 16, 64, 256) × 0.3 mJy. The ordinate and co-ordinate axis give the offset of the right ascension and declination, respectively, in units of arcseconds. The ALMA beam size is shown in the bottom left corner of the top panel. |
| In the text | |
|
Fig. 3 Channel maps (colour scale in mJy) of the AlO N = 9–8 transition in R Dor. White contours are the continuum at (−1, 1, 4, 16, 64, 256) × 0.15 mJy. The ordinate and co-ordinate axis give the offset of the right ascension and declination, respectively, in units of arcseconds. The ALMA beam size is shown in the bottom left corner of the top panel. |
| In the text | |
|
Fig. 4 Azimuthally averaged flux density in function of the angular distance from the central star for IK Tau (top) and R Dor (bottom), respectively. The ALMA data are shown in red with the vertical bars denoting the uncertainty. The radiative transfer model predictions are shown in blue (see Sect. 3.1). |
| In the text | |
|
Fig. 5 Infrared spectrum of R Dor (black, full line), W Hya (gray, full line, scaled with a factor 1.5), and IK Tau (red, dashed line). Spectral features arising from dust species such as crystalline and amorphous Al2O3, gehlenite (Ca2Al2SiO7), and so-called astronomical silicates (amorphous olivines with different relative magnesium and iron fractions; de Vries et al. 2010) are indicated. |
| In the text | |
|
Fig. 6 Continuum subtracted and normalized SED of R Dor and W Hya (in full black and gray lines, respectively). Characteristic (scaled) emission patterns of different dust species are shown in the coloured dashed lines. The gray vertical dotted lines indicate CO2 molecular emission (Justtanont et al. 1998; Ryde et al. 1999). |
| In the text | |
|
Fig. 7 Retrieved fractional abundance structure [AlO/H2], [AlOH/H2], and [AlCl/H2] for IK Tau (left) and R Dor (right). |
| In the text | |
|
Fig. 8 Comparison between the extracted ALMA AlO spectra of R Dor (green) and the predicted line profile (red) for an AlO abundance structure as given in Fig. 7 for the 300 mas (left) and 1000 mas (right) extraction aperture. |
| In the text | |
|
Fig. 9 Predicted abundances of aluminium-bearing molecules with respect to the total gas number density as a function of radius. The chemical models are presented by Gobrecht et al. (2016); only the aluminium-species are shown. Model simulations for a star resembling IK Tau at phase φ = 0.0. |
| In the text | |
|
Fig. 10 Predicted abundances of aluminium-bearing molecules with respect to the total gas number density as a function of phase φ at 5 R⋆. Chemical models are based on the pulsation-induced shock dynamics presented by Gobrecht et al. (2016) for a star resembling IK Tau; the analogous results at 1 R⋆ are shown in their Fig. 6. |
| In the text | |
|
Fig. 11 Infrared SED of R Dor. ISO data are shown in red. The black body represents the stellar emission at a temperature of 3000 K, the blue dash-dotted line indicates a model assuming a 100% condensation of aluminium into amorphous Al2O3 that resides in the stellar outflow, the brown dotted line shows the model fit for Al2O3 residing in the GBDS, while the black dashed line represents a model fit for amorphous Al2O3 that is present in the GBDS and silicates in the stellar outflow. |
| In the text | |
|
Fig. 12 Comparison of gas-phase vibrational spectra for AlO·(Al2O3)n with n = 28 (A) and for n = 53 (D) to the infrared absorption spectra of bulk aluminium oxide lattices (B = crystalline γ-Al2O3; C = crystalline α-Al2O3; E = amorphous Al2O3). This result is obtained by van Heijnsbergen et al. (2003). |
| In the text | |
|
Fig. 13 Vibrational spectrum of the (Al2O3)n, n = 1–4, ground-state clusters and their corresponding structures. The structures (for n = 1–4) are depicted with increasing n from left to right and from top to bottom. The black line represents a Lorentzian distribution with HWHM parameter γ = 0.2 for all peaks. The left panel shows the intensity in units of km/mole; the right panel the opacity in units of cm2/g. |
| In the text | |
|
Fig. 14 Intensity of the (Al2O3)4 ground-state cluster vs. frequency convoluted with a Lorentzian function with FWHM of 24 cm-1. To be compared with Fig. 2d in Sierka et al. (2007). |
| In the text | |
|
Fig. 15 Top panel: normalized opacity of the (Al2O3)n clusters convoluted with a Lorentzian profile with a FWHM of 0.03 μm. The full coloured lines represent the opacities normalized for each cluster entity separately (with the same colour coding as in Fig. 13), while the dotted coloured lines indicate the wavelength position of all ground-state vibrational frequencies of the stable (Al2O3)n (n = 1−4) clusters. Middle panel: comparison between the (stellar continuum subtracted and normalized) SED of R Dor (full black line) and W Hya (full gray line) with the predicted vibrational frequencies of the stable (Al2O3)n (n = 1−4) clusters (vertical coloured lines). The gray areas indicate the region with some of the largest (Al2O3)n opacities. The dashed gray lines indicate the CO2 lines as discussed by Justtanont et al. (2004). The full red line represents the (stellar continuum subtracted and normalized) emission for a slab model containing H2O, SiO, and SiS. The column densities for all species were taken to be 1 × 1020 cm-2 at 0.5R⋆ above the stellar surface for a temperature of 2000 K. The individual contributions of H2O, SiO, and SiS are shown in the bottom panel. The column densities of the molecules were not chosen to fit the ISO/SWS data, but serve as illustrative examples on the molecular line veiling. |
| In the text | |
|
Fig. A.1 Channel maps (colour scale in mJy) of the AlO N = 9−8 transition in IK Tau. White contours indicate the continuum at (−1, 1, 4, 16, 64, 256) × 0.3 mJy. The ordinate and co-ordinate axis give the offset of the right ascension and declination, respectively, in units of arcseconds. The ALMA beam size is shown in the bottom left corner of the top panel. |
| In the text | |
|
Fig. A.2 Same as for Fig. A.1, but the AlO emission in the wind of IK Tau is averaged over 5 channels and smoothed with 0.̋5 Gaussian kernel. |
| In the text | |
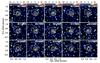 |
Fig. A.3 Same as for Fig. A.1, but for AlCl J = 24−23 in the wind of IK Tau. |
| In the text | |
|
Fig. A.4 Channel maps (colour scale in mJy) of the AlO N = 9–8 transition in R Dor, zooming in the inner 0.̋2 region. White contours are the continuum at (−1, 1, 4, 16, 64, 256) × 0.15 mJy. The ordinate and co-ordinate axis give the offset of the right ascension and declination, respectively, in units of arcseconds. The ALMA beam size is shown in the bottom left corner of the top panel. |
| In the text | |
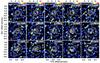 |
Fig. A.5 Same as for Fig. A.4, but for AlOH J = 11−10. |
| In the text | |
|
Fig. A.6 Same as for Fig. A.4, but zooming into the AlOH emission in the inner 0.̋2 region in the wind of R Dor. |
| In the text | |
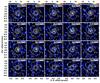 |
Fig. A.7 Same as for Fig. A.4, but for AlCl J = 24−23 in the wind of R Dor. |
| In the text | |
Current usage metrics show cumulative count of Article Views (full-text article views including HTML views, PDF and ePub downloads, according to the available data) and Abstracts Views on Vision4Press platform.
Data correspond to usage on the plateform after 2015. The current usage metrics is available 48-96 hours after online publication and is updated daily on week days.
Initial download of the metrics may take a while.