Open Access
Fig. 6
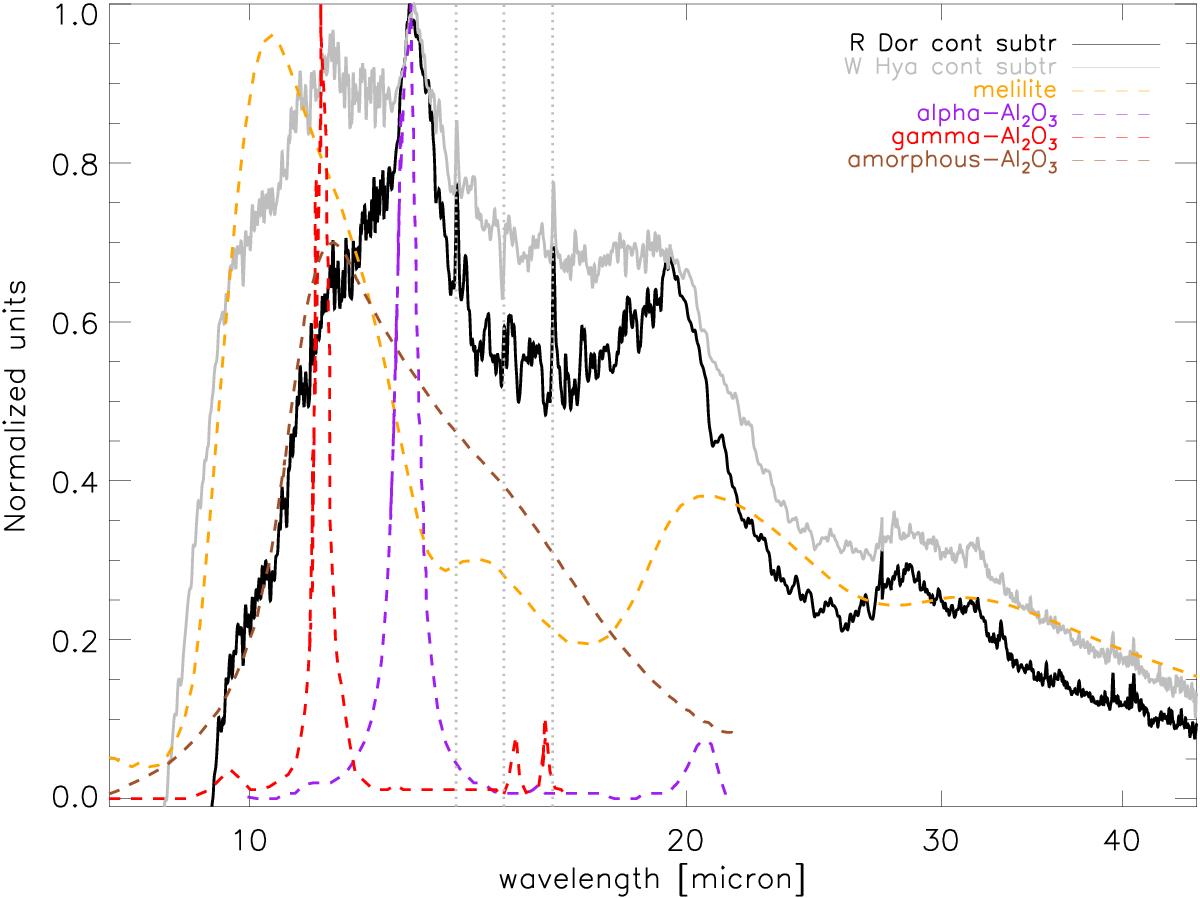
Continuum subtracted and normalized SED of R Dor and W Hya (in full black and gray lines, respectively). Characteristic (scaled) emission patterns of different dust species are shown in the coloured dashed lines. The gray vertical dotted lines indicate CO2 molecular emission (Justtanont et al. 1998; Ryde et al. 1999).
Current usage metrics show cumulative count of Article Views (full-text article views including HTML views, PDF and ePub downloads, according to the available data) and Abstracts Views on Vision4Press platform.
Data correspond to usage on the plateform after 2015. The current usage metrics is available 48-96 hours after online publication and is updated daily on week days.
Initial download of the metrics may take a while.