Open Access
Fig. 8
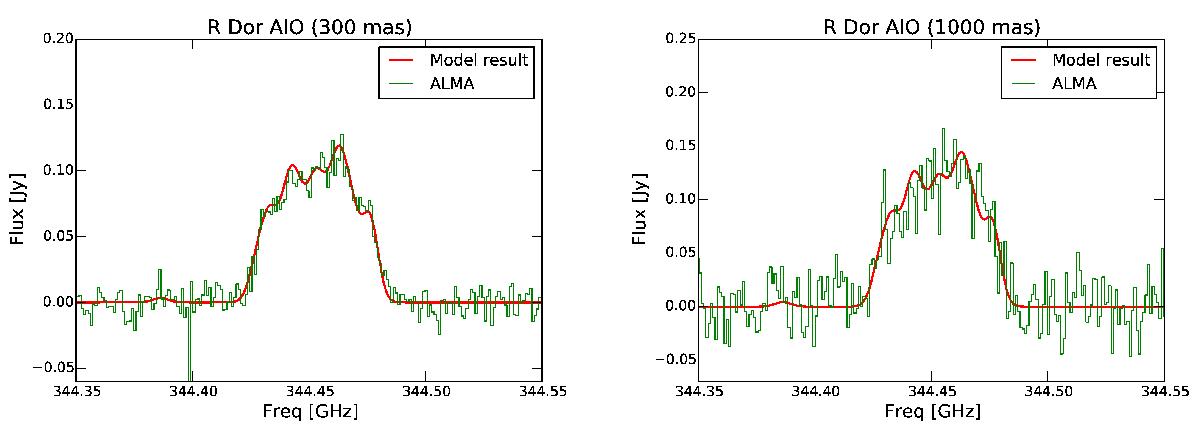
Comparison between the extracted ALMA AlO spectra of R Dor (green) and the predicted line profile (red) for an AlO abundance structure as given in Fig. 7 for the 300 mas (left) and 1000 mas (right) extraction aperture.
This figure is made of several images, please see below:
Current usage metrics show cumulative count of Article Views (full-text article views including HTML views, PDF and ePub downloads, according to the available data) and Abstracts Views on Vision4Press platform.
Data correspond to usage on the plateform after 2015. The current usage metrics is available 48-96 hours after online publication and is updated daily on week days.
Initial download of the metrics may take a while.