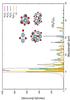
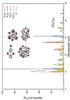
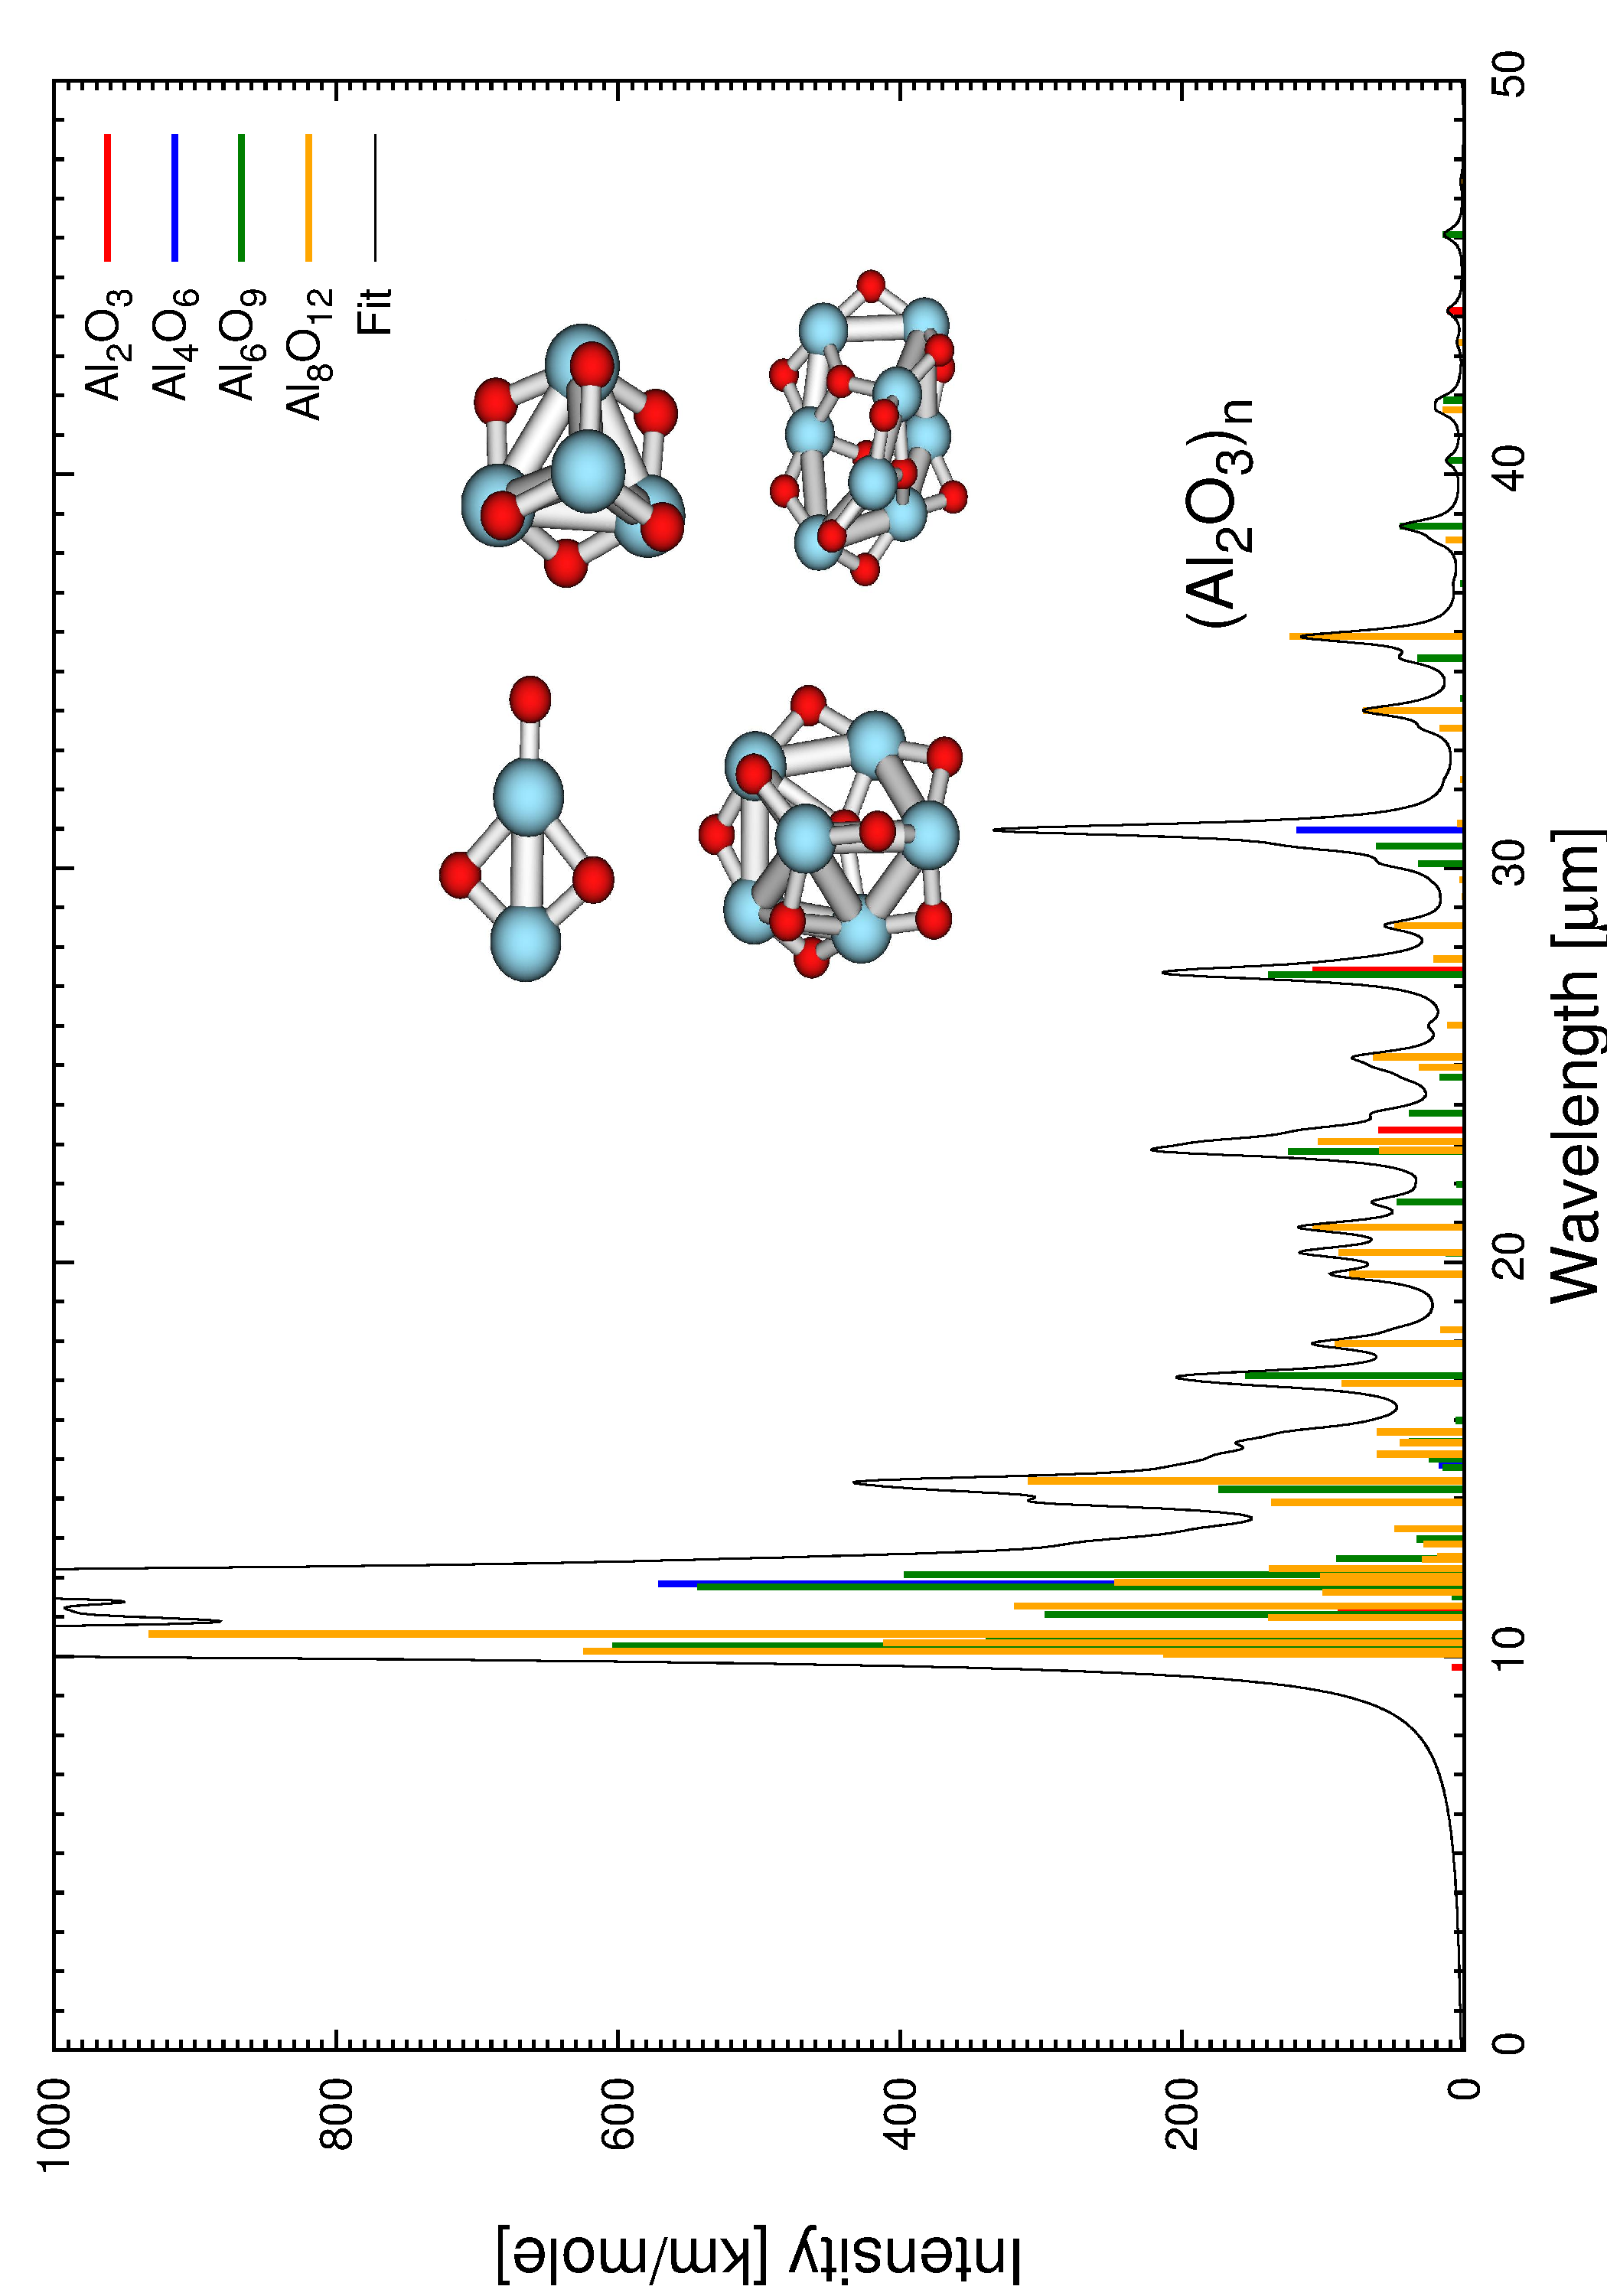
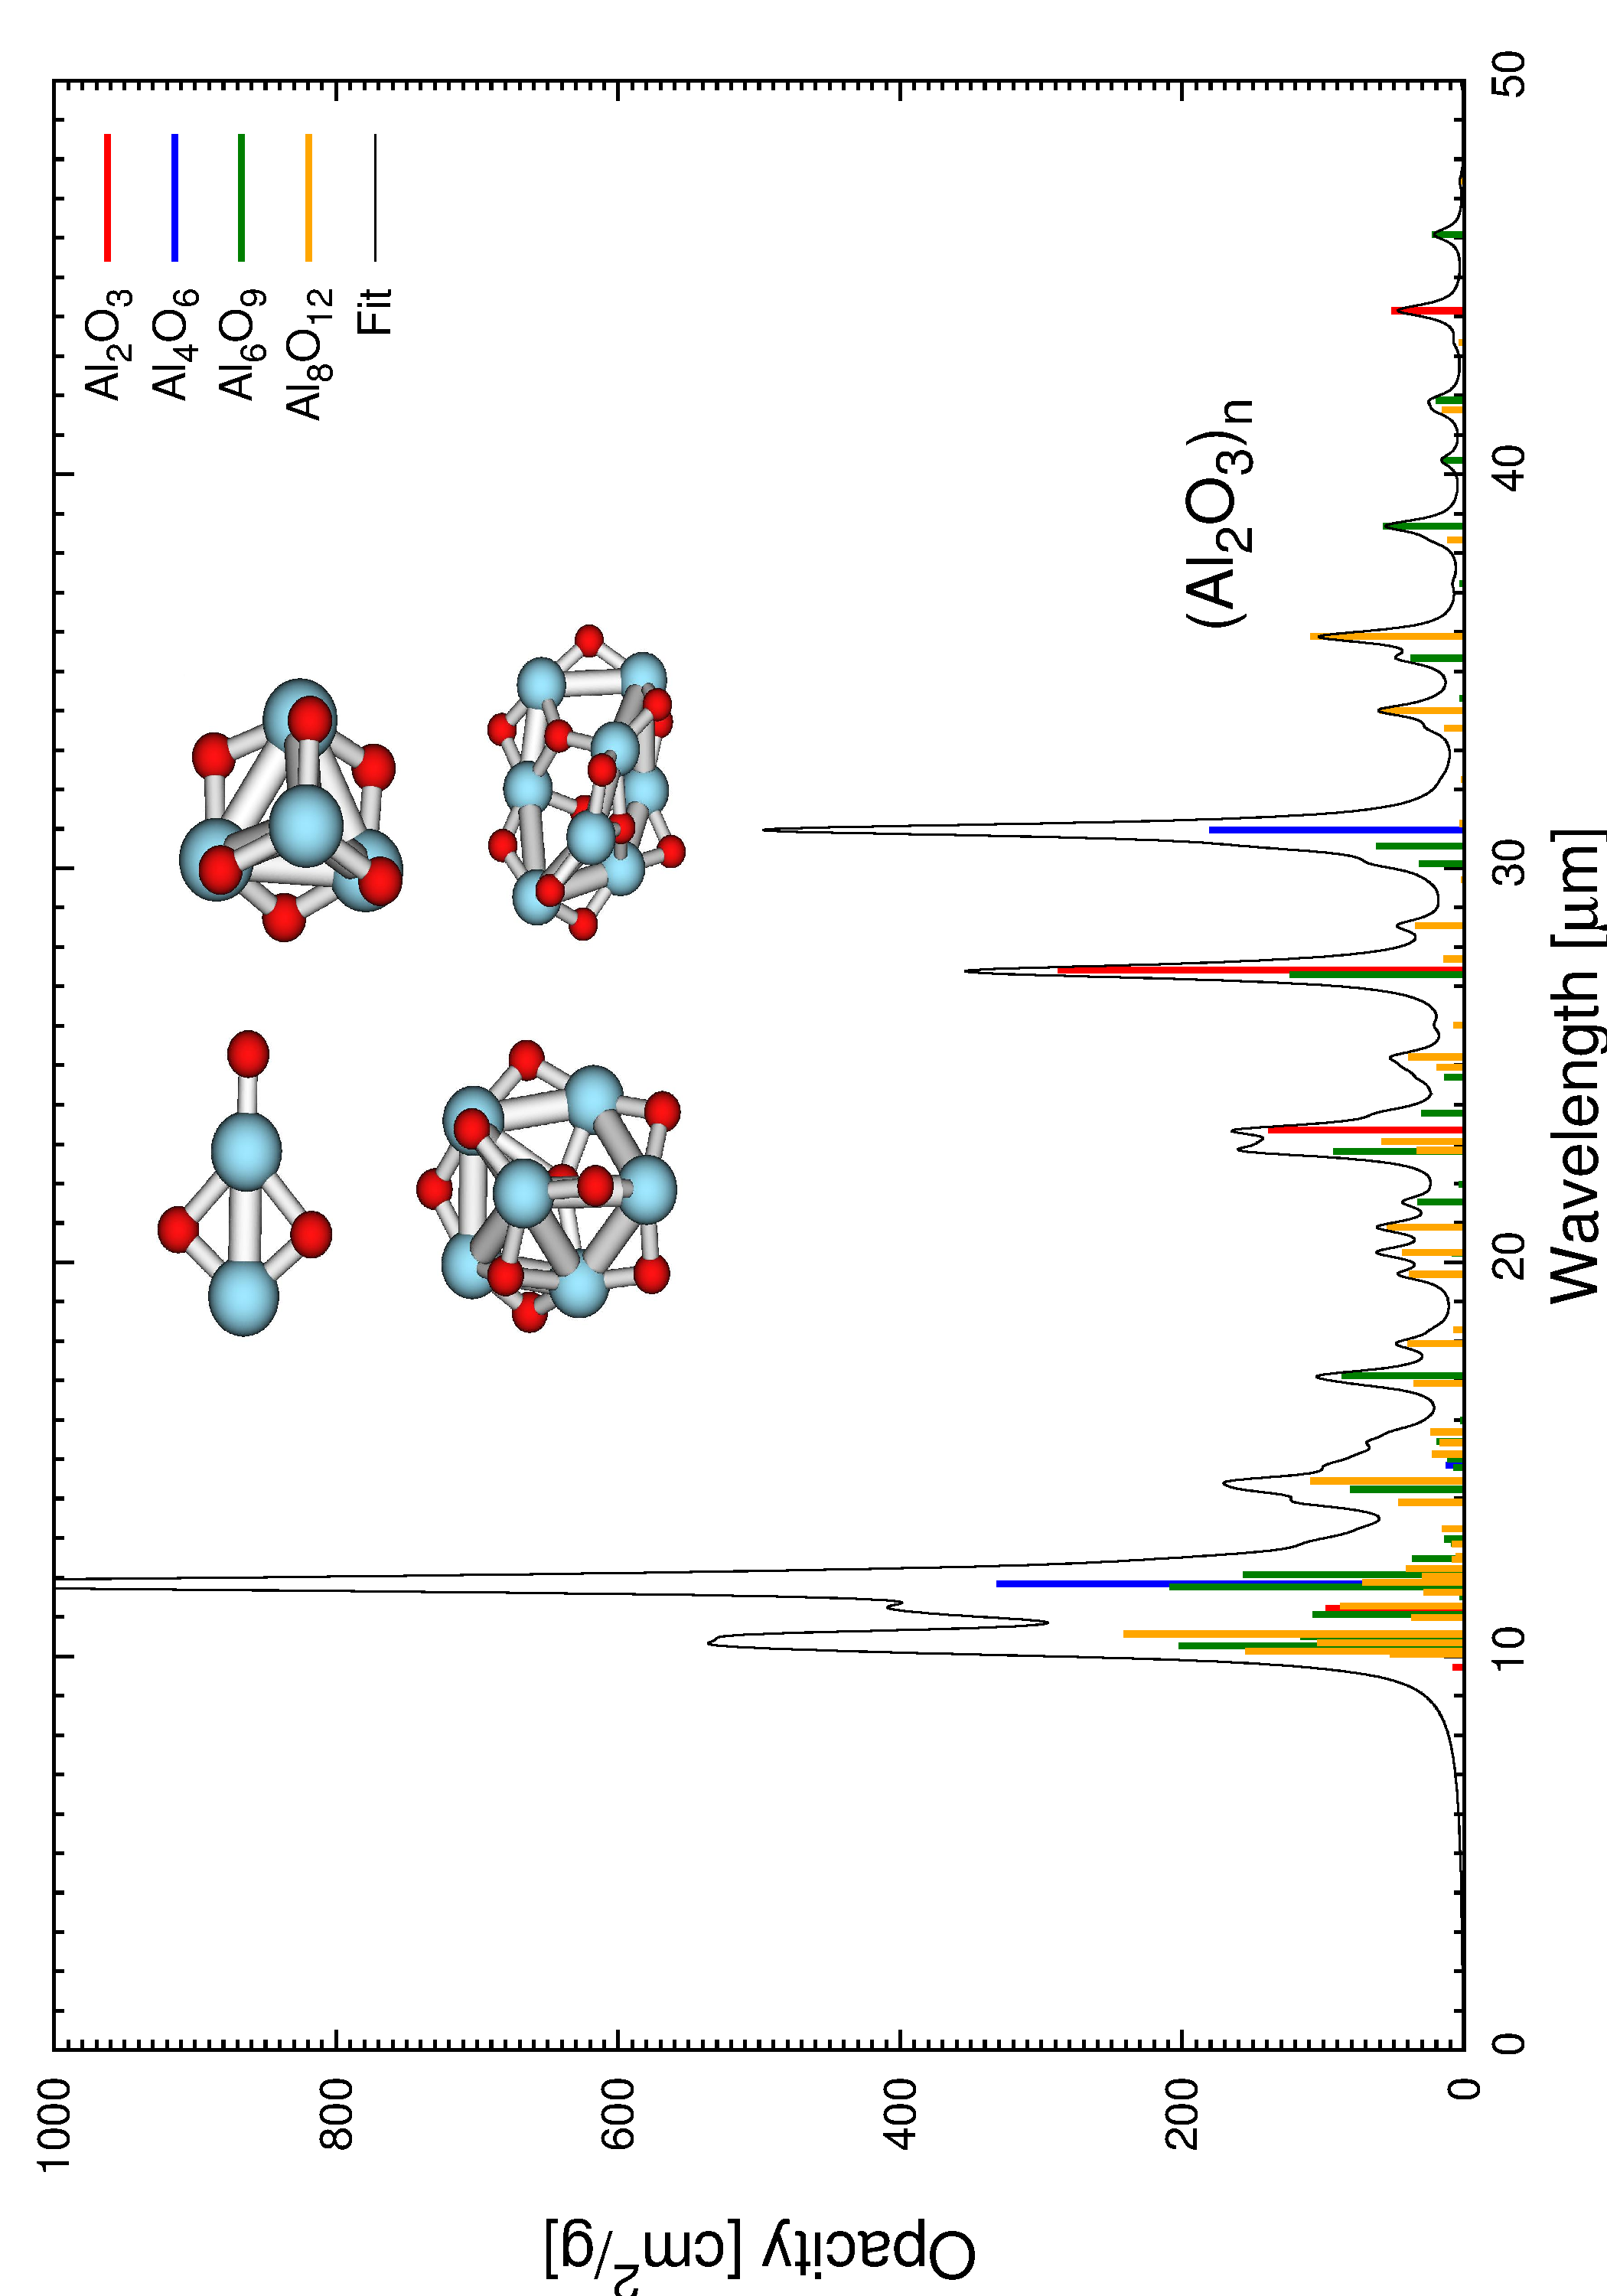
Fig. 13

Vibrational spectrum of the (Al2O3)n, n = 1–4, ground-state clusters and their corresponding structures. The structures (for n = 1–4) are depicted with increasing n from left to right and from top to bottom. The black line represents a Lorentzian distribution with HWHM parameter γ = 0.2 for all peaks. The left panel shows the intensity in units of km/mole; the right panel the opacity in units of cm2/g.
Current usage metrics show cumulative count of Article Views (full-text article views including HTML views, PDF and ePub downloads, according to the available data) and Abstracts Views on Vision4Press platform.
Data correspond to usage on the plateform after 2015. The current usage metrics is available 48-96 hours after online publication and is updated daily on week days.
Initial download of the metrics may take a while.