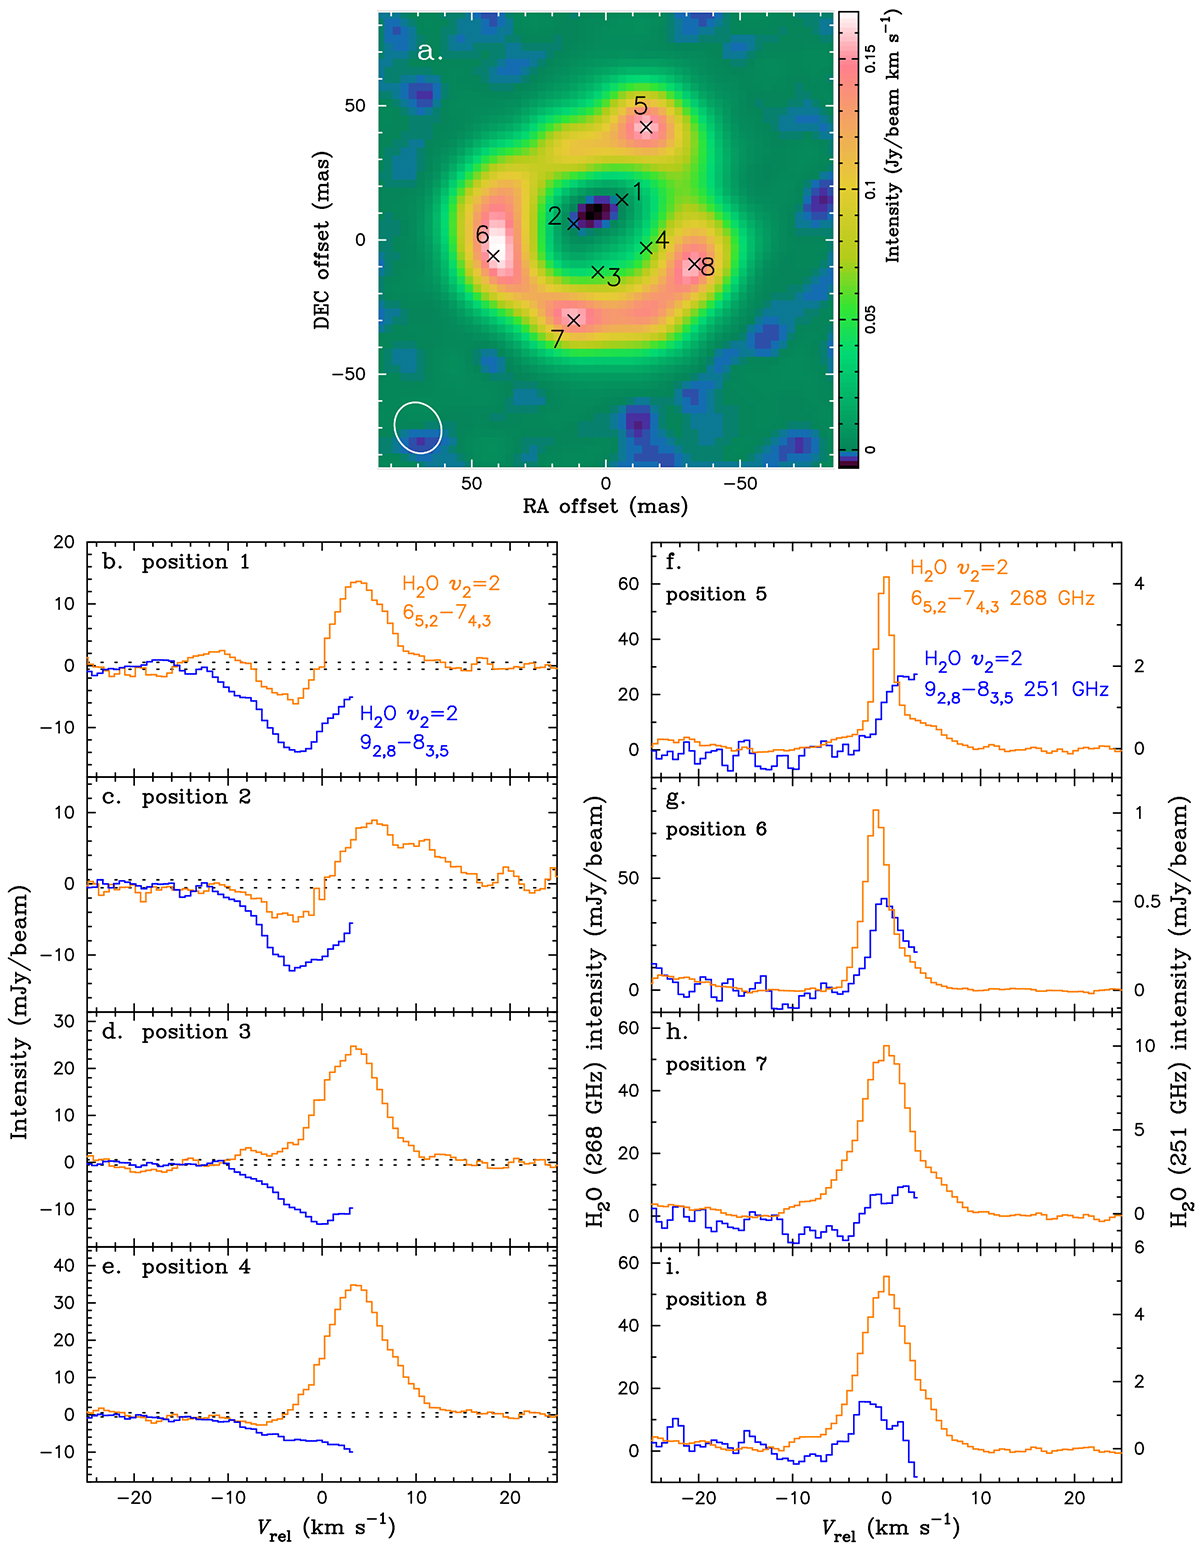
Fig. C.1.
Download original image
Spatially resolved spectra of two vibrationally excited H2O lines detected toward W Hya. Panel (a): The continuum-subtracted intensity map of the 268 GHz H2O line (v2 = 2, 65, 2–74, 3) integrated from Vrel = −1.5 to 1.5 km s−1 to show the most prominent emission components. The crosses and numbers correspond to the positions where the spatially resolved spectra shown in the lower two columns were obtained (the spectra were extracted at the marked pixels). Panels (b)–(i): Spatially resolved spectra obtained at positions 1–4 over the stellar disk and positions 5–8 off the limb of the stellar disk. The orange and blue lines show the continuum-subtracted spectra of the H2O lines v2 = 2, 65, 2–74, 3 (268 GHz) and v2 = 2, 92, 8–83, 5 (251 GHz), respectively. In panels (f)–(i), the left and right ordinates correspond to the intensity of the lines at 268 and 251 GHz, respectively. The spectra of the v2 = 2, 92, 8–83, 5 line are shown only up to Vrel = 3.2 km s−1, because the data at more redshifted velocities are affected by the blend due to the adjacent Si17O line at 250.744695 GHz. The weak emission seen at Vrel < −20 km s−1 in the 268 GHz line in panels (f)–(i) is due to the SO2 (v2 = 1, 113, 9–112, 10) line at 268.169791 GHz. The dotted lines in panels (b)–(e) mark the RMS noise level.
Current usage metrics show cumulative count of Article Views (full-text article views including HTML views, PDF and ePub downloads, according to the available data) and Abstracts Views on Vision4Press platform.
Data correspond to usage on the plateform after 2015. The current usage metrics is available 48-96 hours after online publication and is updated daily on week days.
Initial download of the metrics may take a while.