| Issue |
A&A
Volume 691, November 2024
|
|
|---|---|---|
| Article Number | L7 | |
| Number of page(s) | 6 | |
| Section | Letters to the Editor | |
| DOI | https://doi.org/10.1051/0004-6361/202451013 | |
| Published online | 05 November 2024 | |
Letter to the Editor
Proton ingestion in asymptotic giant branch stars as a possible explanation for J-type stars and AB2 grains
Institut d’Astronomie et d’Astrophysique, Université Libre de Bruxelles, CP 226, B-1050 Brussels, Belgium
⋆ Corresponding author; This email address is being protected from spambots. You need JavaScript enabled to view it.
Received:
6
June
2024
Accepted:
8
October
2024
Abstract
Context. J-type stars are a subclass of carbon stars that are generally Li-rich, not enriched in s-elements, and have low 12C/13C ratios. They were suggested to be the manufacturers of the pre-solar grains of type AB2 (having low 12C/13C and supersolar 14N/15N).
Aims. In this Letter, we investigate the possibility that J-type stars are early asymptotic giant branch (AGB) stars that experienced a proton ingestion event (PIE).
Methods. We used the stellar evolution code STAREVOL to compute AGB stellar models with initial masses of 1, 2, and 3M⊙ and metallicities [Fe/H] = − 0.5 and 0.0. We included overshooting above the thermal pulse and used a network of 1160 nuclei coupled to the transport equations. The outputs of these models were compared to observations of J-type stars and AB2 grains.
Results. In solar-metallicity AGB stars, PIEs can be triggered if a sufficiently high overshoot is considered. These events lead to low 12C/13C ratios, high Li abundances, and no enrichment in s-elements. We find that the 2 − 3 M⊙ AGB models experiencing a PIE can account for most of the observational features of J-type stars and AB2 grains. The remaining tensions between models and observations are (1) the low 14N/15N ratio of some AB2 grains and of 2 out of 13 J-type stars, (2) the high 26Al/27Al of some AB2 grains, and (3) the J-type stars with A(Li) < 2. Extra mixing mechanisms can alleviate some of these tensions, such as thermohaline or rotation.
Conclusions. This work highlights a possible match between AGB stellar models that undergo a PIE and J-type stars and AB2 grains. To account for other types of carbon stars, such as N-type stars, PIEs should only develop in a fraction of solar-metallicity AGB stars. Additional work is needed to assess how the occurrence of PIEs depends on mixing parameters and initial conditions, and therefore to further confirm or exclude the proposed scenario.
Key words: nuclear reactions, nucleosynthesis, abundances / stars: AGB and post-AGB / stars: carbon / stars: chemically peculiar
© The Authors 2024
 Open Access article, published by EDP Sciences, under the terms of the Creative Commons Attribution License (https://creativecommons.org/licenses/by/4.0), which permits unrestricted use, distribution, and reproduction in any medium, provided the original work is properly cited.
This article is published in open access under the Subscribe to Open model. This email address is being protected from spambots. You need JavaScript enabled to view it. to support open access publication.
1. Introduction
J-type stars (named by Bouigue 1954) are a subclass of carbon stars (C/O > 1) that represent about 15% of the carbon stars of the Galaxy and Large Magellenic Cloud (LMC) (Abia & Isern 2000; Morgan et al. 2003), and their origin is still largely unknown. Their metallicity is approximately solar and they are believed to have initial masses Mini ≲ 2 − 3 M⊙. They are likely on the (early) asymptotic giant branch (AGB) phase. Also, J-type stars have strong 13C isotopic features leading to 12C/13C < 20 (e.g. Lambert et al. 1986; Harris et al. 1987; Abia & Isern 1997, 2000; Ohnaka & Tsuji 1999; Abia et al. 2002, 2017) and do not show overabundances of s-elements (e.g. Abia & Isern 2000; Hatzidimitriou et al. 2003). A significant fraction (80% according to Abia et al. 2020) were reported to be Li-rich. Abia & Isern (1996) argued that Li and 13C may be produced by a similar mechanism. To our knowledge, no radial-velocity variations attesting to the presence of a binary companion have been detected in J-type stars. Standard AGB models face difficulties in reproducing these stars, and particularly their low 12C/13C ratio. Sengupta et al. (2013) proposed a binary-star formation channel involving re-accretion of nova ejecta onto a main sequence companion. Another possibility involves the merger of a helium white dwarf with a red giant (Zhang & Jeffery 2013).
Pre-solar silicon carbide (SiC) grains are microscopic solids that are believed to have been formed before the formation of the Solar System. These grains condensed around stars during their advanced evolutionary stages. The AB grains form a subclass of SiC grains characterised by low 12C/13C ratios (≲10) and a wide range of 14N/15N ratios (between ∼30 and ∼10 000). AB1 grains have subsolar 14N/15N ratios (< 440), while AB2 grains have supersolar 14N/15N ratios (Liu et al. 2017a). AB2 grains show similar features to J-type stars, supporting the idea that they may have been formed by them (Liu et al. 2017b). Standard AGB models of different initial masses and metallicities are thought to be at the origin of several types of SiC grains (mainstream, Y and Z; e.g. Zinner et al. 2006), but cannot account for the chemical features of AB grains. Astrophysical sites that may manufacture such grains include core-collapse supernovae following proton ingestion in the He/C layers of the progenitors (Pignatari et al. 2015; Liu et al. 2017a), and low-mass CO novae (Haenecour et al. 2016).
In this Letter, we investigate the possibility that J-type stars and AB2 grains correspond to AGB stars that experienced proton ingestion events (PIEs) in the convection-driven thermal pulses (TP). Section 2 presents our AGB models, while Sect. 3 is dedicated to their comparison with the various observational properties of J-type stars and AB2 grains. Conclusions are given in Sect. 4.
2. AGB models experiencing proton ingestion
2.1. Physical inputs
We consider initial masses at the zero-age main sequence (ZAMS) of Mini = 1, 2, and 3 M⊙ and metallicities of [Fe/H] = − 0.5 and 0.0 (Table 1), with the solar mixture of Asplund et al. (2009). The models are computed with the stellar evolution code STAREVOL (Siess et al. 2000; Siess 2006; Goriely & Siess 2018, and references therein). We used the same input physics as detailed in previous papers (Choplin et al. 2021, 2022a, 2022b; Choplin et al. 2024; Goriely et al. 2021; Martinet et al. 2024). The mass-loss prescription of Schröder & Cuntz (2007) is used until the end of core-helium burning, and we switch to the Vassiliadis & Wood (1993) formulation during the AGB phase. During the PIE, a nuclear network of 1160 nuclei is used to follow the nucleosynthesis and the nuclear burning is coupled to the transport equations. Overshoot mixing is included according to the prescription of Goriely & Siess (2018). The overshoot diffusion coefficient, Dover is defined as
Properties of J-type stars (first part of the table) and surface properties of our AGB models just after the PIE.
 (1)
(1)
where z* = fover Hp ln(Dcb)/2 is the distance over which mixing occurs, Dmin is the value of the diffusion coefficient at the boundary, z = z*, and p is a free parameter controlling the slope of the exponential decrease in Dover with z. We adopted the default values of Dmin = 1 cm2 s−1 and p = 1. We considered overshooting only above the TP with fover = ftop = 0.10 (for the M1.0_Zlow and M2.0_Zlow models) or 0.12 (for the other models) to trigger a PIE, as previously studied in Choplin et al. (2024, see Sect. 2.2 for more details).
2.2. Structure and evolution
The development of PIEs in AGB models has been extensively discussed in previous works (e.g. Iwamoto et al. 2004; Cristallo et al. 2009; Choplin et al. 2021). We reiterate just the main features of our models here, which are summarised in Table 1. During a PIE, protons are engulfed by the growing convective TP, activating the reaction chain 12C(p, γ)13N(β+)13C(α, n)16O. Because of the local production of energy in the pulse by 12C(p, γ)13N, the convective pulse splits. A few years later, the upper part of the pulse eventually merges with the convective envelope, enriching the AGB surface with the products of the PIE nucleosynthesis. Without extra mixing, PIEs are found to develop in AGB with Mini < 2.5 M⊙ and [Fe/H] < − 2 (Choplin et al. 2024). Including overshooting at the outer boundary of the TP facilitates PIEs. More specifically, the 1 and 2 M⊙ models with [Fe/H] = − 0.5 considered here experience PIEs when using ftop = 0.10. During a PIE, the neutrons produced by 13C(α, n)16O reach densities of Nn ∼ 1013 − 15 cm−3 at the bottom of the TP. In our models, we have 3.1 × 10¹² < Nn < 8.2 × 1013 cm−3. At low-metallicity, the PIE leads to the copious production of trans-iron elements (e.g. Cristallo et al. 2009; Choplin et al. 2021) but at solar metallicity, the synthesis of heavy elements is very modest and is concentrated around the iron-peak elements (Sect. 3.8).
After the PIE, the envelope is strongly enriched in metals, increasing its opacity and therefore the mass loss. The 1 M⊙ stellar models quickly lose their envelope, aborting the AGB evolution and preventing the development of further TPs. The model star of 2 M⊙ at [Fe/H] = − 0.5 (0.0) experiences 4 (2) additional TPs after the PIE, followed by third dredge-up (3DUP). For the 3 M⊙ with [Fe/H] = − 0.5 (0.0), 13 (16) pulses develop after the PIE, also followed by 3DUPs.
3. Comparison to J-type stars and AB2 grains
We consider the sample of 11 J-type stars of Abia & Isern (2000) plus 2 additional J-type stars (R Scl and T Lyr) analysed in Abia et al. (2015, 2017). Table 1 summarises the characteristics of these stars. For grains, we use the Presolar Grain Database1 (PGD, Hynes & Gyngard 2009; Stephan et al. 2024). We select all AB2 grains with 14N/15N > 440.
3.1. The C/O ratio
J-type stars have 1.02< C/O < 1.78 (Table 1). This is compatible with the 2 and 3 M⊙ solar metallicity AGB models that have a surface C/O ratio within the range of 1< C/O < 1.4 just after the PIE (Table 1). The 3 M⊙ at [Fe/H] = − 0.5 is also somewhat compatible with C/O =0.8. Other models have too high C/O ratios. After the PIE, further pulses and 3DUPs develop in the 2 and 3 M⊙ models (Sect. 2.2). This increases the C/O ratios from 1.4 to 2.7 (1.1 to 1.5) in the M2.0_Zsun (M3.0_Zsun) model. As a test, we recomputed the M2.0_Zsun with overshoot above and below the pulse as well as below the envelope (fover = 0.12). In this case, two additional TPs develop after the PIE (as in the standard case) and the C/O ratio increases from 1.4 to 2.1. The lower final C/O is due to the overshoot mixing below the pulse, which makes it hotter and leads to a higher oxygen intershell abundance (Herwig 2000).
3.2. The 12C/13C ratio
Our models start with 12C/13C =89 (solar value). After the first dredge up, the surface 12C/13C ratio drops to 20 − 30 (Fig. 1), before rising again during the AGB phase (without PIE): the 3DUP events following the TPs bring 12C in the envelope and the 12C/13C ratio steadily increases as the star climbs the AGB (solid green line in Fig. 1). Standard AGB models cannot account for 12C/13C ≲20 (red lines in Fig. 2) and consequently were proposed to be at the origin of MS, Y, and Z grains (Fig. 2) that have larger 12C/13C ratios. PIEs produce 13C mostly thanks to 12C(p, γ)13N(β+)13C, which is later dredged up. The surface 12C/13C ratio after the PIE in our AGB models is always between 5 and 10 (black triangles in Fig. 2), which is compatible with the values determined in J-type stars and in AB2 grains. Further TPs (and 3DUPs) develop in our 2 and 3M⊙ models and increase the 12C/13C ratio up to about 20 at maximum (dashed black lines in Fig. 2).
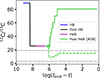 |
Fig. 1. Surface evolution of the 12C/13C ratio in a 2 M⊙ model of solar metallicity. The different colours represent the different evolutionary stages (HB for core-hydrogen burning, HeB for core-helium burning). The solid line corresponds to the standard model computed without overshoot (ftop = 0) and thus without PIE. The dashed line shows the same model but computed with ftop = 0.12 and hence experiencing a PIE during the early AGB phase (denoted by the green circle). The two dotted horizontal lines delineate the range of 12C/13C ratios observed in J-type stars (Table 1). |
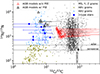 |
Fig. 2. 14N/15N ratio as a function of 12C/13C ratio in J-type stars (large blue points; also see Table 1) and grains of various types (smal circles). Uncertainties on the 12C/13C ratio in J-type stars amount to ±6, as recommended in Abia & Isern (2000). In red are shown the surface abundances of AGB models that do not experience PIEs, with initial masses and metallicities in the range of 1.3 < Mini/M⊙ < 6 and Z⊙ < Z < 0.003, corresponding to −0.7< [Fe/H] < 0.0 (from the FRUITY database, Cristallo et al. 2011, 2015). The red triangles give the surface abundances after the first 3DUP and the red dashed lines correspond to the evolution along the AGB. Black triangles show the surface abundances of the AGB models computed in this work, just after the PIE. The thick black triangle corresponds to the solar-metallicity 2 M⊙ model (M2.0_Zsun). Dashed black lines show the evolution of the surface abundances after the PIE. Horizontal and vertical solid lines show solar and terrestrial 12C/13C and 14N/15N values for comparison. |
3.3. The 14N/15N ratio
Immediately after the PIE, our models predict 2636< 14N/15N < 9805 at the surface, which corresponds to the upper range of observed values in AB2 grains (Fig. 2). The subsequent AGB evolution does not significantly alter this ratio. Out of the seven J-type stars with a 14N/15N ratio (Table 1), five are compatible with our models (within uncertainties) and two are below our model predictions, with ratios of 900 (VX And) and 1330 ± 800 (BM Gem). Slightly different initial masses and metallicity models may lead to lower 14N/15N ratios. Also, additional mixing processes operating during the AGB phase and not included here may transport protons below the convective envelope and produce additional 15N during the interpulse via 14N(n, p)14C(α, γ)18O(p, α)15N, with the neutrons coming from 13C(α, n) (see e.g. Goriely & Mowlavi 2000; Lugaro et al. 2004; Cristallo et al. 2014; Vescovi et al. 2021).
3.4. Oxygen isotopic ratios
J-type stars have 270< 16O/17O < 770 (Table 1). Within uncertainties, all stars (but VX And) are compatible with 16O/17O =300 − 400. This is in agreement with our solar metallicity 2 and 3 M⊙ models, which predict 16O/17O ∼300. The 16O/17O ratio tends to increase with decreasing mass (Table 1), meaning that higher ratios (matching that of VX And) may be obtained in AGB models slightly less massive than 2 M⊙. The predicted 16O/18O ratios of 750 − 900 in the solar metallicity 2 and 3 M⊙ models are also compatible with those of J-type stars (within uncertainties). No oxygen isotopic ratios are available for AB2 grains.
3.5. Fluorine
Fluorine was determined in six J-type stars and is not enhanced except in WZ Cas, which has [F/Fe] =0.95 (Table 1). We note that this star was classified as J-type by Abia & Isern (2000) but as SC-type by, for example, Abia et al. (2015). In our models, after the PIE, the surface [F/Fe] is close to zero except in M1.0_Zsun, where [F/Fe] =0.76 (Table 1). This is compatible with the overall low values found in J-type stars.
3.6. Lithium
Lithium is destroyed during the first dredge up and in our models at the start of the PIE, and the surface A(Li) ≈0. During the PIE, 3He is engulfed in the pulse and burns via 3He(α, γ)7Be (which is active at T ≳ 40 MK), later producing 7Li through the electron capture 7Be(e−, νe)7Li in the so-called Cameron & Fowler (1971) mechanism. The resulting surface A(Li) was shown by Iwamoto et al. (2004) to reach values of 3 − 5 for 1 − 3 M⊙ models with [Fe/H] = − 2.7. In our models, we find 3.5< A(Li) < 5.4 after the PIE (Table 1). This is compatible with about half of J-type stars (Fig. 3). The other half have A(Li) < 2. The lower A(Li) in J-type stars may be the result of extra mixing processes below the convective envelope during the thermally pulsating AGB phase (e.g. overshooting, thermohaline, or rotation) that allow the transport of the freshly synthesised Li to deeper and hotter regions where it is destroyed. An early depletion of 3He in the stellar envelope before the PIE would also hamper the Li production. Thermohaline and rotational mixing have been shown to decrease the envelope 3He before the AGB phase (e.g. Charbonnel 1995; Charbonnel & Zahn 2007; Eggleton et al. 2008; Lagarde et al. 2011, 2012). We tested this scenario by artificially decreasing the 3He mass fraction by a factor of 10 and 100 in the envelope of our M2.0_Zsun model just before the PIE. The resulting surface lithium enrichment (Fig. 3, black arrows) is reduced by ≈0.8 and 1.8 dex, respectively. We also recomputed the M2.0_Zsun model (named M2.0_ZsunB in Table 1) including thermohaline mixing following the scheme of Kippenhahn et al. (1980) and adopting a value of 1000 for the thermohaline coefficient, as in Charbonnel & Zahn (2007). The resulting lithium abundance after the PIE is A(Li) = 2.5 (filled triangle in Fig. 3), which is about 1.5 dex lower than the standard model. Extra mixing processes can therefore account for some spread in the observed Li abundances. We emphasise that our AGB models can reach the maximum A(Li) values obtained in J-type stars, which is a strong constraint.
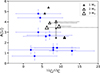 |
Fig. 3. A(Li) as a function of the 12C/13C ratio in J-type stars (blue dots, Table 1) and at the surface of our AGB models immediately after the PIE (black triangles). Dashed black lines show the changes in abundances during the subsequent AGB evolution. The short (long) vertical arrow indicates the lithium abundance if the 3He mass fraction in the H-rich envelope of the M2.0_Zsun model is divided by 10 (100) before the PIE. The filled triangle corresponds to a 2 M⊙ AGB at solar metallicity computed with thermohaline mixing (cf. Sect. 3.6 for details). |
3.7. Aluminium
In the PSG, the 26Al/27Al ratio was determined in about 50 AB2 grains and varies between 4 × 10⁻⁵ and 1.3 × 10⁻² with a mean value of 3 × 10⁻³. After the PIE, our AGB models predict 6.2 × 10⁻⁵< 26Al/27Al < 2 × 10⁻³ at their surface, with a mean of 8.5 × 10⁻⁴. The M2.0_Zsun model has 26Al/27Al =2 × 10⁻³, which is compatible with the average 26Al/27Al ratio in AB2 grains but cannot account for the highest values. However, nuclear uncertainties associated with 26Al(p, γ)27Si, 25Mg(p, γ)26Al, 26Al(n, p)26Mg, and 26Al(n, γ)23Na can impact the production and destruction of 26Al (see e.g. discussion in Liu et al. 2021).
3.8. Heavy elements
The mean heavy-element enhancement in J-type stars is 0.13 ± 0.12, which is compatible with no enrichment (Abia & Isern 2000). Only low-metallicity AGB models with [Fe/H] ≲ − 1 experiencing a PIE during the early AGB phase are found to be strongly enriched in heavy elements by the i-process nucleosynthesis (Fig. 4). For larger metallicities, the neutron-to-seed ratio during proton ingestion is too low to synthesise elements far beyond Fe (e.g. Barium). In particular, our solar-metallicity 2 M⊙ model does not show any overabundance of Ba, which is compatible with J-type stars (shown as black stars in Fig. 4). In this model, only elements with 26 < Z < 40 are slightly enriched with respect to the Sun (0.3 dex at most). Including overshooting above and below the pulse and below the envelope in the M2.0_Zsun model (cf. Sect. 3.1) leads to some s-processing after the PIE, with the surface [Ba/Fe] ratio rising from 0.02 after the PIE to 0.39 at the end of AGB (0.08 in the standard model).
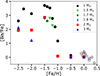 |
Fig. 4. Surface [Ba/Fe] ratio immediately after the PIE in AGB models with different masses and metallicities (models from Choplin et al. 2024, plus those computed in the present work). The grey star symbols represent J-type stars. |
We compared the yields of two of our AGB models (M2.0_Zsun and M2.0_Zlow) to the available isotopic ratios extracted in AB2 grains. All the data available (using the PGD) for AB2 grains are shown in Fig. 5 except 12C/13C (cf. Sect. 3.2), 14N/15N (cf. Sect. 3.3), and 26Al/27Al (cf. Sect. 3.7), and a few ratios including p-isotopes not followed in our AGB models. If Yi, Yj are the number abundances of isotopes i and j, one can define the associated δ-value, giving the permil deviations of Yi/Yj with respect to standard ratios (typically representing solar values); it can be written as
![Mathematical equation: $$ \begin{aligned} \delta (Y_i/Y_j) = \left[ \frac{(Y_i/Y_j)_{\rm grain}}{(Y_i/Y_j)_{\rm standard}} - 1 \right] \times 1000. \end{aligned} $$](/articles/aa/full_html/2024/11/aa51013-24/aa51013-24-eq2.gif) (2)
(2)
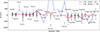 |
Fig. 5. δ(Yi/Yj) ratios (in ‰) defined by Eq. (2) for AB2 grains (i.e. AB grains with 14N/15N > 440, black error bars) and two of our AGB models (Table 1) that experienced a PIE (solid lines). |
As seen in Fig. 5, most ratios are well reproduced by the M2.0_Zsun model but the comparison is not as good for the M2.0_Zlow model. In particular, the large 88Sr/87Sr ratio in this lower-metallicity model is due to the higher neutron-to-seed ratio during the PIE, leading to the synthesis of some neutron-richer isotopes like 88Sr, to the detriment of, for example, 87Sr.
4. Summary, discussion, and conclusions
In this Letter, we present an investigation of the possibility that J-type carbon stars are solar metallicity AGB stars ([Fe/H] ≈0) that experienced a PIE and are the manufacturers of AB2 grains. Clearly, the most important features of J-type stars are their enrichment in 7Li and 13C and an absence of heavy elements. At solar metallicity, proton ingestion is a mechanism that co-produces 7Li and 13C, but no heavy elements. Overall, we find that most observational constraints of J-type stars and AB2 grains (metallicity, C/O ratio, lithium, fluorine, heavy elements, and isotopic ratios) can be accounted for by solar-metallicity 2 − 3 M⊙ AGB models that experienced a PIE. A few tensions between models and observation nevertheless remain: (1) the 14N/15N ratios below about 1500 in two J-type stars and in some AB2 grains cannot be accounted for by our models, (2) the high 26Al/27Al in some AB2 grains cannot be reproduced, and (3) J-type stars with A(Li) < 2 cannot be explained. Tensions (1) and (2) could be alleviated by including extra mixing mechanisms, such as rotation or thermohaline mixing, acting before the PIE and/or during the subsequent AGB phase. We should stress that our surface-abundance predictions are subject to various uncertainties associated in particular with the mass-loss rate and the efficiency of the 3DUPs that will impact the number of TPs and therefore the envelope composition. With additional 3DUP episodes, the C/O ratio and s-process enrichment will increase, which is in contradiction with J-type stars properties. It might be that J-type stars are a transient stellar population but further investigations are needed to clarify this point.
If the PIE scenario is valid, it is unclear as to why J-type stars of only ∼2 − 3 M⊙ are detected, and not ∼1 M⊙ for instance. A simple reason might be that it takes too long for these metal-rich low-mass stars to reach the AGB, and provided that they can (if their mass is slightly higher), after the PIE these models quickly lose their envelope, reducing the duration of the AGB phase to about 0.03 Myr. By contrast, this phase lasts about 1.2 and 3.0 Myr in our 2 and 3 M⊙ models, respectively, because of their more massive envelopes. In this scenario, the probability of observing J-type stars of 2 − 3 M⊙ is consequently much higher. Finally, we note that PIEs are less likely to develop with increasing initial mass (e.g. Choplin et al. 2024). This may explain the absence of J-type stars above ∼3 M⊙.
Importantly, for N-type stars2 and MS grains to also be accounted for, which are expected to originate from ∼2 − 3.5 M⊙ AGB stars following a standard evolution (i.e. no PIE; e.g. Abia et al. 2020, 2022; Straniero et al. 2023), only a fraction of solar-metallicity stars with initial masses of ∼2 − 3 M⊙ can experience a PIE (and become J-type stars). As PIEs are more easily triggered in low-mass AGB stars, J-type stars should be less massive than N-type stars on average. This is somewhat consistent with the finding that J-type stars are dimmer (higher Mbol) than N-type stars on average (Fig. 7 in Abia et al. 2022), although the overlap in Mbol is rather large. We presently lack understanding as to why specific AGB stars experience a PIE while others do not. Our studies have shown that whether or not a PIE is triggered very much depends on the strength and location of the overshooting (Choplin et al. 2024). The occurrence of PIEs may also be impacted by other physical processes linked, for example, to rotational mixing (e.g. Langer et al. 1999; Siess et al. 2004; Piersanti et al. 2013; den Hartogh et al. 2019), magnetic instabilities (e.g. Nucci & Busso 2014; Denissenkov et al. 2009; Vescovi et al. 2020), or internal gravity waves (Denissenkov & Tout 2003); these waves were shown to impact AGB evolution but their effect on the development of PIEs has not yet been studied. Most of the chemical properties of J-type stars can be explained by 2–3M⊙ stars experiencing a PIE but the reason why only a fraction of these stars experience this unusual mixing process remains unclear and further investigation is needed.
N-type stars are another class of carbon stars showing some s-process enrichment, higher 12C/13C ratios, and no lithium in general.
Acknowledgments
A.C. is post-doctorate F.R.S-FNRS fellow. L.S. and S.G. are senior F.R.S-FNRS research associates.
References
- Abia, C., & Isern, J. 1996, ApJ, 460, 443 [NASA ADS] [CrossRef] [Google Scholar]
- Abia, C., & Isern, J. 1997, MNRAS, 289, L11 [NASA ADS] [CrossRef] [Google Scholar]
- Abia, C., & Isern, J. 2000, ApJ, 536, 438 [NASA ADS] [CrossRef] [Google Scholar]
- Abia, C., Domínguez, I., Gallino, R., et al. 2002, ApJ, 579, 817 [NASA ADS] [CrossRef] [Google Scholar]
- Abia, C., Cunha, K., Cristallo, S., & de Laverny, P. 2015, A&A, 581, A88 [NASA ADS] [CrossRef] [EDP Sciences] [Google Scholar]
- Abia, C., Hedrosa, R. P., Domínguez, I., & Straniero, O. 2017, A&A, 599, A39 [NASA ADS] [CrossRef] [EDP Sciences] [Google Scholar]
- Abia, C., de Laverny, P., Cristallo, S., Kordopatis, G., & Straniero, O. 2020, A&A, 633, A135 [NASA ADS] [CrossRef] [EDP Sciences] [Google Scholar]
- Abia, C., de Laverny, P., Romero-Gómez, M., & Figueras, F. 2022, A&A, 664, A45 [NASA ADS] [CrossRef] [EDP Sciences] [Google Scholar]
- Asplund, M., Grevesse, N., Sauval, A. J., & Scott, P. 2009, ARA&A, 47, 481 [NASA ADS] [CrossRef] [Google Scholar]
- Bouigue, R. 1954, Ann. Astrophys., 17, 104 [Google Scholar]
- Cameron, A. G. W., & Fowler, W. A. 1971, ApJ, 164, 111 [NASA ADS] [CrossRef] [Google Scholar]
- Charbonnel, C. 1995, ApJ, 453, L41 [NASA ADS] [CrossRef] [Google Scholar]
- Charbonnel, C., & Zahn, J.-P. 2007, A&A, 467, L15 [NASA ADS] [CrossRef] [EDP Sciences] [Google Scholar]
- Choplin, A., Siess, L., & Goriely, S. 2021, A&A, 648, A119 [NASA ADS] [CrossRef] [EDP Sciences] [Google Scholar]
- Choplin, A., Goriely, S., & Siess, L. 2022a, A&A, 667, L13 [NASA ADS] [CrossRef] [EDP Sciences] [Google Scholar]
- Choplin, A., Siess, L., & Goriely, S. 2022b, A&A, 667, A155 [NASA ADS] [CrossRef] [EDP Sciences] [Google Scholar]
- Choplin, A., Siess, L., Goriely, S., & Martinet, S. 2024, A&A, 684, A206 [NASA ADS] [CrossRef] [EDP Sciences] [Google Scholar]
- Cristallo, S., Piersanti, L., Straniero, O., et al. 2009, PASA, 26, 139 [Google Scholar]
- Cristallo, S., Piersanti, L., Straniero, O., et al. 2011, ApJS, 197, 17 [NASA ADS] [CrossRef] [Google Scholar]
- Cristallo, S., Di Leva, A., Imbriani, G., et al. 2014, A&A, 570, A46 [CrossRef] [EDP Sciences] [Google Scholar]
- Cristallo, S., Straniero, O., Piersanti, L., & Gobrecht, D. 2015, ApJS, 219, 40 [Google Scholar]
- den Hartogh, J. W., Hirschi, R., Lugaro, M., et al. 2019, A&A, 629, A123 [NASA ADS] [CrossRef] [EDP Sciences] [Google Scholar]
- Denissenkov, P. A., & Tout, C. A. 2003, MNRAS, 340, 722 [NASA ADS] [CrossRef] [Google Scholar]
- Denissenkov, P. A., Pinsonneault, M., & MacGregor, K. B. 2009, ApJ, 696, 1823 [NASA ADS] [CrossRef] [Google Scholar]
- Eggleton, P. P., Dearborn, D. S. P., & Lattanzio, J. C. 2008, ApJ, 677, 581 [NASA ADS] [CrossRef] [Google Scholar]
- Goriely, S., & Mowlavi, N. 2000, A&A, 362, 599 [NASA ADS] [Google Scholar]
- Goriely, S., & Siess, L. 2018, A&A, 609, A29 [NASA ADS] [CrossRef] [EDP Sciences] [Google Scholar]
- Goriely, S., Siess, L., & Choplin, A. 2021, A&A, 654, A129 [NASA ADS] [CrossRef] [EDP Sciences] [Google Scholar]
- Haenecour, P., Floss, C., José, J., et al. 2016, ApJ, 825, 88 [NASA ADS] [CrossRef] [Google Scholar]
- Harris, M. J., Lambert, D. L., Hinkle, K. H., Gustafsson, B., & Eriksson, K. 1987, ApJ, 316, 294 [NASA ADS] [CrossRef] [Google Scholar]
- Hatzidimitriou, D., Morgan, D. H., Cannon, R. D., & Croke, B. F. W. 2003, MNRAS, 341, 1290 [NASA ADS] [CrossRef] [Google Scholar]
- Hedrosa, R. P., Abia, C., Busso, M., et al. 2013, ApJ, 768, L11 [NASA ADS] [CrossRef] [Google Scholar]
- Herwig, F. 2000, A&A, 360, 952 [NASA ADS] [Google Scholar]
- Hynes, K. M., & Gyngard, F. 2009, in 40th Annual Lunar and Planetary Science Conference, Lunar and Planetary Science Conference, 1198 [Google Scholar]
- Iwamoto, N., Kajino, T., Mathews, G. J., Fujimoto, M. Y., & Aoki, W. 2004, ApJ, 602, 377 [Google Scholar]
- Kippenhahn, R., Ruschenplatt, G., & Thomas, H. C. 1980, A&A, 91, 175 [Google Scholar]
- Lagarde, N., Charbonnel, C., Decressin, T., & Hagelberg, J. 2011, A&A, 536, A28 [NASA ADS] [CrossRef] [EDP Sciences] [Google Scholar]
- Lagarde, N., Decressin, T., Charbonnel, C., et al. 2012, A&A, 543, A108 [NASA ADS] [CrossRef] [EDP Sciences] [Google Scholar]
- Lambert, D. L., Gustafsson, B., Eriksson, K., & Hinkle, K. H. 1986, ApJS, 62, 373 [Google Scholar]
- Langer, N., Heger, A., Wellstein, S., & Herwig, F. 1999, A&A, 346, L37 [Google Scholar]
- Liu, N., Nittler, L. R., Pignatari, M., O’D Alexander, C. M., & Wang, J. 2017a, ApJ, 842, L1 [NASA ADS] [CrossRef] [Google Scholar]
- Liu, N., Stephan, T., Boehnke, P., et al. 2017b, ApJ, 844, L12 [NASA ADS] [CrossRef] [Google Scholar]
- Liu, N., Barosch, J., Nittler, L. R., et al. 2021, ApJ, 920, L26 [NASA ADS] [CrossRef] [Google Scholar]
- Lugaro, M., Ugalde, C., Karakas, A. I., et al. 2004, ApJ, 615, 934 [CrossRef] [Google Scholar]
- Martinet, S., Choplin, A., Goriely, S., & Siess, L. 2024, A&A, 684, A8 [NASA ADS] [CrossRef] [EDP Sciences] [Google Scholar]
- Morgan, D. H., Cannon, R. D., Hatzidimitriou, D., & Croke, B. F. W. 2003, MNRAS, 341, 534 [NASA ADS] [CrossRef] [Google Scholar]
- Nucci, M. C., & Busso, M. 2014, ApJ, 787, 141 [NASA ADS] [CrossRef] [Google Scholar]
- Ohnaka, K., & Tsuji, T. 1999, A&A, 345, 233 [NASA ADS] [Google Scholar]
- Piersanti, L., Cristallo, S., & Straniero, O. 2013, ApJ, 774, 98 [NASA ADS] [CrossRef] [Google Scholar]
- Pignatari, M., Zinner, E., Hoppe, P., et al. 2015, ApJ, 808, L43 [NASA ADS] [CrossRef] [Google Scholar]
- Schröder, K. P., & Cuntz, M. 2007, A&A, 465, 593 [NASA ADS] [CrossRef] [EDP Sciences] [Google Scholar]
- Sengupta, S., Izzard, R. G., & Lau, H. H. B. 2013, A&A, 559, A66 [NASA ADS] [CrossRef] [EDP Sciences] [Google Scholar]
- Siess, L. 2006, A&A, 448, 717 [NASA ADS] [CrossRef] [EDP Sciences] [Google Scholar]
- Siess, L., Dufour, E., & Forestini, M. 2000, A&A, 358, 593 [Google Scholar]
- Siess, L., Goriely, S., & Langer, N. 2004, A&A, 415, 1089 [NASA ADS] [CrossRef] [EDP Sciences] [Google Scholar]
- Stephan, T., Trappitsch, R., Hoppe, P., et al. 2024, ApJS, 270, 27 [NASA ADS] [CrossRef] [Google Scholar]
- Straniero, O., Abia, C., & Domínguez, I. 2023, Eur. Phys. J. A, 59, 17 [NASA ADS] [CrossRef] [Google Scholar]
- Vassiliadis, E., & Wood, P. R. 1993, ApJ, 413, 641 [Google Scholar]
- Vescovi, D., Cristallo, S., Busso, M., & Liu, N. 2020, ApJ, 897, L25 [Google Scholar]
- Vescovi, D., Cristallo, S., Palmerini, S., Abia, C., & Busso, M. 2021, A&A, 652, A100 [CrossRef] [EDP Sciences] [Google Scholar]
- Zhang, X., & Jeffery, C. S. 2013, MNRAS, 430, 2113 [NASA ADS] [CrossRef] [Google Scholar]
- Zinner, E., Nittler, L. R., Gallino, R., et al. 2006, ApJ, 650, 350 [NASA ADS] [CrossRef] [Google Scholar]
All Tables
Properties of J-type stars (first part of the table) and surface properties of our AGB models just after the PIE.
All Figures
|
Fig. 1. Surface evolution of the 12C/13C ratio in a 2 M⊙ model of solar metallicity. The different colours represent the different evolutionary stages (HB for core-hydrogen burning, HeB for core-helium burning). The solid line corresponds to the standard model computed without overshoot (ftop = 0) and thus without PIE. The dashed line shows the same model but computed with ftop = 0.12 and hence experiencing a PIE during the early AGB phase (denoted by the green circle). The two dotted horizontal lines delineate the range of 12C/13C ratios observed in J-type stars (Table 1). |
| In the text | |
|
Fig. 2. 14N/15N ratio as a function of 12C/13C ratio in J-type stars (large blue points; also see Table 1) and grains of various types (smal circles). Uncertainties on the 12C/13C ratio in J-type stars amount to ±6, as recommended in Abia & Isern (2000). In red are shown the surface abundances of AGB models that do not experience PIEs, with initial masses and metallicities in the range of 1.3 < Mini/M⊙ < 6 and Z⊙ < Z < 0.003, corresponding to −0.7< [Fe/H] < 0.0 (from the FRUITY database, Cristallo et al. 2011, 2015). The red triangles give the surface abundances after the first 3DUP and the red dashed lines correspond to the evolution along the AGB. Black triangles show the surface abundances of the AGB models computed in this work, just after the PIE. The thick black triangle corresponds to the solar-metallicity 2 M⊙ model (M2.0_Zsun). Dashed black lines show the evolution of the surface abundances after the PIE. Horizontal and vertical solid lines show solar and terrestrial 12C/13C and 14N/15N values for comparison. |
| In the text | |
|
Fig. 3. A(Li) as a function of the 12C/13C ratio in J-type stars (blue dots, Table 1) and at the surface of our AGB models immediately after the PIE (black triangles). Dashed black lines show the changes in abundances during the subsequent AGB evolution. The short (long) vertical arrow indicates the lithium abundance if the 3He mass fraction in the H-rich envelope of the M2.0_Zsun model is divided by 10 (100) before the PIE. The filled triangle corresponds to a 2 M⊙ AGB at solar metallicity computed with thermohaline mixing (cf. Sect. 3.6 for details). |
| In the text | |
|
Fig. 4. Surface [Ba/Fe] ratio immediately after the PIE in AGB models with different masses and metallicities (models from Choplin et al. 2024, plus those computed in the present work). The grey star symbols represent J-type stars. |
| In the text | |
|
Fig. 5. δ(Yi/Yj) ratios (in ‰) defined by Eq. (2) for AB2 grains (i.e. AB grains with 14N/15N > 440, black error bars) and two of our AGB models (Table 1) that experienced a PIE (solid lines). |
| In the text | |
Current usage metrics show cumulative count of Article Views (full-text article views including HTML views, PDF and ePub downloads, according to the available data) and Abstracts Views on Vision4Press platform.
Data correspond to usage on the plateform after 2015. The current usage metrics is available 48-96 hours after online publication and is updated daily on week days.
Initial download of the metrics may take a while.