Fig. 3.
Download original image
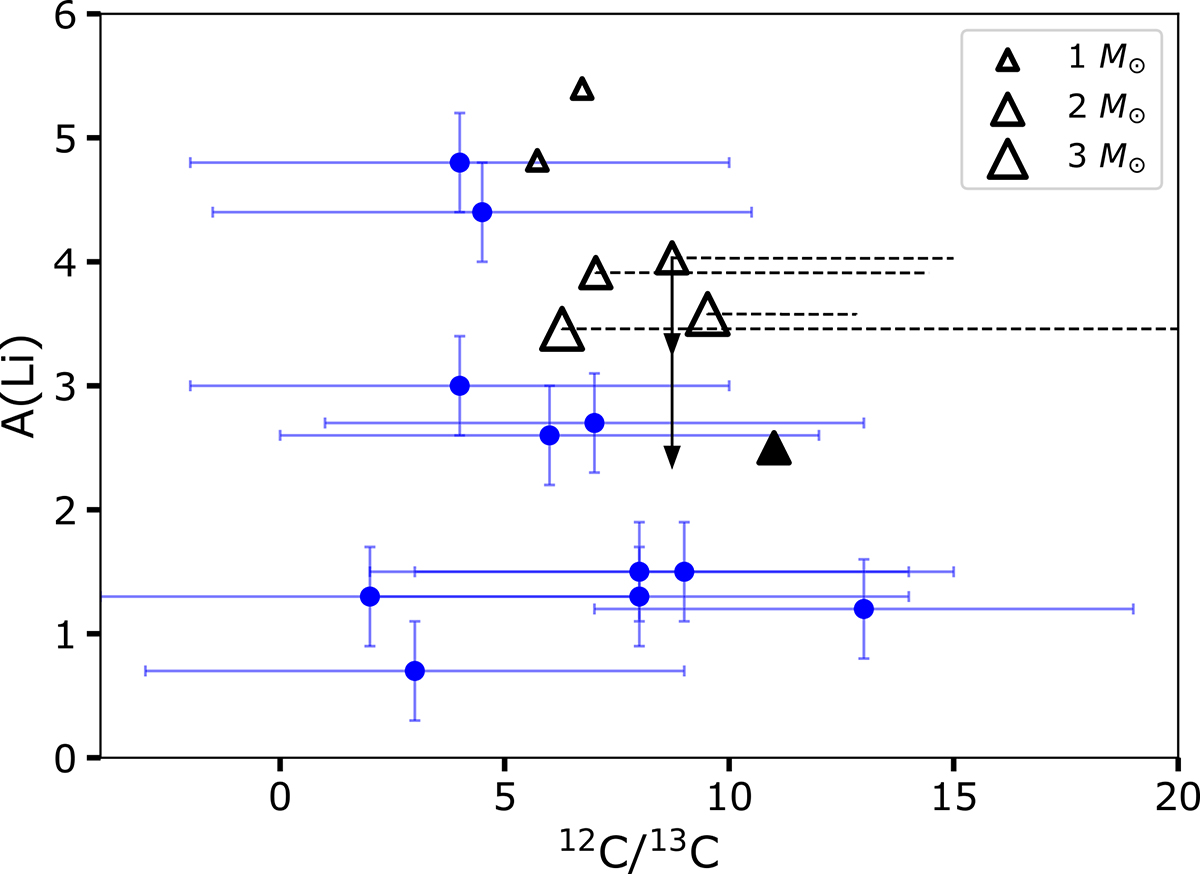
A(Li) as a function of the 12C/13C ratio in J-type stars (blue dots, Table 1) and at the surface of our AGB models immediately after the PIE (black triangles). Dashed black lines show the changes in abundances during the subsequent AGB evolution. The short (long) vertical arrow indicates the lithium abundance if the 3He mass fraction in the H-rich envelope of the M2.0_Zsun model is divided by 10 (100) before the PIE. The filled triangle corresponds to a 2 M⊙ AGB at solar metallicity computed with thermohaline mixing (cf. Sect. 3.6 for details).
Current usage metrics show cumulative count of Article Views (full-text article views including HTML views, PDF and ePub downloads, according to the available data) and Abstracts Views on Vision4Press platform.
Data correspond to usage on the plateform after 2015. The current usage metrics is available 48-96 hours after online publication and is updated daily on week days.
Initial download of the metrics may take a while.