Fig. 1.
Download original image
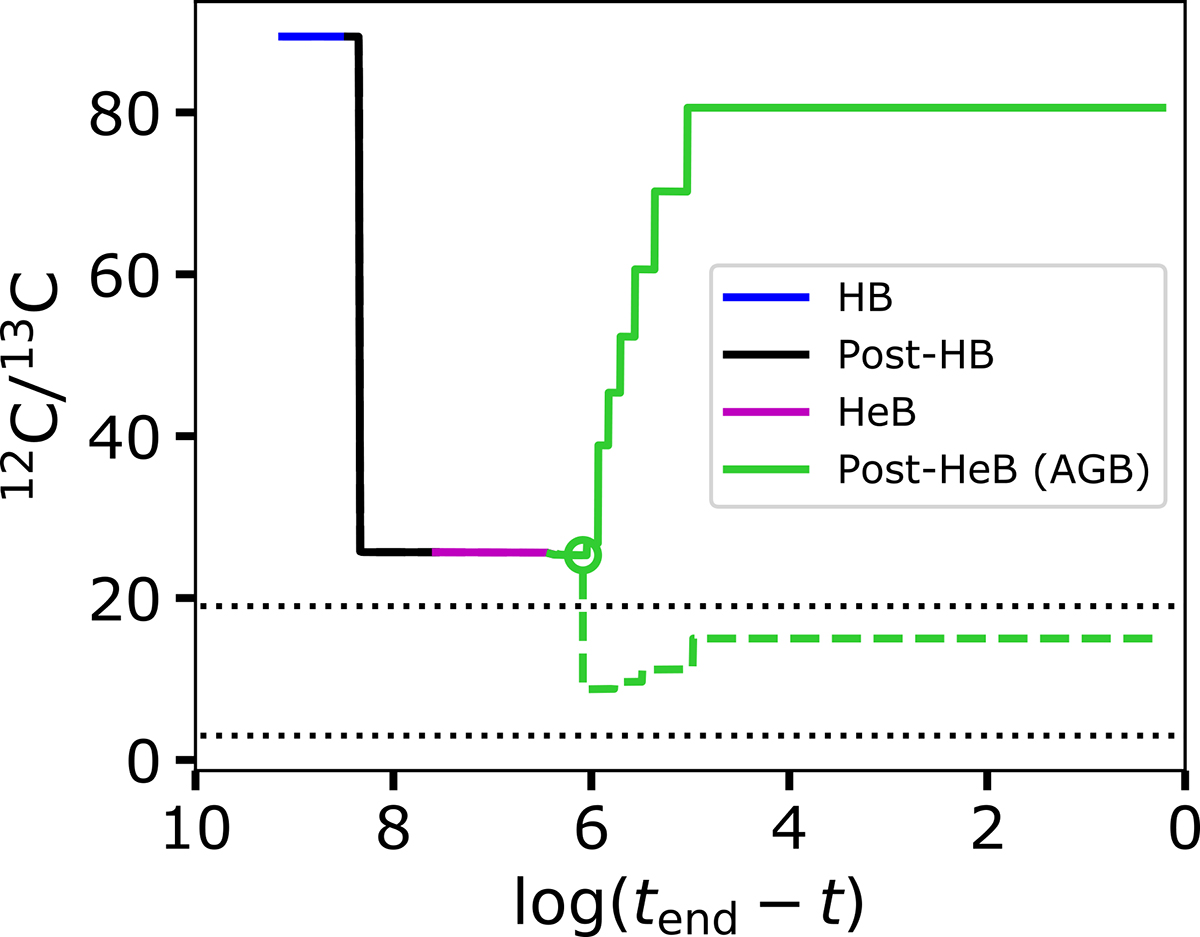
Surface evolution of the 12C/13C ratio in a 2 M⊙ model of solar metallicity. The different colours represent the different evolutionary stages (HB for core-hydrogen burning, HeB for core-helium burning). The solid line corresponds to the standard model computed without overshoot (ftop = 0) and thus without PIE. The dashed line shows the same model but computed with ftop = 0.12 and hence experiencing a PIE during the early AGB phase (denoted by the green circle). The two dotted horizontal lines delineate the range of 12C/13C ratios observed in J-type stars (Table 1).
Current usage metrics show cumulative count of Article Views (full-text article views including HTML views, PDF and ePub downloads, according to the available data) and Abstracts Views on Vision4Press platform.
Data correspond to usage on the plateform after 2015. The current usage metrics is available 48-96 hours after online publication and is updated daily on week days.
Initial download of the metrics may take a while.