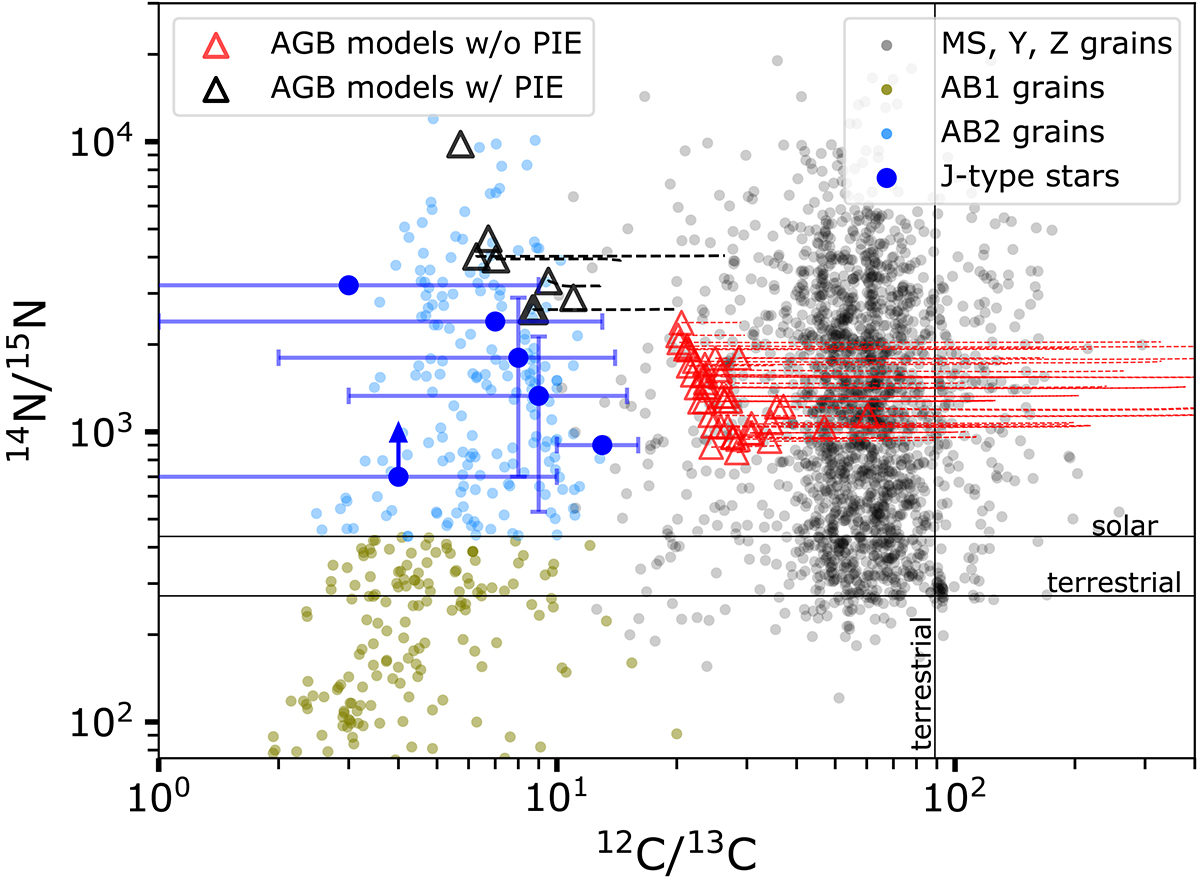
Fig. 2.
Download original image
14N/15N ratio as a function of 12C/13C ratio in J-type stars (large blue points; also see Table 1) and grains of various types (smal circles). Uncertainties on the 12C/13C ratio in J-type stars amount to ±6, as recommended in Abia & Isern (2000). In red are shown the surface abundances of AGB models that do not experience PIEs, with initial masses and metallicities in the range of 1.3 < Mini/M⊙ < 6 and Z⊙ < Z < 0.003, corresponding to −0.7< [Fe/H] < 0.0 (from the FRUITY database, Cristallo et al. 2011, 2015). The red triangles give the surface abundances after the first 3DUP and the red dashed lines correspond to the evolution along the AGB. Black triangles show the surface abundances of the AGB models computed in this work, just after the PIE. The thick black triangle corresponds to the solar-metallicity 2 M⊙ model (M2.0_Zsun). Dashed black lines show the evolution of the surface abundances after the PIE. Horizontal and vertical solid lines show solar and terrestrial 12C/13C and 14N/15N values for comparison.
Current usage metrics show cumulative count of Article Views (full-text article views including HTML views, PDF and ePub downloads, according to the available data) and Abstracts Views on Vision4Press platform.
Data correspond to usage on the plateform after 2015. The current usage metrics is available 48-96 hours after online publication and is updated daily on week days.
Initial download of the metrics may take a while.