| Issue |
A&A
Volume 691, November 2024
|
|
|---|---|---|
| Article Number | A154 | |
| Number of page(s) | 15 | |
| Section | Extragalactic astronomy | |
| DOI | https://doi.org/10.1051/0004-6361/202450130 | |
| Published online | 08 November 2024 | |
Distance estimation of gamma-ray-emitting BL Lac objects from imaging observations
1
Finnish Centre for Astronomy with ESO (FINCA), Quantum, Vesilinnantie 5, 20014 University of Turku, Finland
2
Aalto University Metsähovi Radio Observatory, Metsähovintie 114, 02540 Kylmälä, Finland
3
Department of Physics and Astronomy, University of Turku, Finland
4
Université Paris Cité, CNRS, CEA, Astroparticule et Cosmologie, 75013 Paris, France
5
Universidad de La Laguna (ULL), Departamento de Astrofísica, 38206 La Laguna, Tenerife, Spain
6
Instituto de Astrofísica de Canarias (IAC), 38200 La Laguna, Santa Cruz de Tenerife, Spain
7
Instituto de Astrofísica de Andalucía (CSIC), Glorieta de la Astronomía s/n, 18008 Granada, Spain
8
Nordic Optical Telescope, Apartado 474, E-38700 Santa Cruz de La Palma, Spain
9
Laboratoire Univers et Théories, Observatoire de Paris, Université PSL, Université Paris Cité, CNRS, 92190 Meudon, France
10
Department of Physics, Chemistry & Material Science, University of Namibia, Private Bag, 13301 Windhoek, Namibia
11
Centre for Space Research, North-West University, Potchefstroom 2520, South Africa
12
Oxford Astrophysics, University of Oxford, Denys Wilkinson Building, Keble Road, Oxford OX1 3RH, UK
13
INAF – Istituto di Radioastronomia, Via Gobetti 101, 40129 Bologna, Italy
⋆ Corresponding author; kani@utu.fi
Received:
26
March
2024
Accepted:
22
August
2024
Aims. The direct redshift determination of BL Lac objects is highly challenging as the emission in the optical and near-infrared bands is largely dominated by the non-thermal emission from the relativistic jet, which points very close to our line of sight. Therefore, the optical spectra of BL Lac objects often show no spectral lines from the host galaxy. In this work, we aim to overcome this difficulty by attempting to detect the host galaxy and derive redshift constraints based on assumptions on the galaxy magnitude (‘imaging redshifts’).
Methods. Imaging redshifts were derived by obtaining deep optical images under good seeing conditions, making it possible to detect the host galaxy as a weak extension of the point-like source. We then derived the imaging redshift by using the host galaxy as a standard candle, employing two different methods.
Results. We determine the imaging redshift for 9 out of 17 blazars that we observed as part of this programme. The redshift range of these targets is 0.28–0.60, and the two methods used to derive the redshift give very consistent results within the uncertainties. We also performed a detailed comparison of the imaging redshifts with those obtained using other methods, such as direct spectroscopic constraints or looking for groups of galaxies close to the blazar. We show that the constraints from the different methods are consistent and that combining the three constraints narrows down the redshift. For example, in the case of J2156.0+1818, which is the most distant source for which we detect the host galaxy, the redshift range is narrowed to 0.63 < z < 0.71. This makes the source interesting for future studies of extragalactic background light in the Cherenkov Telescope Array Observatory era.
Key words: galaxies: active / BL Lacertae objects: general / galaxies: nuclei / galaxies: structure
© The Authors 2024
 Open Access article, published by EDP Sciences, under the terms of the Creative Commons Attribution License (https://creativecommons.org/licenses/by/4.0), which permits unrestricted use, distribution, and reproduction in any medium, provided the original work is properly cited.
This article is published in open access under the Subscribe to Open model. Subscribe to A&A to support open access publication.
1. Introduction
Blazars are active galactic nuclei (AGNs) in which relativistic jets, launched by supermassive black holes, point very close to our line of sight. They are the most numerous extragalactic gamma-ray sources (E = 100 keV–100 GeV; Ajello et al. 2020), very high-energy gamma-ray sources (VHE; E = 100 GeV–100 TeV, Wakely & Horan 2008), and candidate sources of VHE astrophysical neutrinos detected by the IceCube Neutrino Observatory (IceCube Collaboration 2018).
Blazars are classified into flat spectrum radio quasars (FSRQs) and BL Lacertae (BL Lac) objects based on their emission lines. The former have broad (a few thousand km/s) and luminous (≥1042 erg s−1) emission lines in the optical spectra, and these lines are weak or absent in the latter. The limit is usually set at an equivalent width (EW) of 5 Å (Urry & Padovani 1995), but the EW emission lines of BL Lacs can sometimes be larger (see e.g. Stickel et al. 1991). One challenge in addressing the many key questions of blazar physics is the difficulty of obtaining redshifts from their nearly featureless, continuum-dominated spectra. High signal-to-noise spectra are needed to detect these weak lines, and therefore a large fraction of BL Lacs (∼59%) still have no firmly established redshifts (Massaro et al. 2015a).
For BL Lac objects, it is often easier to detect the host galaxy via deep optical and near-infrared imaging than via the weak emission and absorption lines. It was shown by Sbarufatti et al. (2005a) that the distribution of BL Lac host galaxy absolute magnitudes, MR, is almost Gaussian, with an average value of −22.9 and σ = 0.5. Therefore, the host galaxies of BL Lacs can be used as ‘standard candles’ to estimate their distances. This result was later confirmed by Shaw et al. (2013), albeit with a slightly different mean absolute magnitude. Due to the width of the host galaxy luminosity distribution, this redshift estimate has a 1σ error of at least 0.05 at z = 0.3, or about 16%, while spectroscopic redshift errors are regularly smaller than 0.1%.
Even if this method is less accurate than spectroscopic determination, it still gives an estimate of the distance of the source. In addition, it has been shown that for sources for which the host galaxy is detected in imaging, the spectroscopic observations are more likely to detect lines, resulting in a more accurate redshift determination (Nilsson et al. 2003; Goldoni et al. 2021; D’Ammando et al. 2024). The accurate determination of the host galaxy magnitude from imaging observations also allows us to estimate the mass of the supermassive black hole (MBH), a parameter that has been suggested to significantly correlate with the shape of the emitted spectral energy distribution and its bolometric luminosity (Ghisellini et al. 2011).
In the next few years, a new facility, the Cherenkov Telescope Array Observatory (CTAO), will become operational, with a northern site in the Canary Islands (Spain) and a southern site in the Atacama desert (Chile). It will have a 20 GeV–300 TeV energy range and a sensitivity approximately ten times better than the current facilities in this energy range. Blazars are the main extragalactic targets for CTAO, which is expected to detect hundreds of them according to current estimates, thus opening the possibility of population studies with significant sample sizes (Cherenkov Telescope Array Consortium 2019). The planning of observations by the CTAO Consortium is currently ongoing. It is therefore of great importance to start acquiring redshifts and properties of host galaxies for a large fraction of the AGN sources detected with Fermi-LAT (Fermi-Large Area Telescope) that are likely to be detected with CTAO. A redshift-measuring campaign has recently published three papers with this aim: Goldoni et al. (2021) contains spectroscopic measurements of 19 BL Lac objects, resulting in the determination of 11 new high-confidence redshifts, one tentative redshift, and three lower limits. In Kasai et al. (2023), 25 high-quality spectra are presented, resulting in 14 confirmed redshifts. In D’Ammando et al. (2024), 24 high-quality spectra resulted in 12 confirmed redshifts, one tentative redshift, and two lower limits.
In this paper, we present I-band imaging of a sample of 17 blazars. The sample selection is summarised in Sect. 2 and the deep optical imaging observations in Sect. 3. The analyses carried out to derive the imaging redshifts are explained in Sect. 4, and the results of these analyses are presented in Sect. 5. A discussion of how the derived constraints on the redshifts of the sources compare with the redshifts derived using other methods is presented in Sect. 6, and a summary and conclusions are presented in Sect. 7. Throughout this paper we use the cosmology H0 = 70 km s−1 Mpc−1, ΩΛ = 0.7, and ΩM = 0.3.
2. Sample selection
This paper is part of a larger redshift determination programme and therefore the initial step of the sample selection was performed as in Goldoni et al. (2021), Kasai et al. (2023) and D’Ammando et al. (2024). Fermi-LAT has detected more than 3130 AGNs, which are presented in the fourth Fermi-LAT catalogue (4FGL; Abdollahi et al. 2020). The sources that are detected above 10 GeV by Fermi-LAT are presented in the third Fermi-LAT catalogue of high-energy sources (3FHL; Ajello et al. 2017) and have a high probability of also being detected. with CTAO. 3FHL contains 1040 BL Lacs and Blazar candidates of an unknown type and initially for 64% of the sources the redshifts are unknown. The 3FHL spectra, which typically represent the average flux state of the source, are extrapolated to the VHE gamma-ray band, but adding cut-off at 3 TeV. Absorption by the extragalactic background light has also to be accounted for, but to account for it correctly, we would obviously need the redshift of the sources. At the time of the selection, we did not have spectroscopic redshifts for the sources and therefore used z = 0.3 for all sources. The extragalactic background light model from Domínguez et al. (2011) was used to calculate the gamma-ray absorption. The Monte Carlo simulations of the detectability with CTAO were performed with the Gammapy software1 and the publicly accessible CTAO performance files. The sources that are detectable at 5σ in 30 hours of observations with CTAO and have unknown redshift were selected for this redshift programme. The full sample consists of 165 sources.
In this paper we present deep I-band imaging observations of a sub-sample of 17 sources for which we could not find evidence of an extension or deep imaging observations in the literature. This programme started in 2016, so for some sources spectroscopic redshifts have been obtained, some of them as follow-up of these imaging observations. In that case, we re-evaluated the detectability with CTAO using the actual redshift. The observation times for CTAO to detect these sources are given in Table 1.
General properties of the sample.
3. Observations
The observations were carried out with the Nordic Optical Telescope (NOT)2. The objects of our sample were observed by NOT between 2016 and 2019 using the Alhambra Faint Object Spectrograph and Camera3 (ALFOSC) in the I band4. This instrument has a field of view of 6.4 × 6.4 arcmin with pixel scale of 0.21 arcsec/pix., gain 0.15 e−/ADU and readout noise 4.3 e−. The dark current is negligible due to liquid nitrogen cooling (0.03 e−/pix/h at Toperation = −120°C). The observations were performed in the I band during good seeing conditions to maximise the probability of detecting the host galaxy. The details of the observations are given in Table 2.
Logbook of the observations.
4. Analysis
The main goal of the analysis is to obtain the host galaxy luminosities and effective radii, which can then be used to derive the redshift using two methods described in more detail below. For this purpose, we fitted two-dimensional models to the observed light distribution.
Prior to the fitting, the images were reduced in the standard way of bias subtraction and flat-fielding, after which the individual images were registered using suitable stars in the field and summed. Calibration of the summed images was achieved through the stars with known magnitudes in the blazar fields. We first matched the positions of isolated stars in the field with positions in the PAN-STARRS survey catalogue (Chambers et al. 2016). The number of matched stars varied from 7 to 77 per field. We then obtained their i- and z-band aperture magnitudes from PAN-STARRS and transformed them to the Cousins I band via the formula5

After performing aperture photometry to the stars in our images, we derived the zero point for each field as the average difference between our and the transformed PAN-STARRS magnitudes. The rms scatter of the magnitude differences was generally found to be very small, about 0.01–0.02 mag per field, even for fields with the most numerous matches, thus showing that our calibration is accurate.
After calibration the local background near the blazar value was determined from 5–7 empty sky regions within ∼10 arcsec of the target and subtracted. A final check was made to ensure that there are no subtle slopes in the background. In the few cases a slope was found, it was corrected by fitting a plane to the pure sky emission around the target and subtracting the fit. Then we determined if there were any stars, galaxies, blemishes, etc. overlapping the blazar image and masked any affected pixels out of the fit. Finally, we visually determined the radius beyond which no blazar light (from host galaxy and nucleus) was visually detectable and restricted the fit inside this area.
Our model for the light distribution of blazars consists of two components, the unresolved AGN (hereafter the ‘core’) and the host galaxy. Three parameters, (xc, yc) position plus magnitude mc are sufficient to fully describe the core, whereas 7 parameters are needed for the host galaxy: position (xg, yg, assumed to be the same as the core), magnitude mg, effective radius reff, ellipticity ϵ, major axis position angle θ and the Sérsic index n, which determines how centrally concentrated the light distribution is by assuming that the light follows the Sérsic profile,
![$$ \begin{aligned} I(R)=I_e \exp \left\{ -b_n\left[ \left( \frac{R}{R_e}\right) ^{1/n} -1\right] \right\} , \end{aligned} $$](/articles/aa/full_html/2024/11/aa50130-24/aa50130-24-eq2.gif)
where Re is the half-light radius, Ie is the intensity at Re, and bn is a coefficient that depends on the Sérsic index n.
The models were convolved with a point spread function (PSF) obtained from a high S/N star as close as possible to the target. We preferred an empirical PSF over an analytical one since, according to our experience, the former better represents the complexities of the PSF, especially for images like ours that are made by summing data taken over a course of several hours. Empirical PSFs contain observational noise, but this noise can be made insignificant by using a sufficiently bright star for the PSF. As discussed in, for example, Nilsson et al. (2003), the PSF shape depends on the position on the ALFOSC CCD. We did not attempt to model this, but rather included it in our noise model (see below).
For the fitting we used the downhill simplex method to find the set of parameters that minimises the chi square between the data and model. To compute the chi square we assumed the noise in each pixel to consist of three components, summed in quadrature to calculate the total noise per pixel: photon noise, readout noise and PSF error. The first two can be computed from the effective gain and the effective read out noise. The PSF error was assumed to be equal to a Gaussian function centred on the target with a width equal to the full width at half maximum of the image and an amplitude of A times the peak value of the target. This noise component is significant only close to the centre of the target due to the quick tapering of the Gaussian function. A reasonable range for A is 0.01–0.1. We checked through simulations how the fit results depend on the choice of A. We find that, within the above range of A, the fit results are not biased in any significant way by the choice of A. However, the scatter of retrieved host galaxy parameters increases with increasing A. This happens because as A increases, the PSF noise becomes a more significant, and eventually dominant, noise source at the centre of the target. The central pixels contribute less and less to the total chi square sum, making the chi square space ‘flatter’, thus increasing the scatter in the retrieved parameters. We found A = 0.03 to provide a reasonable estimate of the PSF errors for our data and adopted this value for all targets.
The fits were done in two stages: we first fitted a pure AGN model (xc, yc, mc) to the image to fix the position and to look for any excess light in the residual image indicative of a host galaxy. In practice, if the core-subtracted image showed no residuals beyond PSF errors, we marked the target as unresolved, since experience has shown that no host galaxy is detected by the fit in this case (typically reff tends towards zero or infinity). If any residuals were detected, we moved to stage 2 by fixing the core and the host to the position obtained in stage 1. Since the host galaxies are typically very small and the unresolved core complicates the host characterisation, we did not attempt a detailed analysis of the host morphology. Therefore, we fixed ellipticity ϵ and position angle θ to 0 and let only the host magnitude mg and effective radius reff to vary freely. Thus, the second stage had three free parameters as well (mc, mg, and reff). Stage 2 was done for two Sérsic indices, n = 1 and n = 4; the former represents a disk-dominated galaxy and the latter a bulge-dominated galaxy. We find that n = 4 consistently gives a better fit to these observations, and, except where noted, the results presented are for the n = 4 case.
We used two different methods to estimate the blazar redshift. Firstly, the results from Sbarufatti et al. (2005a) and Shaw et al. (2013) show that the BL Lac host galaxy luminosities are confined to a relatively narrow range of ±0.5 mag. Sbarufatti et al. (2005a) obtained an average luminosity of MR = −22.9, and Shaw et al. (2013)MR = −22.5. The latter also discuss two likely reasons for the difference in these results. Firstly, the Shaw et al. (2013) sample may contain fainter hosts simply for the reason that the more luminous hosts were already discovered by the time of their survey since they are easier to detect. The other reason may be a difference in the mixture of low energy peaked and high energy peaked BL Lacs in the samples. For our analysis we assume that MR = −22.7 and that R − I = 0.62 at z = 0. The latter value was determined by integrating an elliptical galaxy template spectrum of Mannucci et al. (2001) over the R-band and NOT I-band bandpasses. Since the transformation from apparent to absolute magnitudes depends on redshift z, we have to find z iteratively. Because we also want to obtain an estimate of the uncertainty of z, we repeat the redshift iteration 1000 times each with different inputs. We thus had two loops, the inner loop performing the z iteration and the outer loop repeating this iteration 1000 times.
For each z iteration we first drew the observed I-band magnitude of the host galaxy mI from a Gaussian distribution with a mean and σ equal to the observed I-band magnitude and its error, respectively, and corrected it for Galactic absorption. Similarly, we drew a value for the host galaxy luminosity MR from a Gaussian distribution with mean = −22.7 and σ = 0.5 and transformed that to MI. Then we made a first guess of the redshift z = z0 and computed the K-correction K(z0) and evolution correction e(z0) corresponding to this guess. The K-correction was computed from a fit to the correction in Fukugita et al. (1995). For the evolution correction we used E(z) = 0.84 × z. This relation was derived by using the Pegase 3 code (Fioc & Rocca-Volmerange 2019) with a single starburst 10 Gyr ago and passive evolution thereafter. After this, we derived the distance modulus,

and the corresponding redshift, z1, from

where DL is the luminosity distance in parsecs. Since there is no closed from solution between z1 and DL, we interpolated the z1 corresponding to DL from a pre-computed table.
Then z1 was used to calculate K(z1) and E(z1) to derive z2. This calculation was iteratively repeated until it stabilised, which typically happened after ∼5 iterations and the resulting z was stored. After the outer loop was finished we computed the mean and standard deviation of the 1000 z estimates.
In the second method we assume that our host galaxies follow the Kormendy relation, that is, the projection of the fundamental plane to the Reff − ⟨μ⟩ axes of elliptical galaxies, where Reff is the effective radius in kpc and ⟨μ⟩ is the average surface brightness inside the effective radius. This method uses both the host galaxy brightness and the effective radius as input unlike the first method that uses only the brightness.
We used the i-band Kormendy relation derived in Samir et al. (2020) for the brightest cluster galaxies:

Although blazar host galaxies are typically not found in dense clusters (e.g. Wurtz et al. 1997), their luminosities are very similar to the brightest cluster galaxies. The redshift is found as follows: we start with a relatively low redshift z = 0.05 and compute the corresponding effective radius Reff in kpc from the observed effective radius reff. Next, we computed ⟨μ⟩ from the observed host galaxy magnitude, m, and the effective radius reff:

This will result in a point in the Reff − ⟨μ⟩ plane that lies below and left of the line defined by Eq. (4). Increasing the test redshift will cause the point to move up and towards the right, until at certain z = zbest it eventually cuts through the line defined by Eq. (4) (see Fig. 1). The redshift at which this happens is then adopted as the redshift of the blazar. We repeated this process 1000 times drawing each time the host magnitude, host effective radius, Galactic absorption and the slope and intercept of Eq. (4) from their respective distributions and adopted the standard deviation of the zbest as the error for the z.
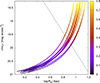 |
Fig. 1. Example of ten runs with the ‘Kormendy’ method for J0045.3+2127. Each run starts at z = 0.05 in the lower left corner, moves up and right as z is increased and ends at z = 0.8 as indicated by colour. The line indicates the Kormendy relation of Eq. (4). |
5. Results
The host galaxies of 9 out of 17 objects have been detected and the results of the AGN + host galaxy decomposition for these sources are shown in Fig. 2. The measured magnitudes and effective radii of the galaxies along with the resulting imaging redshifts using the two methods described in previous section are presented in Table 3. In all cases the imaging redshifts derived with the two methods agree very well within the uncertainties.
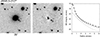 |
Fig. 2. Example of the AGN + host galaxy decomposition. The complete results are presented in Appendix A. Left panel: Grey-scale image of the target. North is up, and east is to the left. The field of view is given under the figure. Middle panel: Same image after subtracting the model. Right panel: Radial surface brightness profiles of the target (filled symbols), model (solid line), AGN nucleus (dashed line), and host galaxy (dot dashed line). |
Results of the host galaxy analysis.
We also estimated lower limits of z for the unresolved targets by adding an elliptical galaxy with MR = −21.7 (i.e. 1 mag fainter than the average value) and reff = 8 kpc to the observed image at increasing redshifts. We then determined the redshift at which the host galaxy became visually undetectable. Since it is not easy to objectively determine what ‘not visible’ means, we applied fairly conservative judgement and as such the resulting lower limits can also be considered very conservative.
The observations presented here had a good success rate of (∼53%), similar to the previous work by Nilsson et al. (2003), where 100 BL Lac objects were imaged through the R band. It is well known that it is easier to detect the host galaxy when the core is in a low state. We tried to optimise the timing of our imaging and spectroscopic observations (see Goldoni et al. 2021) to lower states of the blazars, when we had this information available. To understand if the successful detections were preferentially the result of observations in a low state and to see if there is room for improvement for the ones we did not detect, we investigated the Zwicky Transient Facility (ZTF) light curves of the 12 of our sources that were observed with NOT in the ZTF era (i.e. after the beginning of 2018). In Sect. 1 of the extra material6, we show these light curves. As can be seen, most of the 12 sources were observed in moderate activity states: we managed to avoid the brightest flares, but did not catch the minima of the light curves either. The three exceptions to this were 3FHL J1555.7+1111 (PG 1553+113), which we observed in rather high state (and did not detect the host), 3FHL J0905.5+1357 and 3FHL J2031.0+1936, which we did observe in low state (and detected the host galaxy). Judging from the light curves, all four sources (3FHL J0915.9+2933, 3FHL J1546.1+0818, 3FHL J1555.7+1111, and 3FHL J1844.4+1546), for which we have the ZTF data and did not detect the host should be re-observed during lower brightness state (see also Sect. 6).
Three unresolved targets deserve further comment. Firstly, we did not mark 3FHL J1811.3+0341 (1RXS J181118.3+034109) as resolved, although our analysis gives Ihost = 19.22 ± 0.20 and reff = 1.7 ± 0.9 arcsec. As can be seen from Fig. 3, the surface brightness profile is just above the PSF and the host is very weak compared to the core. Furthermore, there are numerous objects overlapping with the blazar, making it very hard to find pixels unaffected by them. For these two reasons it is very difficult to reliably characterise the host galaxy and derive its redshift.
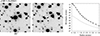 |
Fig. 3. Results of the AGN + host galaxy decomposition of J1811+0341. The panels are the same as in Fig. 2. |
Secondly, some earlier studies of 3FHL J0915.9+2933 have concluded that this object is not extended (Abraham et al. 1991; Nilsson et al. 2003), while Meisner & Romani (2010) found it extended with igal ∼ 18.45. We see weak excess around the centre after subtracting the PSF from the position of 3FHL J0915.9+2933 (Fig. 4). Fitting a AGN core + host galaxy model yields i = 17.66 ± 0.08 and reff = 1.0 ± 0.2 arcsec. There is a faint extension SW of centre (Fig. 4, upper row), also visible in the residual image of Nilsson et al. (2003) and some excess emission E of the target. Due to these anomalies, we do not attempt to estimate the redshift of this source. The residuals after subtracting the core correspond to i = 18.20, consistent with Meisner & Romani (2010).
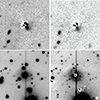 |
Fig. 4. Upper row, left: 3FHL J0915.9+2933 after subtracting the PSF + host galaxy model. The field of view is 27 × 27 arcsec. Upper row, right: Same target from Nilsson et al. (2003). Lower row, left: 21 × 21 arcsec field around 3FHLJ 1933.3+0726. Lower row, right: Same field after subtracting the PSF from bright sources in the field and from the blazar. |
Thirdly, 3FHL J1933.3+0726 shows very atypical features for a blazar (Fig. 4, lower row). This target is clearly resolved, but the host galaxy type cannot be assigned since, unlike in all other targets, where the host galaxy fades smoothly into the background noise, the nebulosity around 3FHL J1933.3+0726 exhibits a relatively sharp edge, giving an impression of spiral galaxy seen face-on. The numerous targets overlapping the blazar and a CCD bleeding feature running over the core of J1933.3+0726 further complicate the analysis. We used an iterative scheme in order to mitigate the effect of overlapping stars. We first performed PSF photometry on all bright targets near 3FHL J1933.3+0726 and subtracted them. Then we ran the model fit and subtracted the blazar model from the original image. The PSF photometry was repeated again on this subtracted image after which model fitting was done again after subtracting the blazar model. After three iterations the fit results stabilised. This iteration was done using n = 1 and n = 4 and notably this is the only target where the n = 1 model gave a better fit to the data. However, significant residuals are still present in both cases. Given the peculiar morphology, the high number of overlapping targets and instrumental blemishes we did not attempt to derive a redshift for this target.
In one of the fields, 3FHL J1150.5+4154, the galaxies around the blazar seem to be distorted in a manner characteristic to gravitational lensing (Fig. 5). We made a simple study to see if we could establish this quantitatively by looking for an excess of galaxies with their sky projected major axes perpendicular to the line connecting the galaxy to 3FHL J1150.5+4154. We first extracted all targets brighter than certain magnitude mc and within a certain radius r of 3FHL J1150.5+4154 using the Source Extractor (Bertin & Arnouts 1996) and recorded their positions, ellipticities ϵ and position angles. Then we calculated ϕ, the angle between the target major axis and the line connecting the target to 3FHL J1150.5+4154, and plotted ϕ as a function of ϵ. In the case of strong distortions by lensing, it is expected that at low ϵ, where the targets are mostly stars, ϕ is independent of ϵ, but as ϵ gets higher the ϕ values are more concentrated around 90 degrees. We tested different values of mc and r, but in all cases the distribution of ϕ remained uniform, even at high ellipticities. We thus found no evidence of a preferred orientation of galaxies around 3FHL J1150.5+4154.
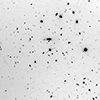 |
Fig. 5. 4.3 × 4.3 arcmin field around 3FHL J1150.5+4154. The blazar is indicated by tick marks. |
6. Discussion
In this section we compare the redshift constraints obtained in this work with other redshift constraints. As the redshifts we determined in this work with the two methods agree in all cases very well within the uncertainties, in the following comparisons we only report z1 for simplicity.
In five of the nine case where we detected the host galaxy, we also had the spectroscopic redshift from Paiano et al. (2020) or Kasai et al. (2023). Table 4 lists those cases together with earlier estimates from the literature. The photometric and spectroscopic redshifts are compared in Fig. 6. This figure shows that the host galaxy method is able to provide a reasonable estimate of the blazar redshift at least up to z = 0.5. Beyond that, the redshifts seem to be underestimated by the host galaxy method, but there are only three data points, so it is unclear how significant this offset is. Such a deviation is expected since at redshifts beyond 0.5 we are likely to detect only the most luminous host galaxies, brighter than the assumed MR = −22.7.
Comparison of host-galaxy-based redshift estimates to spectroscopically measured redshifts.
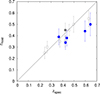 |
Fig. 6. Comparison of redshifts obtained spectroscopically and via the host galaxy method. Grey symbols show earlier results and blue symbols the results obtained in this paper. Open and filled symbols denote R-band and I-band detections, respectively (see Table 4 and the main text for details). The line shows a perfect correspondence. |
This can be seen in Table 5, where we list the computed R-band host galaxy luminosity and estimated central black hole masses of the five targets with a spectroscopic redshift. To estimate the black hole masses we first transformed our K- and evolution-corrected I-band absolute magnitudes to the R band using MR = MI + 0.62. We then used two different bulge-luminosity–black-hole-mass relationships, the MR − MBH correlations of Graham (2007) and Jiang et al. (2011) to compute the black hole masses. The two estimates agreed to within 0.1 in dex. In Table 5 we give the average of the two results. As can be seen from the table, in 4 out of 5 cases the luminosity of the host galaxy is brighter than the average luminosity MR = −22.7, in three cases even more than the σ = 0.5 of the host galaxy absolute magnitude distribution.
R-band host galaxy luminosity and estimated central black hole masses.
On the other hand, some targets in our 17 target sample have been imaged before with negative results. Thus, one might argue that because of this, the bright host galaxies have already been detected and we should be finding on average fainter host galaxies. Shaw et al. (2013) discussed this as one possible explanation why they derived fainter average magnitude (MR = −22.5) for their host galaxies compared to earlier work by Sbarufatti et al. (2005a) (MR = −22.9). In our case, none of the five targets had previous imaging observations and the sample is too small to make any statement to support one or the other average magnitude. But it is certainly interesting that in this very small sample, the very luminous host galaxies are ‘over-represented’. We encourage further deep imaging observations of high-synchrotron-peaked sources with known spectroscopic redshift to further investigate this issue.
In addition to direct spectroscopic constraints on redshifts and the host galaxy imaging discussed in this paper, it is also possible to obtain constraints on the blazar redshift from the spectroscopic redshifts of galaxies close to the blazar. This method has already been used for several blazar: PKS 0447-439 (z = 0.343; Muriel et al. 2015), PKS 1424+240 (z = 0.601; Rovero et al. 2016), PG 1553+113 (z = 0.433; Johnson et al. 2019), which is also in our sample, (3FHL J1555.7+1111), and RGB 2243+203 (z = 0.528; Rosa González et al. 2019). In the case of PKS 1424+240, direct spectroscopic observations have later confirmed the redshift (Paiano et al. 2017; D’Ammando et al. 2024). We did not perform dedicated spectroscopy of the companions, but eight of the blazars in our sample are within the SDSS footprint and we searched the SDSS database to obtain the redshifts of the galaxies within 7.5 arcmin of the target blazar. We selected this radius, because at z = 0.3 this radius corresponds to approximately 2 Mpc, which is a typical search radius for companion galaxies (see e.g. Massaro et al. 2020a). According to mock sample simulations of Massaro et al. (2019, 2020b), if there are two companions at the same redshift (within z < 0.05) within 1.0 Mpc from the blazar and/or 4 companions within 2 Mpc, the probability that the blazar is associated with that group is higher than 95%. Their studies extend only to redshift of 0.15 and are therefore not directly applicable to our objects that are at higher redshifts. Nevertheless, we search for companion galaxies within these two radii. The redshifts of the companion galaxies, with their distance to the central blazar are reported in Sect. 2 of the extra material7. Figure 7 shows the two best examples of companion galaxy redshift distribution. Interestingly, we find for seven objects a group of four or more galaxies within 7.5 arcmin of the blazar. The only object for which we do not find any such group is 3FHL J1555.7+1111; this may be linked to the weakness of the galaxies composing the group found by Johnson et al. (2019). In the case of 3FHL J1546.1+0818 the group is at redshift < 0.1 and therefore likely to be a foreground group. More detailed comparison for individual objects can be found below.
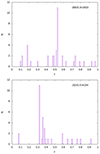 |
Fig. 7. Histograms of companion galaxy redshifts. The redshift bins are 0.01, and the histograms are shown only for sources that have five or more galaxies in one of the redshift bins. |
We also investigated our images searching for faint galaxies that could be observed with dedicated spectroscopic observations. However, many of the objects that are not within SDSS footprint are in very crowded galactic fields (3FHL J1811.3+0341, 3FHL J1931.1+0937, 3FHL J1933.3+0726, 3FHL J1942.7+1033, and 3FHL J2031.0+1936) and identifying faint galaxies in these fields was challenging even from our deep images.
6.1. Notes on individual sources
-
3FHL J0045.3+2127: Spectroscopic redshift z = 0.4253 (Paiano et al. 2020). As our imaging redshift is 0.34 ± 0.07, the host galaxy of this object is more luminous than average host galaxies of BL Lac objects. In SDSS we also find 5 galaxies within 0.6 Mpc (assuming z = 0.42) from the source, suggesting that the source is a member of a rich group of galaxies.
-
3FHL J0148.2+5201: Spectroscopic redshift z = 0.437 (Paiano et al. 2020). As our imaging redshift is 0.38 ± 0.07, the host galaxy is on the brightest edge of the host galaxy brightness distribution. The source is outside of the SDSS footprint.
-
3FHL J0905.5+1357: Two spectroscopic observations separated by about one year interval led to the detection of one emission line. If this line is interpreted as [OIII]b, then z = 0.2239, while if interpreted as [OII] then z = 0.644 (Paiano et al. 2020). Our imaging result is 0.50 ± 0.09. The calculated absolute magnitudes of the host galaxy assuming the two spectroscopic values show that if at z = 0.2239, the galaxy is very faint (MR=-20.9), and we therefore consider z = 0.644 the more likely redshift, even if this indicates a very luminous host galaxy MR = −23.4. We note that even if outside the range suggested by Sbarufatti et al. (2005a) (MR = −22.9, σ = 0.5), the derived MR at z = 0.644 is as bright as the host galaxy of J2245.9+1545. In SDSS we find no galaxies at redshift close to 0.22 within 5 arcsec from the blazar, but there are three galaxies with redshift of z = 0.644 ± 0.05, one of which is the closest companion of the target. We note that there is a group of faint galaxies well visible in our image and for which SDSS does not give a spectroscopic redshift as they are too faint. In summary, z = 0.644 is the likely redshift of this blazar and to establish it we suggest deep low state spectroscopic observations. Additionally, spectroscopic observations of the faint galaxies in the field could be used to establish the presence of a group and hence constrain the redshift and characterise the environment of the BL Lac.
-
3FHL J0915.9+2933: Several featureless high S/N spectra exist (Shaw et al. 2013; Ahumada et al. 2020; Paiano et al. 2017). The determination of the imaging redshift was not successful either (see Sect. 5). However, the field has been extensively investigated by Wittman et al. (2006) in their selection of clusters on the basis of weak lensing shear. They found a cluster candidate, DLCS J0916.0+2931, centred 2.5′ arcmin from the position of the blazar, extending about ten arc minutes in the north-south direction. Subsequent Chandra observations detected two extended X-ray emission regions 3.2 arcmin north and 5.9 arcmin south of the blazar and a possible extended region 27 arcsec from the blazar. The northern and southern X-ray sub-clusters are both at z = 0.53 according to Keck optical (Wittman et al. 2006) and XMM observations (Deshpande et al. 2017). The central sub-cluster could not be detected in XMM observations due to confusion with the strong blazar emission (Deshpande et al. 2017) and optical spectroscopy of its galaxies was not performed. The presence of this extended cluster in the field argues for 3FHL J0915.9+2933 to be a high redshift gamma-ray blazar. In SDSS the closest galaxy has a redshift of 0.489 (assuming this redshift, it is only 200 kpc from the blazar), but within 2 arc minutes (about 800 kpc at those distances) there are also two galaxies at 0.53 (like the DLCS cluster) and a third at 0.487. When we consider the whole area of 7.5 arcmin, there are in total 11 galaxies at z ∼ 0.53. Therefore, from companion galaxy data alone, we cannot conclude the redshift. We simply note that both ‘candidate’ redshifts from the candidate companion galaxy data are rather high. As mentioned in Sect. 5, the imaging observations were not done in a particularly low state of the AGN, and deep imaging in a lower state could allow us to detect the host galaxy and estimate the redshift. However, in the case of this source, the large uncertainties of the imaging redshift would most likely contain all three possible redshift values and therefore a high S/N spectrum obtained during photometric low state would be needed to finally determine the redshift.
-
3FHL J1150.5+4154: White et al. (2000) claimed z = 1.01 for this source, but in literature can be found also several featureless spectra (Shaw et al. 2013; Ahumada et al. 2020; Paiano et al. 2020). The last one has high signal to noise and was obtained in a relatively low state. In this work, we derive an imaging redshift of 0.46 ± 0.09, incompatible with the high redshift suggested by White et al. (2000). Our result is consistent with the lower limit set by Paiano et al. (2020), z > 0.25. In SDSS, 11 nearby galaxies within 3.5 arc minutes (about 1 Mpc at z = 0.32) have spectroscopic redshift z ∼ 0.322–0.328. Our imaging redshift suggests that the blazar is located at higher redshift than this group or that the host galaxy of the blazar is under-luminous MR = −21.8, which we also cannot exclude. However, as discussed in Sect. 5, there is visual indication of gravitational lensing in this field, so even if we were not able to confirm that, we note that the imaging redshift would be also consistent with the group being the gravitational lens.
-
3FHL J1546.1+0818: A spectroscopic lower limit z ≥ 0.513 (Ahumada et al. 2020) has been obtained by SDSS. We observed it using Lick/Shane (Kasai et al. 2023) but we obtained only a low S/N spectrum. The implied high redshift is in agreement with our non-detection of the host galaxy. As mentioned above already, the only group of 4 galaxies in this field has redshift of z ∼ 0.07 and is clearly a foreground group, especially given that the spectroscopic lower limit indicates that 2 Mpc at the redshift of the blazar is smaller than 5 arcmin, while two of the galaxies of this group have a distance to the blazar greater than 6 arcmin. Within this radius there is a group of three galaxies with redshifts 0.55–0.57. The closest companion has redshift of 0.513, exactly at the redshift of the lower limit from spectroscopy and at a distance of ∼285 kpc. In summary, we cannot conclude the redshift, but our lower limit z > 0.5 supports the redshift estimations above.
-
3FHL J1555.7+1111: (also known as PG 1553+113) is a very well known VHE gamma-ray-emitting blazar. There have been multiple attempts of imaging (Scarpa et al. 2000; Treves et al. 2007) and high S/N spectra (Sbarufatti et al. 2006; Aharonian et al. 2008; Landoni et al. 2014) without success. Therefore, it is not surprising that our imaging did not detect any extension of the object, especially as it was taken in a rather high state of the source (see the light curves in Sect. 1 of the extra material8). For this blazar a spectroscopic lower limit z ≥ 0.4131 was reported (Danforth et al. 2010). Furthermore, it is reported to be a member of a galaxy group at z = 0.433 (Johnson et al. 2019; Dorigo Jones et al. 2022) and this gives the strongest constraint on the redshift. Dorigo Jones et al. (2022) reported the spectroscopic redshift z = 0.408–0.436 (95% confidence interval), but these galaxies are too faint for SDSS spectroscopy and therefore do not show up in our search for companions. Indeed in our deep image, we do detect many faint galaxies.
-
3FHL J1811.3+0341: We had previously obtained two featureless medium S/N spectra (Lick/Kast; Kasai et al. 2023). As discussed in Sect. 5, we see some extended emission, but it is too weak to determine the redshift and resulted in z > 0.3. From the light curve it is evident that the timing of the imaging observations was more favourable than the timing of the spectra and therefore deeper spectroscopy should be obtained during a lower optical state to determine the spectroscopic redshift.
-
3FHL J1844.4+1546: We derived lower limit of z > 0.3. We are not aware of previous constraints on the redshift of this source.
-
3FHL J1931.1+0937: The spectroscopic lower limit z ≥ 0.476 (Shaw et al. 2013) is in agreement with our lower limit z > 0.2.
-
3FHL J1933.3+0726: As discussed in Sect. 5, the extension we see is unlikely to be the host galaxy of the source. Kasai et al. (2023) obtained a high S/N Keck/ESI spectrum of this target, which turned out to be featureless (i.e. shows no lines from the extension we see). 3FHL J1933.3+0726 was ∼1 mag brighter during the epoch of the spectrum than during host imaging and the low surface brightness (∼22.4 mag/sq. arcsec) of the nebulosity are likely to be the two main factors contributing to the non-detection in the spectrum. As the object is not within the SDSS footprint, our study does not result in new information about the redshift of the target and it remains unknown.
-
3FHL J1942.7+1033: One featureless high S/N spectrum has been obtained with FORS/VLT (Tsarevsky et al. 2005; Masetti et al. 2013), but we clearly detect the host galaxy and obtain an imaging redshift of z = 0.28 ± 0.06. As the imaging observation was done before the ZTF era, we do not know if the central AGN was in a particularly low state during the imaging, but given the rather low redshift, the spectral lines should be also detectable if spectroscopy was performed in a low state.
-
3FHL J2031.0+1936: The spectroscopic redshift z = 0.3665 (Kasai et al. 2023; Paiano et al. 2023) is in good agreement with our imaging result 0.39 ± 0.08. This is in slight contradiction with the spectroscopic absolute magnitude of Kasai et al. (2023), who reported the host galaxy to be quite luminous MR = −23.5 ± 0.3, whereas our results indicate MR = −22.6 ± 0.1. We reviewed the results by the Kasai et al. (2023) and noticed that they obtain an observed magnitude r = 17.7 for the source while ZTF obtains r = 18.1 around this date. Correcting for this systematic difference, we would obtain MR = −23.1 ± 0.3, compatible with the imaging result. Our observations were performed during a low state of the source as was the Keck/ESI spectroscopic observation that resulted in the detection of the spectral lines and determination of the spectroscopic redshift.
-
3FHL J2156.0+1818: A spectroscopic lower limit z ≥ 0.6347 was obtained by D’Ammando et al. (2024). Our imaging result is in agreement, and this is the most distant host galaxy in our sample for which we have a significant detection of the host galaxy. We derive z = 0.60 ± 0.11. There is a nearby galaxy in SDSS with z = 0.6334 at corresponding distance of 1.16 Mpc, so very close to the spectroscopic lower limit, but at that distance it is likely not the origin of the absorber. Within the radius of 7.5 arcmin there is also one group of 4 galaxies with redshifts 0.51–0.53, but given the likely redshift of > 0.6, all of these galaxies would be outside the 2 Mpc radii and therefore not likely to be associated with the blazar.
-
3FHL J2245.9+1545: A spectroscopic redshift z = 0.5965 was obtained by Kasai et al. (2023), while the imaging redshift is z = 0.44 ± 0.09. So the host galaxy is very luminous, the most luminous in our sample. There is a group of four galaxies at z = 0.43 and the galaxy closest to the blazar belongs to that group. There are no galaxies at the redshift similar to spectroscopic redshift, but given the high redshift, they could be too faint for SDSS.
-
3FHL J2247.9+4413: Two featureless low S/N spectra can be found in the literature (Shaw et al. 2013; Massaro et al. 2015b). A featureless medium S/N Lick/Kast spectrum was reported in Kasai et al. (2023). Our imaging observations took place before the ZTF era, so we cannot evaluate if we did catch the sources in a particularly low state, but the imaging redshift of z = 0.34 ± 0.07 would indicate that with higher S/N, some lines should be detectable.
-
3FHL J2304.7+3705: A featureless low S/N spectrum was shown in (Shaw et al. 2013) and two featureless low S/N Lick/Kast spectra in Kasai et al. (2023). We did not detect the host galaxy and the source is not within the SDSS footprint. However, we estimated the lower limit z > 0.35 for this target.
7. Summary and conclusions
In this work we present the results of a deep I-band imaging campaign of 17 blazars whose gamma-ray flux and spectral shape make them potential targets for the CTAO. At the time of our observations, the redshifts of the sources were unknown and the primary goal was to determine imaging redshifts for them. This was done using two different methods, one using the magnitude of the host galaxy and the other using both magnitudes and effective radii. In addition, we obtained redshifts of galaxies near our targets from the SDSS to further constrain the blazar redshifts.
We were able to detect the host galaxy in 9 out of 17 blazars. The imaging redshifts obtained with the two methods agree within the error bars. The derived imaging redshifts range from 0.28 ± 0.06 to 0.60 ± 0.11, with the latter (3FHL J2156.0+1818) being the most distant blazar for which the redshift has been constrained using this method. There were three targets for which we detect the host galaxy, 3FHL J1150.5+4154, 3FHL J1942.7+1033, and 3FHL J2247.9+4413, but direct spectroscopic observations have not detected any lines. The derived host galaxy magnitudes and parameters indicate that all three have a rather high nucleus to host galaxy ratio, which could partially explain the non-detection of lines. Another explaining factor could be that the imaging observations were taken during a lower state of the nucleus than the spectroscopic observations, but unfortunately in two of the cases the imaging observations were taken before the ZTF era and we could not evaluate this. The success of detecting the host galaxy, despite the high nucleus to host galaxy ratio, shows that in some such cases the imaging redshift may indeed be the only viable way to get information about the source redshift.
We also showed that, in the absence of a spectroscopically determined redshift, it is still possible to obtain useful constraints for z by combining deep imaging, archival spectroscopic data of the galaxy environment of the blazar, and spectroscopic lower limits. For instance, in the case of 3FHL J2156.0+1818, our imaging redshift of 0.60 ± 0.11 was confirmed by spectroscopic observations and we found from SDSS that there is a nearby galaxy located at a similar redshift. All three constraints are in good agreement and can be combined to narrow down the redshift of the object to the range 0.63466 < z < 0.71, with the lower limit being a ‘hard’ limit and the upper limit being a 1-sigma limit from the host galaxy. For 3FHL J0905.5+1357, we detect a host galaxy with a magnitude that clearly favours the higher of the two possible redshifts from Paiano et al. (2020).
Finally, we note that in the case where we also had a spectroscopic redshift of the target and could therefore calculate the absolute magnitudes of the host galaxies, the detected hosts were brighter than what is typically detected for BL Lacs. Our sample is small and we cannot draw any conclusions from this, but it certainly serves as motivation for further studies of BL Lac host galaxies in the future.
Acknowledgments
Based on observations made with the Nordic Optical Telescope, owned in collaboration by the University of Turku and Aarhus University, and operated jointly by Aarhus University, the University of Turku and the University of Oslo, representing Denmark, Finland and Norway, the University of Iceland and Stockholm University at the Observatorio del Roque de los Muchachos, La Palma, Spain, of the Instituto de Astrofisica de Canarias. The data presented here were obtained with ALFOSC, which is provided by the Instituto de Astrofisica de Andalucia (IAA) under a joint agreement with the University of Copenhagen and NOT. Part of this work was supported by the German Deutsche Forschungsgemeinschaft, DFG project number Ts 17/2–1 and Academy of Finland projects 317636, 320045, 346071, and 322535. Funding for the SDSS and SDSS-II has been provided by the Alfred P. Sloan Foundation, the Participating Institutions, the National Science Foundation, the U.S. Department of Energy, the National Aeronautics and Space Administration, the Japanese Monbukagakusho, the Max Planck Society, and the Higher Education Funding Council for England. The SDSS Web Site is http://www.sdss.org/. The SDSS is managed by the Astrophysical Research Consortium for the Participating Institutions. The Participating Institutions are the American Museum of Natural History, Astrophysical Institute Potsdam, University of Basel, University of Cambridge, Case Western Reserve University, University of Chicago, Drexel University, Fermilab, the Institute for Advanced Study, the Japan Participation Group, Johns Hopkins University, the Joint Institute for Nuclear Astrophysics, the Kavli Institute for Particle Astrophysics and Cosmology, the Korean Scientist Group, the Chinese Academy of Sciences (LAMOST), Los Alamos National Laboratory, the Max-Planck-Institute for Astronomy (MPIA), the Max-Planck-Institute for Astrophysics (MPA), New Mexico State University, Ohio State University, University of Pittsburgh, University of Portsmouth, Princeton University, the United States Naval Observatory, and the University of Washington. This work was conducted in the context of the CTAO Consortium.
References
- Abdollahi, S., Acero, F., Ackermann, M., et al. 2020, ApJS, 247, 33 [Google Scholar]
- Abraham, R. G., McHardy, I. M., & Crawford, C. S. 1991, MNRAS, 252, 482 [NASA ADS] [CrossRef] [Google Scholar]
- Aharonian, F., Akhperjanian, A. G., Barres de Almeida, U., et al. 2008, A&A, 477, 481 [NASA ADS] [CrossRef] [EDP Sciences] [Google Scholar]
- Ahumada, R., Allende Prieto, C., Almeida, A., et al. 2020, ApJS, 249, 3 [NASA ADS] [CrossRef] [Google Scholar]
- Ajello, M., Atwood, W. B., Baldini, L., et al. 2017, ApJS, 232, 18 [Google Scholar]
- Ajello, M., Angioni, R., Axelsson, M., et al. 2020, ApJ, 892, 105 [NASA ADS] [CrossRef] [Google Scholar]
- Bertin, E., & Arnouts, S. 1996, A&AS, 117, 393 [NASA ADS] [CrossRef] [EDP Sciences] [Google Scholar]
- Chambers, K. C., Magnier, E. A., & Metcalfe, N., et al. 2016, ArXiv e-prints [arXiv:1612.05560] [Google Scholar]
- Cherenkov Telescope Array Consortium, Acharya, B. S., Agudo, I., et al. 2019, Science with the Cherenkov Telescope Array (World Scientific Publishing Co. Pte. Ltd.) [Google Scholar]
- D’Ammando, F., Goldoni, P., Max-Moerbeck, W., et al. 2024, A&A, 683, A222 [NASA ADS] [CrossRef] [EDP Sciences] [Google Scholar]
- Danforth, C. W., Keeney, B. A., Stocke, J. T., Shull, J. M., & Yao, Y. 2010, ApJ, 720, 976 [NASA ADS] [CrossRef] [Google Scholar]
- Deshpande, A. J., Hughes, J. P., & Wittman, D. 2017, ApJ, 839, 124 [NASA ADS] [CrossRef] [Google Scholar]
- DomÃnguez, A., Primack, J. R., Rosario, D. J., et al. 2011, MNRAS, 410, 2556 [NASA ADS] [CrossRef] [Google Scholar]
- Dorigo Jones, J., Johnson, S. D., Muzahid, S., et al. 2022, MNRAS, 509, 4330 [NASA ADS] [Google Scholar]
- Fioc, M., & Rocca-Volmerange, B. 2019, A&A, 623, A143 [NASA ADS] [CrossRef] [EDP Sciences] [Google Scholar]
- Fukugita, M., Shimasaku, K., & Ichikawa, T. 1995, PASP, 107, 945 [Google Scholar]
- Ghisellini, G., Tavecchio, F., Foschini, L., & Ghirlanda, G. 2011, MNRAS, 414, 2674 [NASA ADS] [CrossRef] [Google Scholar]
- Goldoni, P., Pita, S., Boisson, C., et al. 2021, A&A, 650, A106 [NASA ADS] [CrossRef] [EDP Sciences] [Google Scholar]
- Graham, A. W. 2007, MNRAS, 379, 711 [NASA ADS] [CrossRef] [Google Scholar]
- IceCube Collaboration (Aartsen, M. G., et al.) 2018, Science, 361, eaat1378 [NASA ADS] [Google Scholar]
- Jiang, Y.-F., Greene, J. E., & Ho, L. C. 2011, ApJ, 737, L45 [NASA ADS] [CrossRef] [Google Scholar]
- Johnson, S. D., Mulchaey, J. S., Chen, H.-W., et al. 2019, ApJ, 884, L31 [NASA ADS] [CrossRef] [Google Scholar]
- Kasai, E., Goldoni, P., Pita, S., et al. 2023, MNRAS, 518, 2675 [Google Scholar]
- La Mura, G., Becerra Gonzalez, J., Chiaro, G., Ciroi, S., & Otero-Santos, J. 2022, MNRAS, 515, 4810 [NASA ADS] [CrossRef] [Google Scholar]
- Landoni, M., Falomo, R., Treves, A., & Sbarufatti, B. 2014, A&A, 570, A126 [NASA ADS] [CrossRef] [EDP Sciences] [Google Scholar]
- Mannucci, F., Basile, F., Poggianti, B. M., et al. 2001, MNRAS, 326, 745 [Google Scholar]
- Masetti, N., Sbarufatti, B., Parisi, P., et al. 2013, A&A, 559, A58 [NASA ADS] [CrossRef] [EDP Sciences] [Google Scholar]
- Massaro, E., Maselli, A., Leto, C., et al. 2015a, Ap&SS, 357, 75 [Google Scholar]
- Massaro, F., Landoni, M., D’Abrusco, R., et al. 2015b, A&A, 575, A124 [NASA ADS] [CrossRef] [EDP Sciences] [Google Scholar]
- Massaro, F., Ãlvarez-Crespo, N., Capetti, A., et al. 2019, ApJS, 240, 20 [NASA ADS] [CrossRef] [Google Scholar]
- Massaro, F., Capetti, A., Paggi, A., et al. 2020a, ApJ, 900, L34 [NASA ADS] [CrossRef] [Google Scholar]
- Massaro, F., Capetti, A., Paggi, A., et al. 2020b, ApJS, 247, 71 [Google Scholar]
- Meisner, A. M., & Romani, R. W. 2010, ApJ, 712, 14 [NASA ADS] [CrossRef] [Google Scholar]
- Mishra, S., Chand, H., Krishna, G., et al. 2018, MNRAS, 473, 5154 [NASA ADS] [CrossRef] [Google Scholar]
- Muriel, H., Donzelli, C., Rovero, A. C., & Pichel, A. 2015, A&A, 574, A101 [NASA ADS] [CrossRef] [EDP Sciences] [Google Scholar]
- Nilsson, K., Pursimo, T., Heidt, J., et al. 2003, A&A, 400, 95 [NASA ADS] [CrossRef] [EDP Sciences] [Google Scholar]
- Nilsson, K., Pursimo, T., Villforth, C., et al. 2012, A&A, 547, A1 [NASA ADS] [CrossRef] [EDP Sciences] [Google Scholar]
- Paiano, S., Landoni, M., Falomo, R., et al. 2017, ApJ, 837, 144 [Google Scholar]
- Paiano, S., Falomo, R., Treves, A., & Scarpa, R. 2020, MNRAS, 497, 94 [CrossRef] [Google Scholar]
- Paiano, S., Falomo, R., Treves, A., et al. 2023, MNRAS, 521, 2270 [NASA ADS] [CrossRef] [Google Scholar]
- Pita, S., Goldoni, P., Boisson, C., et al. 2014, A&A, 565, A12 [NASA ADS] [CrossRef] [EDP Sciences] [Google Scholar]
- Rosa González, D., Muriel, H., Mayya, Y. D., et al. 2019, MNRAS, 482, 5422 [CrossRef] [Google Scholar]
- Rovero, A. C., Muriel, H., Donzelli, C., & Pichel, A. 2016, A&A, 589, A92 [NASA ADS] [CrossRef] [EDP Sciences] [Google Scholar]
- Samir, R. M., Takey, A., & Shaker, A. A. 2020, Ap&SS, 365, 142 [NASA ADS] [CrossRef] [Google Scholar]
- Sbarufatti, B., Treves, A., & Falomo, R. 2005a, ApJ, 635, 173 [NASA ADS] [CrossRef] [Google Scholar]
- Sbarufatti, B., Treves, A., Falomo, R., et al. 2005b, AJ, 129, 559 [NASA ADS] [CrossRef] [Google Scholar]
- Sbarufatti, B., Treves, A., Falomo, R., et al. 2006, AJ, 132, 1 [NASA ADS] [CrossRef] [Google Scholar]
- Scarpa, R., Urry, C. M., Falomo, R., Pesce, J. E., & Treves, A. 2000, ApJ, 532, 740 [Google Scholar]
- Schlafly, E. F., & Finkbeiner, D. P. 2011, ApJ, 737, 103 [Google Scholar]
- Shaw, M. S., Romani, R. W., Cotter, G., et al. 2012, ApJ, 748, 49 [CrossRef] [Google Scholar]
- Shaw, M. S., Romani, R. W., Cotter, G., et al. 2013, ApJ, 764, 135 [NASA ADS] [CrossRef] [Google Scholar]
- Stickel, M., Padovani, P., Urry, C. M., Fried, J. W., & Kuehr, H. 1991, ApJ, 374, 431 [Google Scholar]
- Treves, A., Falomo, R., & Uslenghi, M. 2007, A&A, 473, L17 [NASA ADS] [CrossRef] [EDP Sciences] [Google Scholar]
- Tsarevsky, G., de Freitas Pacheco, J. A., Kardashev, N., et al. 2005, A&A, 438, 949 [NASA ADS] [CrossRef] [EDP Sciences] [Google Scholar]
- Urry, C. M., & Padovani, P. 1995, PASP, 107, 803 [NASA ADS] [CrossRef] [Google Scholar]
- Wakely, S. P., & Horan, D. 2008, Int. Cosmic Ray Conf., 3, 1341 [NASA ADS] [Google Scholar]
- White, R. L., Becker, R. H., Gregg, M. D., et al. 2000, ApJS, 126, 133 [NASA ADS] [CrossRef] [Google Scholar]
- Wittman, D., Dell’Antonio, I. P., Hughes, J. P., et al. 2006, ApJ, 643, 128 [NASA ADS] [CrossRef] [Google Scholar]
- Wurtz, R., Stocke, J. T., Ellingson, E., & Yee, H. K. C. 1997, ApJ, 480, 547 [NASA ADS] [CrossRef] [Google Scholar]
Appendix A: Additional figure
A more complete version of Fig. 2, the results of the AGN + host galaxy decomposition, is presented in Fig. A.1.
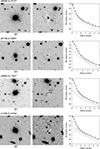 |
Fig. A.1. Results of the AGN + host galaxy decomposition. Left panel: Grey-scale image of the target. North is up, and east is to the left. The field of view is given under the figure. Middle panel: Same image after subtracting the model. Right panel: Radial surface brightness profiles of the target (filled symbols), model (solid line), AGN nucleus (dashed line), and host galaxy (dot dashed line). |
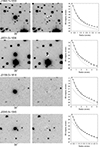 |
Fig. A.1. Continued. |
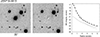 |
Fig. A.1. Continued. |
All Tables
Comparison of host-galaxy-based redshift estimates to spectroscopically measured redshifts.
All Figures
|
Fig. 1. Example of ten runs with the ‘Kormendy’ method for J0045.3+2127. Each run starts at z = 0.05 in the lower left corner, moves up and right as z is increased and ends at z = 0.8 as indicated by colour. The line indicates the Kormendy relation of Eq. (4). |
| In the text | |
|
Fig. 2. Example of the AGN + host galaxy decomposition. The complete results are presented in Appendix A. Left panel: Grey-scale image of the target. North is up, and east is to the left. The field of view is given under the figure. Middle panel: Same image after subtracting the model. Right panel: Radial surface brightness profiles of the target (filled symbols), model (solid line), AGN nucleus (dashed line), and host galaxy (dot dashed line). |
| In the text | |
|
Fig. 3. Results of the AGN + host galaxy decomposition of J1811+0341. The panels are the same as in Fig. 2. |
| In the text | |
|
Fig. 4. Upper row, left: 3FHL J0915.9+2933 after subtracting the PSF + host galaxy model. The field of view is 27 × 27 arcsec. Upper row, right: Same target from Nilsson et al. (2003). Lower row, left: 21 × 21 arcsec field around 3FHLJ 1933.3+0726. Lower row, right: Same field after subtracting the PSF from bright sources in the field and from the blazar. |
| In the text | |
|
Fig. 5. 4.3 × 4.3 arcmin field around 3FHL J1150.5+4154. The blazar is indicated by tick marks. |
| In the text | |
|
Fig. 6. Comparison of redshifts obtained spectroscopically and via the host galaxy method. Grey symbols show earlier results and blue symbols the results obtained in this paper. Open and filled symbols denote R-band and I-band detections, respectively (see Table 4 and the main text for details). The line shows a perfect correspondence. |
| In the text | |
|
Fig. 7. Histograms of companion galaxy redshifts. The redshift bins are 0.01, and the histograms are shown only for sources that have five or more galaxies in one of the redshift bins. |
| In the text | |
|
Fig. A.1. Results of the AGN + host galaxy decomposition. Left panel: Grey-scale image of the target. North is up, and east is to the left. The field of view is given under the figure. Middle panel: Same image after subtracting the model. Right panel: Radial surface brightness profiles of the target (filled symbols), model (solid line), AGN nucleus (dashed line), and host galaxy (dot dashed line). |
| In the text | |
|
Fig. A.1. Continued. |
| In the text | |
|
Fig. A.1. Continued. |
| In the text | |
Current usage metrics show cumulative count of Article Views (full-text article views including HTML views, PDF and ePub downloads, according to the available data) and Abstracts Views on Vision4Press platform.
Data correspond to usage on the plateform after 2015. The current usage metrics is available 48-96 hours after online publication and is updated daily on week days.
Initial download of the metrics may take a while.