Fig. 6.
Download original image
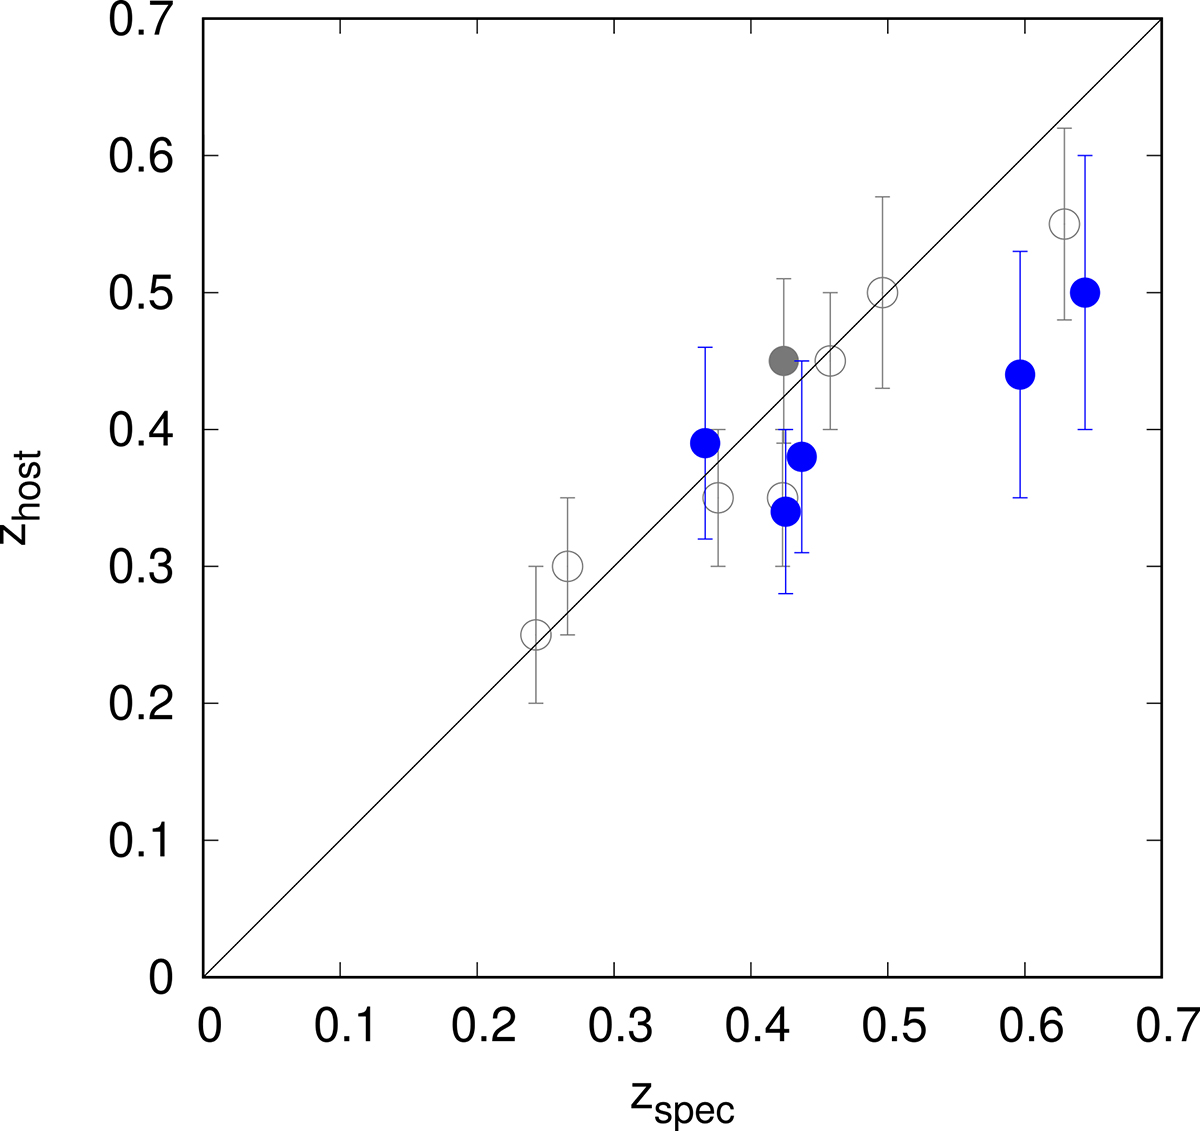
Comparison of redshifts obtained spectroscopically and via the host galaxy method. Grey symbols show earlier results and blue symbols the results obtained in this paper. Open and filled symbols denote R-band and I-band detections, respectively (see Table 4 and the main text for details). The line shows a perfect correspondence.
Current usage metrics show cumulative count of Article Views (full-text article views including HTML views, PDF and ePub downloads, according to the available data) and Abstracts Views on Vision4Press platform.
Data correspond to usage on the plateform after 2015. The current usage metrics is available 48-96 hours after online publication and is updated daily on week days.
Initial download of the metrics may take a while.