| Issue |
A&A
Volume 680, December 2023
|
|
|---|---|---|
| Article Number | A52 | |
| Number of page(s) | 6 | |
| Section | Extragalactic astronomy | |
| DOI | https://doi.org/10.1051/0004-6361/202245574 | |
| Published online | 15 December 2023 | |
Statistical redshift of the very-high-energy blazar S5 0716+714
1
Instituto de Astronomía y Física del Espacio (IAFE (CONICET-UBA)), Av. Int. Guiraldes 2620, C1428BNB CABA, Argentina
e-mail: This email address is being protected from spambots. You need JavaScript enabled to view it.
2
Instituto de Investigaciones en Astronomía Teórica y Experimental (IATE (CONICET-UNC)), Laprida 854, X5000BGR Córdoba, Argentina
3
Observatorio Astronómico de Córdoba, Universidad Nacional de Córdoba, Córdoba, Argentina
4
Instituto Nacional de Astrofísica, Optica y Electrónica, Tonantzintla, 72840 Puebla, Mexico
5
Instituto de Astrofísica de Canarias, C/ Vía Láctea s/n, 38205 La Laguna, Spain
6
Departamento de Astrofísica, Universidad de La Laguna, 38206 La Laguna, Spain
7
Institute of Astronomy, University of Cambridge, Cambridge CB3 0HA, UK
Received:
29
November
2022
Accepted:
25
September
2023
Abstract
Context. Blazars are the most numerous class of very-high-energy (VHE; E > 100 GeV) gamma-ray emitters. At present, measured redshifts are available only for about 80% of the VHE gamma-ray sources; this is mainly due to the difficulty in measuring reliable redshifts from their nearly featureless continuum optical spectra.
Aims. As the VHE sky is still vastly unexplored, VHE blazars are unique objects. High-energy spectra from blazars are used for extragalactic background light studies, to investigate topics related to cosmology or fundamental physics, and to find the source luminosity. This allows one to study the properties of the host galaxy, its black hole, and the gamma-ray emission mechanisms. All of these studies require suitable estimations of the blazar distance, which has motivated the use of novel approaches when measuring the redshift of faint optical lines in their spectra is very uncertain.
Methods. We present the new optical spectroscopic observations of S5 0716+714 and its environment taken on December 20, 2019, with the Gemini GMOS North telescope.
Results. We do not find any absorption lines in the blazar spectrum; however, we were able to get the redshifts of 21 other galaxies in the field, 15 of which form a group at z = 0.2304 ± 0.0013. Performing a population study of galaxies, we found that S5 0716+714 belongs to this group with a probability > 99%.
Key words: BL Lacertae objects: individual: S5 0716+714 / galaxies: distances and redshifts / gamma rays: galaxies
© The Authors 2023
 Open Access article, published by EDP Sciences, under the terms of the Creative Commons Attribution License (https://creativecommons.org/licenses/by/4.0), which permits unrestricted use, distribution, and reproduction in any medium, provided the original work is properly cited.
This article is published in open access under the Subscribe to Open model. This email address is being protected from spambots. You need JavaScript enabled to view it. to support open access publication.
1. Introduction
Blazars constitute a subclass of jetted active galactic nuclei (AGNs) that host relativistic jets closely aligned to the observer’s line of sight. Typically, they are hosted by elliptical galaxies and powered by massive (108 − 10 solar mass) black holes (e.g., Urry & Padovani 2000; Shaw et al. 2012). According to a unified model of radio-loud AGNs based on the angle between the line of sight and the approaching relativistic jet, the blazar jet makes an angle up to 10° from the observer’s line of sight (e.g., Urry & Padovani 1995). This boosts all photons produced in the blazar to higher energies (e.g., Ghisellini 2013; Romero & Vila 2014), allowing their detection at very high energy (VHE, E > 100 GeV).
Blazars are broadly classified into two subsets, consisting of BL Lacertae objects (BL Lacs) and flat spectrum radio quasars (FSRQs). The main distinctive feature between both types is the presence of bright and prominent emission lines in the optical spectra of FSRQs and their weakness, or even absence, in BL Lacs (e.g., Ghisellini et al. 2011). Blazars are also the largest known population of gamma-ray objects (Acero et al. 2015; Abdollahi et al. 2020). In the VHE regime, the current generation of Imaging Atmospheric Cherenkov Telescopes (H.E.S.S., MAGIC, and VERITAS) have detected 77 blazars, of which 68 are BL Lacs (Wakely & Horan 2008).
Very-high-energy blazars can be used to probe star formation across the history of the Universe. The stellar optical and near-infrared radiation, the so-called extragalactic background light (EBL; e.g., Hauser & Dwek 2001; Biteau & Williams 2015; H.E.S.S. Collaboration 2017; Desai et al. 2018; Abeysekara et al. 2019; Acciari et al. 2019), acts as a source of opacity for the gamma rays from blazars. This effect can be used to derive, within the same fitting process, the properties of the EBL from its imprint on the VHE spectrum of blazars and the intrinsic VHE spectra of the source (e.g., Domínguez & Ajello 2015). The EBL effect in the observed spectra is more evident in distant blazars, at z > 0.5. The propagation of VHE gamma rays can also be used to investigate topics related to cosmology or fundamental physics, such as dark matter annihilation and decay, and Lorentz invariance violation (e.g., Actis et al. 2011).
The determination of redshifts is crucial to perform the studies mentioned above, and to find the source luminosity, which allows one to deduce the properties of the host galaxy, its black hole, and to model the system’s emission mechanism. From the cataloged VHE blazars (Wakely & Horan 2008), ∼80% have estimated redshifts, either measured or inferred from the gamma-ray absorption. Several unsuccessful attempts have been made to determine redshifts for the remaining 20%. The main difficulty is the weakness of the emission and absorption lines in their spectra, which very often are not distinguishable at all, even though these objects are quite bright in the integrated broadband light (e.g., Landt et al. 2002; Sbarufatti et al. 2005). If no intrinsic spectral features are observed, limits on the redshift may be set by the detection (or lack thereof) of absorption systems in the line of sight toward the source.
Considering that many blazars are embedded in a galaxy cluster and that its vicinity is poorly characterized in general, an indirect method could be to associate the blazar with a nearby galaxy cluster. Several attempts have been made in the past to relate the blazar to the nearby galaxy cluster (e.g., Pesce et al. 1995; Butcher et al. 1976). A novel statistical procedure has been proposed by which a blazar is associated with a galaxy cluster and its redshift assigned to the blazar with a given probability (Muriel et al. 2015).
S5 0716+714 is one of the most bright and extensively studied blazars in the sky due to its extreme variability in all measured energy bands. It was discovered in the 5 GHz Bonn National Radio Astronomy Observatory radio survey (Kuehr et al. 1981), and classified as a BL Lac by Biermann et al. (1981). Afterwards it was classified as an intermediate-frequency synchrotron-peaked BL Lac type object by Giommi et al. (1999). The source is included in all the Fermi-LAT catalogs (Abdo et al. 2009; Nolan et al. 2012; Acero et al. 2015; Abdollahi et al. 2020). It was also detected in the VHE gamma-ray regime with MAGIC telescopes in 2008 (Anderhub et al. 2009).
There were several failed attempts to find the redshift of S5 0716+714 using optical observations (Stickel et al. 1993; Rector & Stocke 2001; Finke et al. 2008; Shaw et al. 2013). From optical images, Sbarufatti et al. (2005) set a lower limit of z > 0.5, and a few years afterwards, Nilsson et al. (2008) provided an imaging redshift of z ∼ 0.3 based on the marginal detection of the host galaxy. Danforth et al. (2013) used the Lyα forest method to set a statistical constraint on its redshift of 0.2315 < z < 0.322. Also, Stickel et al. (1993) suggested that S5 0716+714 could be associated with a nearby pair of galaxies at z = 0.26. Finally, Paiano et al. (2017) obtained a featureless optical spectrum with the Gran Telescopio Canarias (GTC), and set a lower limit of z > 0.10, using a technique based on the minimum equivalent width (EW) measured in the spectrum. Considering the EBL absorption in the VHE band and using the drop between high-energy (HE) and VHE gamma-ray bands, several observations led to different upper limits on the source redshift: z < 0.5 (Anderhub et al. 2009) and z < 0.21 (Prandini et al. 2010), though these depend on the poorly characterized cosmic infrared background. Dorigo Jones et al. (2022) used the archival COS G130M + G160M far-ultraviolet (FUV) spectra of S5 0716+714 to identify the highest-redshift Lyα absorption line. They inferred a redshift constraint for S5 0716+714 of 0.227 < z < 0.254. However, they suggest that further deep galaxy surveys toward this blazar are necessary to confirm its redshift.
In this work we present multi-object spectroscopic (MOS) observations of the blazar S5 0716+714 and several objects in the field of view from high signal-to-noise ratio (S/N) data obtained with GMOS-N at Gemini. We characterize the surroundings of the blazar and estimate its redshift using the statistical approach which allows one to determine the probability that the object is a member of a galaxy cluster. In Sect. 2, we describe the observations and data reduction; in Sect. 3, we present the analysis and discuss the results; and Sect. 4 summarizes the results.
2. Observations and data reduction
We have obtained medium resolution spectra of S5 0716+714 and 22 other objects present in the field that covers ∼5 × 5 arcmin2 centered on the blazar. Spectra were obtained under queue program GN-2019B-Q-225 (PI: Pichel). We obtained the pre-image data shown in Fig. 1 on September 26, 2019. This image consists of 3 × 60 s exposures in the Sloan r′ (G0326) filter. A binning of 2 × 2 pixels was used, resulting in a spatial scale of 0.16 arcsec per pixel. The pre-image was used for target selection. Galaxies were selected around the blazar when their integrated magnitudes were not fainter than r′ = 22.5. This criterion ensures obtaining spectra with a reasonable S/N > 5. The center and the position angle of the image were also chosen to maximize the number of slits in the mask, which was designed by the slit-positioning algorithm (SPA)1. This algorithm determines which objects is placed on the mask according to the priority and position on the frame. SPA ensures that there is at least a two-pixel separation between adjacent slits to avoid superposition. Selected objects were given priority according to their magnitudes and positions within the field. The highest priority was given to those galaxies that were not close to the edges of the field or the gaps between the detectors. The same priority was given to those galaxies with total magnitudes brighter than 22.5. A total of 22 slits were placed on the mask. However, the object under slit 4 turned out to be a pair of interacting galaxies, with the secondary galaxy two magnitudes fainter than the primary.
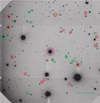 |
Fig. 1. GMOS image of the field around S5 0716+714. Galaxies selected for spectroscopy are labeled with the corresponding slit number. The magenta circle corresponds to the blazar (slit number 1). The bar at the bottom of the image indicates 1 arcmin. North is at the top and east is to the left. Group members are shown in red. The object under slit 4 is an interacting pair of galaxies. The fainter galaxy in this pair has the label #23. The faint galaxy identified by Bychkova et al. (2006) is labeled “By”. |
Spectra were taken with GMOS North configured with the B600 ± G5323 grating. This leads to a dispersion of ∼0.9 Å per pixel, and a resolution of FWHM ∼ 5 Å. Slit dimensions were 1″ wide by 4″ long in order to ensure a good sky subtraction. The spectra were acquired on December 20, 2019, under very good seeing conditions (FWHM ∼ 0.8 arcsec). A total of 5 × 900 s exposures were obtained at three different central wavelengths (590 nm, 600 nm, and 610 nm) in order to remove the gaps between the CCDs. Spectra typically cover the wavelength range 400−700 nm, but the exact range for each spectrum depends on the slit position on the mask. Flat fields, spectra of the spectrophotometric star Wolf 346, and the copper-argon CuAr lamp were also acquired for flux and wavelength calibrations.
Images and spectra were reduced following standard recipes with IRAF2 and the Gemini package under IRAF. The total magnitudes of the galaxies were measured using the phot task within IRAF on the processed, sky-subtracted pre-image. Magnitudes were computed according to the following expression: m = ZP − 2.5 log(Ne/t)−k(AM − 1), where ZP is the photometric zero point; Ne is the background-subtracted number of electrons within the aperture; t is the exposure time; k is the median atmospheric extinction at the Gemini North Observatory, which has a mean value of 0.11; and AM is the airmass. The zero point was obtained from the GMOS-N nightly averaged zero-point values. The errors of the calculated magnitudes are smaller than 0.06 mag. Further details on the reduction process can be seen in Rovero et al. (2016).
3. Results
Figure 2 shows the reduced, flux calibrated spectrum of the blazar. It can be appreciated that the spectrum only shows telluric absorption lines and bands plus galactic Na at 5892 Å. A wavy continuum at wavelengths shorter than 5600 Å is also seen. This is due to the differences in quantum efficiency among the GMOS Hamamatsu detectors, plus probably some flat field issues (Gimeno et al. 2016). Observed field objects are listed in Table 1. The slit number, target coordinates (J2000.0), Sloan r′ magnitude, measured redshift, projected radius to the blazar in arcminutes and kiloparsecs, as well as the presence of emission lines (EL) are given. Redshifts were derived using the IRAF fxcor routine. This task essentially computes radial velocities by deriving the Fourier cross correlation between two spectra. Several spectra obtained during previous Gemini runs were used as a template. However, fxcor does not work properly with noisy spectra, in which case we manually calculated the redshifts identifying at least three absorption or emission lines. Errors in the redshift determination were never higher than 0.0007.
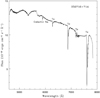 |
Fig. 2. Optical spectrum of the VHE blazar S5 716+715. Galactic and telluric lines are indicated. |
Observed objects in the field of S5 0716+714 (slit 1).
Within the same field of view of GMOS around S5 0716+714, previous studies have reported redshift estimates of five galaxies. Stickel et al. (1993) observed two galaxies that correspond to our slits 2 and 3, and their reported redshift values are consistent with our own as shown in Table 1. Bychkova et al. (2006) identified three galaxies, two of which also match our slits 2 and 3 and have similar redshift estimates. The third object, a faint galaxy (J072154.96+712011.2, mHST = 22.1), has a redshift of 0.249. It is labeled with “By” in Fig. 1 and was added to Table 1 as object 24. Additionally, Keeney et al. (2018) reported two galaxies that correspond to our slits 12 and 13 and have redshift estimates that coincide with our values. In summary, there are five previously reported galaxies with spectroscopic redshift estimates in the field of view of S5 0716+714, four of which are included in our sample and have very similar redshift values. The remaining galaxy has a redshift of 0.249.
If S5 0716+714 is located in a galaxy with a redshift of approximately 0.7 or higher, we can estimate its absolute magnitude. By using the apparent magnitude in filter B, which was measured by Finke et al. (2008) to be 13.39, we can determine that the absolute magnitude of the BL Lac falls between −28.8 and −30.26. This calculation was performed using the K correction suggested by Fan & Lin (2000). The quoted range of magnitudes is due to the uncertainty in the spectral index (α) in the optic. We tested two extreme values of α, which are 1 and 1.8. Even with the lowest absolute magnitude, we still find the BL Lac would be extremity bright (e.g., Zeng et al. 2014; Chiang & Mukherjee 1998), which leads us to conclude that the probability of S5 0716+714 being located at a redshift of 0.7 or higher is negligible. We should also consider that S5 0716+714 is a blazar detected at VHE gamma rays. As mentioned above, the EBL effect on the VHE spectra of distant sources is severe, making the detection of blazars at VHE with current instrumentation for large redshifts difficult. The redshift distribution for VHE BL Lacs (with a mean redshift of 0.1668 and a standard deviation of 0.1205) does indeed drop at z = 0.2. The farthest BL Lac is at z < 0.7, and only two FSRQ blazars are at z ∼ 1.0 (Wakely & Horan 2008). With S5 0716+714 being a BL Lac detected at VHE, it is very unlikely (> 3.5σ) to find the blazar at z > 0.6.
As seen in Table 1 and Fig. 3, the redshift distribution around S5 0716+714 clearly shows the existence of a group or cluster of galaxies with at least 15 spectroscopic members (shown with red circles in Fig. 1). Using the 15 members with a measured spectroscopic redshift, we estimated a mean redshift (zmean) of 0.2304 ± 0.0013 and a velocity dispersion (σv) of 379 km s−1 using the Gapper estimator (Beers et al. 1990). According to (Munari et al. 2013), this velocity dispersion is equivalent to a total mass M200 of about 4.4  , which corresponds to a system of galaxies between a high-mass group and a low-mass cluster.
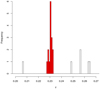 |
Fig. 3. Redshift distribution in the range 0.20−0.27 of the galaxies with measured z observed in the field of view of S5 0716+714 (see Table 1). Group members are shown in red. The galaxy 15 with a redshift of 0.4873 was removed from the plot to distinguish the largest group better. |
At redshifts higher than the group located at z = 0.2304, there are five galaxies with redshift determinations ranging from 0.249 to 0.2646. These galaxies occupy slits 2, 3, 12, 22, and 24 (the faint galaxy observed by Bychkova et al. 2006). If these five galaxies were part of a group, their velocity dispersion would be 1500 km s−1, rendering this hypothesis unlikely. The galaxies in slits 3 and 22 exhibit a velocity difference of 30 km s−1 and are separated by a projected distance of approximately 100 kpc on the plane of the sky, suggesting with high likelihood that they form a physical pair. It is important to mention that beyond the GMOS field of view, there is the galaxy cluster ZwCl 0714.8+7140 at z = 0.268. Although this cluster is more than 1000 km s−1 away and located 3 Mpc in projected distance from the pair, it cannot be ruled out that the galaxies in slits 3 and 22 reside within the infall region of ZwCl 0714.8+7140. Hence, it is also plausible that the host galaxy of S5 0716+714, which is situated at 3.5 Mpc from the cluster center, is also a field galaxy in the infall region of the cluster. As for the galaxies in slits 2 and 12, despite their small relative velocity difference (360 km s−1), the projected angular distance between them is 715 kpc, making it unlikely for them to be considered a physical pair. Instead, they would be classified as two field galaxies.
BL Lacs are active nuclei hosted by massive early-type galaxies. Muriel (2016) found that more than two-thirds of BL Lacs are found in galaxy systems, so it is natural to assume that S5 0716+714 is hosted by a member of the group at z = 0.2304. In order to test this possibility, we applied the procedure proposed in Muriel et al. (2015) and improved upon in Rovero et al. (2016) and Rosa González et al. (2019) to estimate the probability that S5 0716+714 is a member of the group or cluster of galaxies at z = 0.2304 described in the previous paragraph. The method is summarized below (see Muriel et al. 2015; Rovero et al. 2016; Rosa González et al. 2019 for more details).
The method requires a deep and high-quality catalog of groups of galaxies. We used the inner field of the zCOSMOS 20k group catalog (Knobel et al. 2012, hereafter 20k catalog), which includes 1498 groups of galaxies over the redshift range 0.1 ≲ z ≲ 1.0. The idea of the procedure is to evaluate the probability (hereafter P15) of finding, by chance, a single observation similar to ours (similar magnitude limit, completeness, and field of view), a group of galaxies with fifteen or more members within the field of the 20k catalog.
Before computing P15, there were some aspects we need to take into account. Our spectroscopic targets were limited by the number of slits we could accommodate. We also had to take into account that the 20k catalog is deeper than the observation reported in this work. To solve these problems, we constructed a new catalog (hereafter the pruned catalog) by selecting galaxies from the 20k catalog with the same magnitude distribution as our observed sample around S5 0716+714. Therefore, we have restricted the catalog to members with redshifts within the depth of our observations. Consequently, some galaxies in the 20k catalog would be too faint for our observations and the richness of some groups would be reduced accordingly in the pruned catalog.
To account for the incompleteness of our sample, we constructed 100 pruned catalogs by using different seeds. Each random realization selects galaxies in groups of the 20k catalog, that is, each realization has a new configuration of groups. The surviving groups and their richness can change from one pruned catalog to another. In order to estimate the probability of finding a group by chance, we used a Monte Carlo procedure selecting random positions within the field of view of each of the pruned catalogs. These positions are used to search for coincidences with groups of galaxies with fifteen or more members. We consider there to be a coincidence if the projected distance between the random position and the center of a group is ≤rvir, where rvir is the virial radius as defined by Knobel et al. (2012). As a result of applying this procedure to the 100 pruned catalogs, we found that the probability of finding a group or cluster of fifteen or more members in an observation such as ours by chance is P15 = (2.2 ± 1.4%). The error corresponds to the standard deviation from the 100 values obtained by each of the pruned catalogs. Considering that the number of members of the new group or cluster is a lower limit, this probability should be taken as an upper limit.
In order to assess the likelihood of the existence of a group of galaxies that has remained undetected within the scope of our observations, we have gathered a compilation of galaxy samples from observations conducted in Rovero et al. (2016), Madrid et al. (2018), Pichel et al. (2021), and in the present work. These samples consist of galaxies that satisfy all the observational criteria of the present work. The studies in question have collectively identified 101 galaxies, allowing for the measurement of the redshift in 77 cases (comprising 48 galaxies with emission lines and 29 galaxies exhibiting absorption lines). Upon analyzing magnitude bins, we observed that there is no discernible magnitude-related influence on our capacity to measure redshifts up to approximately r ∼ 22.5. Furthermore, we have not identified any correlation between the obtained redshift and the presence or absence of emission lines, or the apparent magnitude. In brief, for galaxies brighter than r ∼ 22.5, we were able to determine the redshift for approximately 76% of the selected targets. To gauge the implications of these percentages on our capability to detect galaxy groups, we have selected galaxies within groups from the Knobel et al. (2012) sample falling within the redshift range 0.5−0.6. We find that approximately 60% of these galaxies are brighter than r ∼ 22.5. Considering that redshift information can be obtained for around 76% of galaxies up to this magnitude, we can expect to ascertain redshifts for roughly 45% (0.6 × 0.76) of the galaxies belonging to Knobel-like groups within the redshift range 0.5−0.6, with a higher percentage for groups in close proximity. It is worth mentioning our work Rovero et al. (2016), where we identified a group or cluster of galaxies at z = 0.6010 with eight members. Considering that for the present study we identified only one galaxy with z > 0.3, the likelihood of an undetected group of galaxies along the line of sight of S5 0716+714 is notably low, at least up to z ∼ 0.6.
If the group or cluster of galaxies found in the line of sight of S5 0716+714 does not host the BL Lac, it is very likely that the host galaxy is an isolated object such as those previously discussed in the redshift range 0.249−0.2646. As already mentioned, (Muriel 2016) found that at least 67 ± 8% of the BL Lacs are hosted by galaxies that are members of clusters or groups of galaxies. Therefore, the probability of having an isolated host of the BL Lac is Pih ≲ 0.3, which is independent of the probability of finding a group in the field of view of S5 0716+714 by chance.
The probability of S5 0716+714 not being associated with the group or cluster of 15 members is the joint probability of having both an isolated BL Lac (33 ± 8%) and a group or cluster by chance (2.2 ± 1.4%), that is Pih × P15 = 0.7 ± 0.4% (the error was computed using propagation of uncertainties). Therefore, the probability of S5 0716+714 being a member of the group or cluster at z = 0.2304 would be more than 99%. In other words, in order to find a group or cluster of galaxies as rich as the one observed around S5 0716+714, we would have to make more than 100 similar observations centered at random positions.
4. Conclusions
Blazars are the rarest class of active galactic nuclei; even so, they are the largest known population of extragalactic sources in the gamma-ray sky. Given the importance of these types of objects for VHE astronomy, every effort is relevant to estimate their redshifts. S5 0716+714 is a blazar of the BL Lac type with an unknown redshift. It is a VHE blazar detected at HE by Fermi-LAT and at VHE with MAGIC. Various attempts were made in the past to determine its distance with relative success. We have obtained new spectroscopic observations with GEMINI-N using GMOS and we have observed the blazar itself and 22 other objects centered in S5 0716+714. The observed spectrum of the blazar in the range 4800−8000 Å shows only telluric absorption lines and bands plus galactic Na at 5892 Å. This lack of absorption features in the spectrum is expected for this class of object. From the objects observed in the field, we measured 21 (mostly) new redshifts, 15 of which belong to a giant group at the same distance. Using a statistical procedure (Rovero et al. 2016) in addition to a new statistical analysis that evaluates the possible existence of an undetected group of galaxies, we have inferred that the blazar should belong to that group with a probability > 99%. Thus, our estimation of the redshift of S5 0716+714 is z = 0.2304 ± 0.0013 (the quoted uncertainty corresponds to the velocity dispersion of the parent group). Within uncertainties, this new result is consistent with previous spectroscopic results with the GTC in the optical (Paiano et al. 2017), with HST in the UV (Danforth et al. 2013), based on the photometric detection of the host galaxy (Nilsson et al. 2008), with an association with a pair of nearby galaxies (Stickel et al. 1993), and reanalyzing old observations with the HST (Dorigo Jones et al. 2022). This is also consistent with the redshift estimation based in the HE-VHE drop of the spectrum considering the EBL absorption in the VHE band (Anderhub et al. 2009; Prandini et al. 2010).
IRAF is distributed by the National Optical Astronomy Observatories, which is operated by the Association of Universities for Research in Astronomy, Inc. (AURA) under the cooperative agreement with the National Science Foundation.
Acknowledgments
We sincerely thank the anonymous referee for the valuable comments and suggestions. This work is based on observations obtained at the Gemini Observatory, which is operated by the Association of Universities for Research in Astronomy, Inc., under a cooperative agreement with the NSF on behalf of the Gemini partnership: the National Science Foundation (USA), the National Research Council (Canada), CONICYT (Chile), the Australian Research Council (Australia), Ministério da Ciência, Tecnologia e Inovação (Brazil) and Ministerio de Ciencia, Tecnología e Innovación Productiva (Argentina). A.P., C.D., H.M., and A.C.R. are members of the Carrera del Investigador Científico of CONICET, Argentina.
References
- Abdo, A. A., Ackermann, M., Ajello, M., et al. 2009, ApJS, 183, 46 [NASA ADS] [CrossRef] [Google Scholar]
- Abdollahi, S., Acero, F., Ackermann, M., et al. 2020, ApJS, 247, 33 [Google Scholar]
- Abeysekara, A. U., Archer, A., Benbow, W., et al. 2019, ApJ, 885, 150 [NASA ADS] [CrossRef] [Google Scholar]
- Acciari, V. A., Ansoldi, S., Antonelli, L. A., et al. 2019, MNRAS, 486, 4233 [NASA ADS] [CrossRef] [Google Scholar]
- Acero, F., Ackermann, M., Ajello, M., et al. 2015, ApJS, 218, 23 [Google Scholar]
- Actis, M., Agnetta, G., Aharonian, F., et al. 2011, Exp. Astron., 32, 193 [NASA ADS] [CrossRef] [Google Scholar]
- Anderhub, H., Antonelli, L. A., Antoranz, P., et al. 2009, ApJ, 704, L129 [NASA ADS] [CrossRef] [Google Scholar]
- Beers, T. C., Flynn, K., & Gebhardt, K. 1990, AJ, 100, 32 [Google Scholar]
- Biermann, P., Duerbeck, H., Eckart, A., et al. 1981, ApJ, 247, L53 [CrossRef] [Google Scholar]
- Biteau, J., & Williams, D. A. 2015, ApJ, 812, 60 [CrossRef] [Google Scholar]
- Butcher, H. R., Oemler, A., Jr., Tapia, S., & Tarenghi, M. 1976, ApJ, 209, L11 [NASA ADS] [CrossRef] [Google Scholar]
- Bychkova, V. S., Kardashev, N. S., Boldycheva, A. V., Gnedin, Y. N., & Maslennikov, K. L. 2006, Astron. Rep., 50, 802 [NASA ADS] [CrossRef] [Google Scholar]
- Chiang, J., & Mukherjee, R. 1998, ApJ, 496, 752 [NASA ADS] [CrossRef] [Google Scholar]
- Danforth, C. W., Nalewajko, K., France, K., & Keeney, B. A. 2013, ApJ, 764, 57 [NASA ADS] [CrossRef] [Google Scholar]
- Desai, A. A., Ajello, M., Paliya, V., et al. 2018, Am. Astron. Soc. Meet. Abstr., 231, 123.04 [NASA ADS] [Google Scholar]
- Domínguez, A., & Ajello, M. 2015, ApJ, 813, L34 [CrossRef] [Google Scholar]
- Dorigo Jones, J., Johnson, S. D., Muzahid, S., et al. 2022, MNRAS, 509, 4330 [NASA ADS] [Google Scholar]
- Fan, J. H., & Lin, R. G. 2000, ApJ, 537, 101 [NASA ADS] [CrossRef] [Google Scholar]
- Finke, J. D., Shields, J. C., Böttcher, M., & Basu, S. 2008, A&A, 477, 513 [NASA ADS] [CrossRef] [EDP Sciences] [Google Scholar]
- Ghisellini, G. 2013, Radiative Processes in High Energy Astrophysics (Switzerland: Springer International Publishing), 873 [Google Scholar]
- Ghisellini, G., Tavecchio, F., Foschini, L., & Ghirlanda, G. 2011, MNRAS, 414, 2674 [NASA ADS] [CrossRef] [Google Scholar]
- Gimeno, G., Roth, K., Chiboucas, K., et al. 2016, Proc. SPIE, 9908, 99082S [NASA ADS] [CrossRef] [Google Scholar]
- Giommi, P., Massaro, E., Chiappetti, L., et al. 1999, A&A, 351, 59 [NASA ADS] [Google Scholar]
- H.E.S.S. Collaboration (Abdalla, H., et al.) 2017, A&A, 606, A59 [NASA ADS] [CrossRef] [EDP Sciences] [Google Scholar]
- Hauser, M. G., & Dwek, E. 2001, ARA&A, 39, 249 [Google Scholar]
- Keeney, B. A., Stocke, J. T., Pratt, C. T., et al. 2018, ApJS, 237, 11 [NASA ADS] [CrossRef] [Google Scholar]
- Knobel, C., Lilly, S. J., Iovino, A., et al. 2012, ApJ, 753, 121 [Google Scholar]
- Kuehr, H., Witzel, A., Pauliny-Toth, I. I. K., & Nauber, U. 1981, A&AS, 45, 367 [NASA ADS] [Google Scholar]
- Landt, H., Padovani, P., & Giommi, P. 2002, MNRAS, 336, 945 [NASA ADS] [CrossRef] [Google Scholar]
- Madrid, J. P., Donzelli, C. J., Rodríguez-Ardila, A., et al. 2018, ApJS, 238, 31 [Google Scholar]
- Munari, E., Biviano, A., Borgani, S., Murante, G., & Fabjan, D. 2013, MNRAS, 430, 2638 [Google Scholar]
- Muriel, H. 2016, A&A, 591, L4 [NASA ADS] [CrossRef] [EDP Sciences] [Google Scholar]
- Muriel, H., Donzelli, C., Rovero, A. C., & Pichel, A. 2015, A&A, 574, A101 [NASA ADS] [CrossRef] [EDP Sciences] [Google Scholar]
- Nilsson, K., Pursimo, T., Sillanpää, A., Takalo, L. O., & Lindfors, E. 2008, A&A, 487, L29 [NASA ADS] [CrossRef] [EDP Sciences] [Google Scholar]
- Nolan, P. L., Abdo, A. A., Ackermann, M., et al. 2012, ApJS, 199, 31 [Google Scholar]
- Paiano, S., Landoni, M., Falomo, R., et al. 2017, ApJ, 837, 144 [Google Scholar]
- Pesce, J. E., Falomo, R., & Treves, A. 1995, AJ, 110, 1554 [NASA ADS] [CrossRef] [Google Scholar]
- Pichel, A., Donzelli, C., Rosa-Gonzalez, D., et al. 2021, PASP, 133, 014102 [NASA ADS] [CrossRef] [Google Scholar]
- Prandini, E., Bonnoli, G., Maraschi, L., Mariotti, M., & Tavecchio, F. 2010, MNRAS, 405, L76 [NASA ADS] [CrossRef] [Google Scholar]
- Rector, T. A., & Stocke, J. T. 2001, AJ, 122, 565 [NASA ADS] [CrossRef] [Google Scholar]
- Romero, G. E., & Vila, G. S. 2014, Introduction to Black Hole Astrophysics (Berlin, Heidelberg: Springer-Verlag), 876 [CrossRef] [Google Scholar]
- Rosa González, D., Muriel, H., Mayya, Y. D., et al. 2019, MNRAS, 482, 5422 [CrossRef] [Google Scholar]
- Rovero, A. C., Muriel, H., Donzelli, C., & Pichel, A. 2016, A&A, 589, A92 [NASA ADS] [CrossRef] [EDP Sciences] [Google Scholar]
- Sbarufatti, B., Treves, A., & Falomo, R. 2005, ApJ, 635, 173 [NASA ADS] [CrossRef] [Google Scholar]
- Shaw, M. S., Romani, R. W., Cotter, G., et al. 2012, ApJ, 748, 49 [CrossRef] [Google Scholar]
- Shaw, M. S., Romani, R. W., Cotter, G., et al. 2013, ApJ, 764, 135 [NASA ADS] [CrossRef] [Google Scholar]
- Stickel, M., Fried, J. W., & Kuehr, H. 1993, A&AS, 98, 393 [NASA ADS] [Google Scholar]
- Urry, C. M., & Padovani, P. 1995, PASP, 107, 803 [NASA ADS] [CrossRef] [Google Scholar]
- Urry, M., & Padovani, P. 2000, PASP, 112, 1516 [NASA ADS] [CrossRef] [Google Scholar]
- Wakely, S. P., & Horan, D. 2008, Int. Cosm. Ray Conf., 3, 1341 [NASA ADS] [Google Scholar]
- Zeng, H., Yan, D., & Zhang, L. 2014, MNRAS, 441, 1760 [CrossRef] [Google Scholar]
All Tables
All Figures
|
Fig. 1. GMOS image of the field around S5 0716+714. Galaxies selected for spectroscopy are labeled with the corresponding slit number. The magenta circle corresponds to the blazar (slit number 1). The bar at the bottom of the image indicates 1 arcmin. North is at the top and east is to the left. Group members are shown in red. The object under slit 4 is an interacting pair of galaxies. The fainter galaxy in this pair has the label #23. The faint galaxy identified by Bychkova et al. (2006) is labeled “By”. |
| In the text | |
|
Fig. 2. Optical spectrum of the VHE blazar S5 716+715. Galactic and telluric lines are indicated. |
| In the text | |
|
Fig. 3. Redshift distribution in the range 0.20−0.27 of the galaxies with measured z observed in the field of view of S5 0716+714 (see Table 1). Group members are shown in red. The galaxy 15 with a redshift of 0.4873 was removed from the plot to distinguish the largest group better. |
| In the text | |
Current usage metrics show cumulative count of Article Views (full-text article views including HTML views, PDF and ePub downloads, according to the available data) and Abstracts Views on Vision4Press platform.
Data correspond to usage on the plateform after 2015. The current usage metrics is available 48-96 hours after online publication and is updated daily on week days.
Initial download of the metrics may take a while.