| Issue |
A&A
Volume 691, November 2024
|
|
|---|---|---|
| Article Number | L5 | |
| Number of page(s) | 6 | |
| Section | Letters to the Editor | |
| DOI | https://doi.org/10.1051/0004-6361/202451609 | |
| Published online | 29 October 2024 | |
Letter to the Editor
Hidden by a star: The redshift and the offset broad line of the flat-spectrum radio quasar PKS 0903–57⋆
1
Université Paris Cité, CNRS, CEA, Astroparticule et Cosmologie, F-75013 Paris, France
2
Laboratoire Univers et Théories, Observatoire de Paris, Université PSL, Université Paris Cité, CNRS, F-92190 Meudon, France
3
Université Paris Cité, CNRS, Astroparticule et Cosmologie, F-75013 Paris, France
4
INAF – Istituto di Radioastronomia, Via Gobetti 101, I-40129 Bologna, Italy
5
Department of Physics, Chemistry & Material Science, University of Namibia, Private Bag 13301, Windhoek, Namibia
6
Departamento de Astronomía, Universidad de Chile, Camino El Observatorio 1515, Las Condes, Santiago, Chile
7
Centre for Space Research, North-West University, Private Bag X6001, Potchefstroom 2520, South Africa
8
Department of Physics, University of Oxford, Keble Road, Oxford OX1 3RH, United Kingdom
⋆⋆ Corresponding author; This email address is being protected from spambots. You need JavaScript enabled to view it.
Received:
22
July 2024
Accepted:
5
October 2024
Abstract
Context. PKS 0903−57 is a little-studied γ-ray blazar that has recently attracted considerable interest due to the strong flaring episodes observed since 2020 in high energy (HE; 100 MeV ≤ E ≤ 100 GeV) and very high-energy (VHE; 100 GeV ≤ E ≤ 10 TeV) γ-rays. Its nature and properties are still not well determined. In particular, it is unclear whether PKS 0903−57 is a BL Lac or a flat-spectrum radio quasar (FSRQ), while its redshift estimation relies on a possibly misassociated low signal-to-noise ratio spectrum.
Aims. Our aims were to reliably measure the redshift of the blazar, and to determine its spectral type and luminosity in the optical range.
Methods. We performed spectroscopy of the optical counterpart of the blazar using the South African Large Telescope (SALT) and the Very Large Telescope (VLT), and monitored it photometrically with the Rapid Eye Mount (REM) telescope.
Results. We firmly measured the redshift of the blazar as z = 0.2621 ± 0.0006 thanks to the detection of five narrow optical lines. The detection of a symmetric broad Hα line with full width at half maximum (FWHM) of 4020 ± 30 km/s together with a jet-dominated continuum leads us to classify it as a FSRQ. Finally, we detected with high significance a redshift offset (∼1500 km/s) between the broad line and the host. This is the first time that such an offset has been unequivocally detected in a VHE blazar, possibly pointing to a very peculiar accretion configuration, a merging system, or a recoiling black hole.
Key words: galaxies: active / galaxies: distances and redshifts / BL Lacertae objects: general
Based on observations collected at the European Organization for Astronomical Research in the Southern Hemisphere, Chile, under programs P10822CJ.002 and P112.25SN.001. The raw FITS data files are available in the ESO archive. Based on observations made with the Southern African Large Telescope (SALT) under program 2020-1-SCI-027 (PI: E. Kasai).
© The Authors 2024
 Open Access article, published by EDP Sciences, under the terms of the Creative Commons Attribution License (https://creativecommons.org/licenses/by/4.0), which permits unrestricted use, distribution, and reproduction in any medium, provided the original work is properly cited.
This article is published in open access under the Subscribe to Open model. This email address is being protected from spambots. You need JavaScript enabled to view it. to support open access publication.
1. Introduction
Blazars are the brightest persistent γ-ray sources in the high-energy (HE) and very high-energy (VHE) sky. Their redshifts are often difficult to measure due, in the case of BL Lacs, to their featureless continuum-dominated spectrum. In the perspective of the future operations of the Cherenkov Telescope Array Observatory (CTAO), we are performing a multi-year observation campaign aimed at measuring or constraining the redshift of blazars likely to be detected with CTAO (Goldoni et al. 2021; Kasai et al. 2023a; D’Ammando et al. 2024). As of today, about one-half of the Fermi-LAT blazars lack redshifts or only have old low S/N spectra, which do not always yield reliable redshifts or spectral classification.
PKS 0903−57 is a Fermi-LAT detected blazar with a rather hard spectrum (spectral index ∼2.2), which is one of the targets of our campaign. It displayed γ-ray bright flares in 2020 through 2022 (Buson 2020; Wagner 2020; La Mura 2022) reaching brightness levels of 4–7 Crab in the VHE domain, which prompted multiple multi-wavelength publications (Mondal et al. 2021; Shah et al. 2021). Even so, in the 4LAC catalogue (Ajello et al. 2022) it is still classified as a blazar candidate of uncertain type (BCU). PKS 0903−57 was discovered in radio by Bolton et al. (1964); its radio position is  ,
,  (Charlot et al. 2020). The source is located near the Galactic Plane (l ∼ 276°, b ∼ −7°), with strong line-of-sight absorption, E(B − V) = 0.282 (Schlafly & Finkbeiner 2011). The optical counterpart has a magnitude B = 17.6 (White et al. 1987). The only redshift measurement was reported by Thompson et al. (1990). Their spectrum has a low signal-to-noise ratio with a power-law shape displaying two weak features at 4751 and 6306 Å identified as MgII and [OII] at redshift z = 0.695. This is the usually accepted value; nevertheless, there appears to be some ambiguity about that identification. The source with that redshift is indeed 4″ off the radio counterpart. ATCA radio observations detected a one-sided arcsec-scale jet to the northeast of the core, while Chandra X-ray observations detected the core and weak emission associated with the radio jet (Marshall et al. 2005). Although the X-ray position is not reported in that work, examination of the contour plot of the radio and X-ray detection (see their Fig. 1, panel f) suggests that the optical counterpart reported by White et al. (1987) is the correct one. The Gaia DR3 catalogue (Gaia Collaboration 2023) reports two sources near the radio position, separated by
  . The fainter one has magnitude G = 17.87 ± 0.03 and is at the radio position; the brighter one has magnitude G = 15.94 ± 0.01. The results just described suggest that the faint Gaia source is the blazar counterpart, while the bright one is a Galactic star along our line of sight. If this hypothesis is correct, the spectra of the two objects are very different with absorption lines from the star and a power-law spectrum with possibly redshifted emission lines from the blazar. Therefore, despite the very small separation, depending on the relative brightness of the two sources, it should be possible to detect the signatures of both of them. We report on the observations we performed in order to test this hypothesis.
For all calculations we used a cosmology with ΩM = 0.27, ΩΛ = 0.73, and H0 = 70 km s−1 Mpc−1. All wavelengths are in air. All magnitudes are in the Vega system.
2. Observations and results
After the detection of the 2020 flare of PKS 0903−57, we triggered observations with the SALT telescope using the Robert Stobie Spectrograph (RSS) (Burgh et al. 2003) to catch the blazar in a bright state. Our observations were centred at the radio position with different slit position angles defined as 0° when the slit is placed in the N-S direction and 90° when in the E-W direction (see Table 1 and Fig. A.1).
Parameters of the spectroscopic observations for PKS 0903−57.
The SALT spectra obtained from the two different slit orientations did not show any noticeable difference and presented only features consistent with a star of type F or G (see Fig. A.2). In particular, we could not detect the putative emission features at 4751 and 6306 Å with limits on the equivalent width (EW) of ∼0.6 Å. We conclude that at this epoch and in this configuration the blazar optical flux was too weak to be detectable over the flux of the star.
To complement these spectra, we found observations of our target1 in the European Southern Observatory (ESO) archive, taken with the ESO Faint Object Spectrograph and Camera EFOSC2 (Buzzoni et al. 1984) on March 12, 2018, using grism Gr 13 (Δλ/λ ∼ 300; range 3700−9300 Å). These spectra have lower S/N, but a wider wavelength range, and still do not show any active galactic nucleus (AGN) signature or emission lines of any kind. Combining the two spectra, we compared them to the main sequence star templates from the X-shooter Spectral Library DR3 (Verro et al. 2022), and found that the star is likely of spectral type F6. By reddening and scaling the template using the Gaia magnitude (G = 15.94 ± 0.01), we obtained a photometric template of the star. Under the assumption that the star is not variable, which is reasonable considering its ordinary spectrum, this template can be subtracted from unresolved photometry of the two objects to obtain the blazar flux.
We performed further observations in 2022 at ESO using the FOcal Reducer and low dispersion Spectrograph (FORS2) (Appenzeller et al. 1998). Given the SALT results, we modified our configurations using a  slit, asking for good (
 ) seeing. The pointing was achieved using blind offsets from a nearby star. We used position angles PA = 18° and PA = 108°, respectively parallel and perpendicular to the line joining the two objects. The observations were split into six observing blocks of about 890 seconds each, three for each position angle. The spectra were still dominated by the bright star (Kasai et al. 2023b). The spectra at PA = 18° did not yield any new features; however, the spectra at PA = 108° displayed a weak, narrow emission line at ∼6318 Å with EW = 0.7 ± 0.2 Å. It can be interpreted as [OII] or [OIII]b (see e.g. Kasai et al. 2023a), the first hypothesis would yield z ∼ 0.695, which is the redshift proposed by Thompson et al. (1990); the second would yield z ∼ 0.262. Among the spectra at PA = 108°, the line was stronger in the first two observing blocks where the seeing was
  , and was weaker in the third block (seeing
  ) suggesting that very good seeing was a key factor for its detection (see Kasai et al. 2023b, Fig. 2 on the right). We thus asked for another observation to be performed with the slit at PA = 108° using a
  slit in exceptional (
 ) seeing and also for three observing blocks using the Grism Gr1028z with coverage down to 9000 Å to check for the presence of other lines.
In January 2023 we started monitoring the source using the 60 cm REM telescope (Zerbi et al. 2001) in the g, r, i, and H filters. We subtracted the magnitudes of our template from our measurements to obtain the blazar flux. It shows continuous variability correlated in all filters with roughly the same amplitude of ±0.15 mag (Fig. 1). The average H magnitude before subtraction is 12.60 ± 0.03.
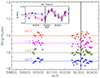 |
Fig. 1. REM light curves of the blazar in the g, r, i, and H filters. The photometric points were obtained after subtraction of the nearby star photometric template. The magnitudes have been shifted for display purposes. The horizontal lines indicate the average magnitude values. The inset in the top of the figure shows the variation ΔMag = Mag-median(mag) for all filters around the time of the observation. In both plots, a vertical black line shows the date of our 2024 spectroscopic observation, which happened near a local flux minimum. |
New FORS2 observations were performed on January 7, 2024, close to a local minimum of the blazar REM lightcurve (Fig. 1). The data reduction, flux calibration, and telluric corrections were performed as in our previous works (see e.g. Goldoni et al. 2021; D’Ammando et al. 2024). We performed flux calibration scaling the flux of the spectrum using our near-simultaneous REM photometry corrected with our photometric template.
The spectra (see Figs. 2 and A.3) clearly show the presence of several emission features superimposed on the continuum and absorption features of the star. The weak narrow feature of the 2022 observation is confirmed with a much higher S/N, while a weaker feature consistent with [OIII]a at z ∼ 0.262 appears at 6259 Å. At the same redshift, the [NII]b, [NII]a, and Hα features (all narrow) are also detected. A broad symmetric feature that can be identified with Hα is clearly visible around 8300 Å. All of these features are present before telluric corrections and in the single 2D and 1D frames of each observation. However, no emission consistent with Hβ, broad or narrow at or near this redshift, is detected.
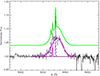 |
Fig. 2. Hα-[NII] complex doublet in the 2024 merged normalized FORS2 spectrum. The global four-component fit is displayed in green, rescaled by 0.04 for visibility. The individual Gaussian components are also shown: in magenta the broad and narrow Hα components, and in dark blue (dashed lines) the [NII] components. While the three narrow components are at the systemic redshift z = 0.2621, the broad and narrow Hα, both in magenta, clearly have different centroids. |
We fitted the [OIII] doublet using two Gaussians with independent widths and flux ratio. The Hα-[NII] complex was fitted simultaneously with three narrow Gaussians features, constrained to have the same width, and a broad Gaussian feature. The narrow features are at a redshift consistent with that of the [OIII] doublet, but have a smaller width of 254 ± 9 km/s. The larger width of the [OIII] lines suggests the possible presence of an outflow, as is often observed in these lines (see e.g. Singha et al. 2022). However, the signal-to-noise ratio of the doublet is too low (see the flux to error ratios in Table 2) to investigate this possibility with a two-component fit (i.e. core + wing). We estimated the systemic redshift from the average position of the five narrow lines. Taking into account the uncertainties in the wavelength solution, a redshift value z = 0.2621 ± 0.0006 is obtained that definitely disproves the value previously reported by Thompson et al. (1990). The broad feature has EW = 7.94 ± 0.17 Å, greater than the limit of 5 Å usually quoted to distinguish between BL Lacs and flat spectrum radio quasar (FSRQs) (Urry & Padovani 1995). The full width at half maximum (FWHM) of the line is 4020 ± 30 km/s and its peak is shifted towards the red with respect to the narrow lines by 1460 ± 36 km/s. To verify this value, a simulated normalized spectrum of the target containing the Hα-[NII] complex was built. We then shifted only the broad Hα by 30 km/s pixels between −2100 km/s and +2100 km/s and cross-correlated the resulting templates with the observed spectrum. The cross-correlation peak is found at 1500 ± 30 km/s, validating our result. The ∼40σ offset is the most peculiar characteristic of this spectrum.
Properties of the emission lines detected.
3. Discussion
The redshift we find for PKS 0903−57, z = 0.2621, is much lower than the commonly accepted value. It implies not only a smaller distance, but also much less γ − γ absorption by the extragalactic background light. We estimate a factor of ∼1.25 at 100 GeV and up to ∼250 at 1 TeV (Domínguez et al. 2011). These appropriate corrections will greatly influence the inferred intrinsic VHE spectral properties of the object.
The large EW of the broad line suggests that the source is not a BL Lac. The existence of the broad Seyfert-like feature is also important for γ-ray spectral modelling as it proves the presence of an external photon field which is Comptonized by the electrons produced in the synchrotron jet (see e.g. Finke 2016). The broad Hα line luminosity is 1.0(±0.5)×1043 erg/s. Assuming that it is powered by the thermal continuum of the AGN, this would imply a continuum luminosity L5100 ∼ 1.7 × 1044 erg/s (see Eq. 1 in Greene & Ho 2005). However, we measure L5100 ∼ 4.1 × 1045 erg/s in our spectrum, which suggests that the continuum is dominated by another contribution, probably a jet. We thus can classify PKS 0903−57 as a FSRQ, the second-nearest VHE FSRQ after the low-luminosity VHE FSRQ PKS 0736+017 (H.E.S.S. Collaboration 2020). We note, however, that in the plane spectral index-flux at 1 GeV, using Fermi-LAT spectra, PKS 0903−57 lies near the region occupied by low-energy peaked BL Lacs (Ajello et al. 2022) near the changing-look blazar B21420+32 (Mishra et al. 2021).
The most unusual feature of this spectrum is the offset towards the red of the broad Hα feature from the systemic redshift by 1460 ± 36 km/s (40 ± 1 Å). This is the first time, to our knowledge, that such a symmetric feature has been detected in a blazar in the optical range. We note that in the black hole (BH) binary candidate OJ 287 a similar offset (∼20 Å) was possibly detected (Nilsson et al. 2010), but the errors in the position of the line centroid prevented any claim on the robustness of this result.
Doppler-shifted peaks may be produced by emission from an optically thick and geometrically thin relativistic Keplerian accretion disk; about 3−10% of AGN display double-peaked broad lines (Eracleous & Halpern 1994). However, Doppler boosting produces red and blue peaks that are usually asymmetric; only in extreme cases may a single peak be visible. In large sample studies, the majority of sources are found to have inclinations2 15° < i < 30° (Ward et al. 2024). Given that for blazars the inclination angle is small (≤5°) and that the broad feature is symmetric, we considered other possibilities (see below). Several scenarios for this configuration can be proposed (see e.g. Marziani 2023, and references therein). One proposal by Wang et al. (2017) assumes that the broad-line region is made of discrete clouds produced by clumps from the dusty torus. If the clumps are mostly falling into the BH (see Fig. 1, Wang et al. 2017), a redshifted broad line may appear. The radial inflow would then face a strong radiation field pushing away the infalling gas. The gas should likely become turbulent and the line profile become irregularly variable over time spans shorter than those detected with reverberation mapping (few days; see e.g. Peterson 1997). Alternatively, two supermassive BHs might be in the process of merging with the broad-line emission generated around one BH and the narrow lines generated around the other (Dotti et al. 2009). Many kinematically offset binary BH candidates have been proposed (see e.g. Kelley 2021, and references therein). In this case, orbital motions are very difficult to detect except for very small separations (< 1 pc). Therefore, the configuration is stable; for example, for observations spaced by five years or less, no velocity variation is expected to be detectable (Kelley 2021).
Finally, the most exciting possibility is that we are observing a recoiling BH formed after the coalescence of two BHs. The emission of gravitational waves during the merging is anisotropic, and therefore the resulting BH may receive a kick with velocities of up to a few thousand km/s (Campanelli et al. 2007) and be displaced from the centre of the host galaxy or even ejected altogether. One of the best candidates for this scenario is 3C186 (Chiaberge et al. 2018). The Hubble Space Telescope Imaging Spectrograph (HST/STIS) and Sloan Digital Sky Survey spectroscopy discovered compatible blueshifts (∼2000 km/s) from the systemic redshift in several emission lines, while the HST Wide Field Camera imaging revealed a  offset (∼11 kpc at the redshift of the source, z = 1.06). In this case, deep imaging is key to detecting and separating host and AGN emission.
4. Conclusions
The nature of PKS 0903−57 has been hidden for a long time by the presence of a bright (G ∼ 16) star at just  . Taking advantage of appropriate slit positioning and exceptional seeing, we were able to detect the blazar emission. Our main results are the following:
-
We provide the first solid measurement of the redshift, lowering its distance estimate by a factor of three, with strong implications for understanding the source emission.
-
A conspicuous broad line was detected along with a very bright continuum, suggesting that PKS 0903−57 is a very rare low-luminosity, low-redshift VHE FSRQ.
-
We found an unprecedented (for blazars) velocity offset between the systemic redshift and the broad line, which suggests either a very peculiar accretion state or that we are witnessing the consequence of a merging.
In order to better understand the nature of this very intriguing system, further observations are needed. On the one hand, longer spectroscopic observations in exceptional seeing will make it possible to detect Hα again with a higher signal-to-noise ratio and to check for variability in its profile. In such spectra we will also possibly detect broad Hβ and compare its profile to that of Hα, giving further information on the broad-line region properties. On the other hand, deep high-resolution imaging observations will enable us, for the first time, to separate the active nucleus from the star. Given the relatively low redshift, a detection of the host galaxy and of the putative merging system is also possible.
ProgID 0100.A-0588(A), PI: V. Moss.
i = 0° for a face-on disk and i = 90° for an edge-on disk.
Acknowledgments
We thank the observers for performing our observations at SALT and VLT, in particular, John Pritchard at ESO for very productive discussions. This research has made use of the SIMBAD database, operated at CDS, Strasbourg, France. This Letter went through internal review by the CTAO consortium. We thank Elina Lindfors and Nicola Masetti for their helpful comments and suggestions as internal reviewers. This research has made use of the CTAO instrument response functions, see https://www.cta-observatory.org/science/cta-performance (version prod3b-v1) for more details. We gratefully acknowledge financial support from the agencies and organizations listed here: http://www.cta-observatory.org/consortium_acknowledgments, and in particular the U.S. National Science Foundation Grant PHY-2011420 and ANID/Chile FB210003.
References
- Ajello, M., Baldini, L., Ballet, J., et al. 2022, ApJS, 263, 24 [NASA ADS] [CrossRef] [Google Scholar]
- Appenzeller, I., Fricke, K., Fürtig, W., et al. 1998, The Messenger, 94, 1 [NASA ADS] [Google Scholar]
- Bolton, J. G., Gardner, F. F., & Mackey, M. B. 1964, Aust. J. Phys., 17, 340 [Google Scholar]
- Burgh, E. B., Nordsieck, K. H., Kobulnicky, H. A., et al. 2003, SPIE Conf. Ser., 4841, 1463 [NASA ADS] [Google Scholar]
- Buson, S. 2020, ATel, 13604 [Google Scholar]
- Buzzoni, B., Delabre, B., Dekker, H., et al. 1984, The Messenger, 38, 9 [NASA ADS] [Google Scholar]
- Campanelli, M., Lousto, C. O., Zlochower, Y., & Merritt, D. 2007, Phys. Rev. Lett., 98, 231102 [Google Scholar]
- Charlot, P., Jacobs, C. S., Gordon, D., et al. 2020, A&A, 644, A159 [EDP Sciences] [Google Scholar]
- Chiaberge, M., Tremblay, G. R., Capetti, A., & Norman, C. 2018, ApJ, 861, 56 [NASA ADS] [CrossRef] [Google Scholar]
- D’Ammando, F., Goldoni, P., Max-Moerbeck, W., et al. 2024, A&A, 683, A222 [NASA ADS] [CrossRef] [EDP Sciences] [Google Scholar]
- Domínguez, A., Primack, J. R., Rosario, D. J., et al. 2011, MNRAS, 410, 2556 [Google Scholar]
- Dotti, M., Montuori, C., Decarli, R., et al. 2009, MNRAS, 398, L73 [NASA ADS] [Google Scholar]
- Eracleous, M., & Halpern, J. P. 1994, ApJS, 90, 1 [NASA ADS] [CrossRef] [Google Scholar]
- Finke, J. D. 2016, ApJ, 830, 94 [Google Scholar]
- Gaia Collaboration (Vallenari, A., et al.) 2023, A&A, 674, A1 [NASA ADS] [CrossRef] [EDP Sciences] [Google Scholar]
- Goldoni, P., Pita, S., Boisson, C., et al. 2021, A&A, 650, A106 [NASA ADS] [CrossRef] [EDP Sciences] [Google Scholar]
- Greene, J. E., & Ho, L. C. 2005, ApJ, 630, 122 [NASA ADS] [CrossRef] [Google Scholar]
- H.E.S.S. Collaboration (Abdalla, H., et al.) 2020, A&A, 633, A162 [EDP Sciences] [Google Scholar]
- Kasai, E., Goldoni, P., Pita, S., et al. 2023a, MNRAS, 518, 2675 [Google Scholar]
- Kasai, E., Goldoni, P., Pita, S., et al. 2023b, in The Multimessenger Chakra of Blazar Jets, eds. I. Liodakis, M. F. Aller, H. Krawczynski, et al., 375, 96 [Google Scholar]
- Kelley, L. Z. 2021, MNRAS, 500, 4065 [Google Scholar]
- La Mura, G. 2022, ATel, 15666 [Google Scholar]
- Marshall, H. L., Schwartz, D. A., Lovell, J. E. J., et al. 2005, ApJS, 156, 13 [NASA ADS] [CrossRef] [Google Scholar]
- Marziani, P. 2023, Symmetry, 15, 1859 [NASA ADS] [CrossRef] [Google Scholar]
- Mishra, H. D., Dai, X., Chen, P., et al. 2021, ApJ, 913, 146 [NASA ADS] [CrossRef] [Google Scholar]
- Mondal, S. K., Prince, R., Gupta, N., & Kumar Das, A. 2021, ApJ, 922, 160 [NASA ADS] [CrossRef] [Google Scholar]
- Nilsson, K., Takalo, L. O., Lehto, H. J., & Sillanpää, A. 2010, A&A, 516, A60 [NASA ADS] [CrossRef] [EDP Sciences] [Google Scholar]
- Peterson, B. M. 1997, An Introduction to Active Galactic Nuclei (Cambridge: Cambridge University Press) [Google Scholar]
- Schlafly, E. F., & Finkbeiner, D. P. 2011, ApJ, 737, 103 [Google Scholar]
- Shah, Z., Jithesh, V., Sahayanathan, S., & Iqbal, N. 2021, MNRAS, 504, 416 [NASA ADS] [CrossRef] [Google Scholar]
- Singha, M., Husemann, B., Urrutia, T., et al. 2022, A&A, 659, A123 [NASA ADS] [CrossRef] [EDP Sciences] [Google Scholar]
- Thompson, D. J., Djorgovski, S., & de Carvalho, R. 1990, PASP, 102, 1235 [NASA ADS] [CrossRef] [Google Scholar]
- Urry, C. M., & Padovani, P. 1995, PASP, 107, 803 [NASA ADS] [CrossRef] [Google Scholar]
- Verro, K., Trager, S. C., Peletier, R. F., et al. 2022, A&A, 660, A34 [NASA ADS] [CrossRef] [EDP Sciences] [Google Scholar]
- Wagner, S. J. 2020, ATel, 13632 [Google Scholar]
- Wang, J.-M., Du, P., Brotherton, M. S., et al. 2017, Nat. Astron., 1, 775 [NASA ADS] [CrossRef] [Google Scholar]
- Ward, C., Gezari, S., Nugent, P., et al. 2024, ApJ, 961, 172 [NASA ADS] [CrossRef] [Google Scholar]
- White, G. L., Batty, M. J., Bunton, J. D., Brown, D. R., & Corben, J. B. 1987, MNRAS, 227, 705 [NASA ADS] [CrossRef] [Google Scholar]
- Zerbi, R. M., Chincarini, G., Ghisellini, G., et al. 2001, Astron. Nachr., 322, 275 [Google Scholar]
Appendix A: Field of view image and complete spectra
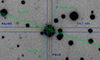 |
Fig. A.1. Slit positions of our observations superimposed on a SUperb Seeing Imager R-band image of the field (observation date 1994-01-08) retrieved from the ESO archive. Note that, as the star is much brighter than the blazar in this observation, the centres of our observations are offset from the centre of the optical emission. The blue lines represent the SALT slits, (width = 2″) and the green lines represent the FORS2 slits (width = 0.7″ and 0.5″). Position angles (in degrees) are also indicated near the corresponding slits with corresponding colors. |
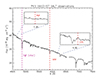 |
Fig. A.2. SALT spectrum of our 2020 observation of PKS 0903-57. The spectrum shows prominent stellar absorption lines and a strong NaID interstellar absorption feature. No emission feature possibly linked to the AGN is detected. In particular, we show in two insets the zoom of the wavelength regions where the features detected by Thompson et al. (1990) should lie. Only weak ripples are visible. |
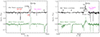 |
Fig. A.3. Normalized and telluric corrected spectrum of our 2024 FORS2 observations of PKS 0903-57 (continuous black line) and normalized spectrum of our 2024 FORS observations of PKS 0903-57 before telluric corrections (dashed green line). Left panel: Spectra between 5300 and 7000 Å; Right panel: Spectra between 7000 and 8950 Å. The AGN features (z = 0.2621) are marked with continuous lines (black), the stellar features (z = 0) are marked with dashed lines (magenta). Telluric absorptions are marked by the symbol ⊕ and Galactic absorption features are labelled with ‘MW’ and a dashed line (red). A possible feature (EW ∼ 0.4 Å), visible around 7950 Å would be consistent with [OI] λ 6300 at z = 0.2621. |
All Tables
All Figures
|
Fig. 1. REM light curves of the blazar in the g, r, i, and H filters. The photometric points were obtained after subtraction of the nearby star photometric template. The magnitudes have been shifted for display purposes. The horizontal lines indicate the average magnitude values. The inset in the top of the figure shows the variation ΔMag = Mag-median(mag) for all filters around the time of the observation. In both plots, a vertical black line shows the date of our 2024 spectroscopic observation, which happened near a local flux minimum. |
| In the text | |
|
Fig. 2. Hα-[NII] complex doublet in the 2024 merged normalized FORS2 spectrum. The global four-component fit is displayed in green, rescaled by 0.04 for visibility. The individual Gaussian components are also shown: in magenta the broad and narrow Hα components, and in dark blue (dashed lines) the [NII] components. While the three narrow components are at the systemic redshift z = 0.2621, the broad and narrow Hα, both in magenta, clearly have different centroids. |
| In the text | |
|
Fig. A.1. Slit positions of our observations superimposed on a SUperb Seeing Imager R-band image of the field (observation date 1994-01-08) retrieved from the ESO archive. Note that, as the star is much brighter than the blazar in this observation, the centres of our observations are offset from the centre of the optical emission. The blue lines represent the SALT slits, (width = 2″) and the green lines represent the FORS2 slits (width = 0.7″ and 0.5″). Position angles (in degrees) are also indicated near the corresponding slits with corresponding colors. |
| In the text | |
|
Fig. A.2. SALT spectrum of our 2020 observation of PKS 0903-57. The spectrum shows prominent stellar absorption lines and a strong NaID interstellar absorption feature. No emission feature possibly linked to the AGN is detected. In particular, we show in two insets the zoom of the wavelength regions where the features detected by Thompson et al. (1990) should lie. Only weak ripples are visible. |
| In the text | |
|
Fig. A.3. Normalized and telluric corrected spectrum of our 2024 FORS2 observations of PKS 0903-57 (continuous black line) and normalized spectrum of our 2024 FORS observations of PKS 0903-57 before telluric corrections (dashed green line). Left panel: Spectra between 5300 and 7000 Å; Right panel: Spectra between 7000 and 8950 Å. The AGN features (z = 0.2621) are marked with continuous lines (black), the stellar features (z = 0) are marked with dashed lines (magenta). Telluric absorptions are marked by the symbol ⊕ and Galactic absorption features are labelled with ‘MW’ and a dashed line (red). A possible feature (EW ∼ 0.4 Å), visible around 7950 Å would be consistent with [OI] λ 6300 at z = 0.2621. |
| In the text | |
Current usage metrics show cumulative count of Article Views (full-text article views including HTML views, PDF and ePub downloads, according to the available data) and Abstracts Views on Vision4Press platform.
Data correspond to usage on the plateform after 2015. The current usage metrics is available 48-96 hours after online publication and is updated daily on week days.
Initial download of the metrics may take a while.