Fig. 1.
Download original image
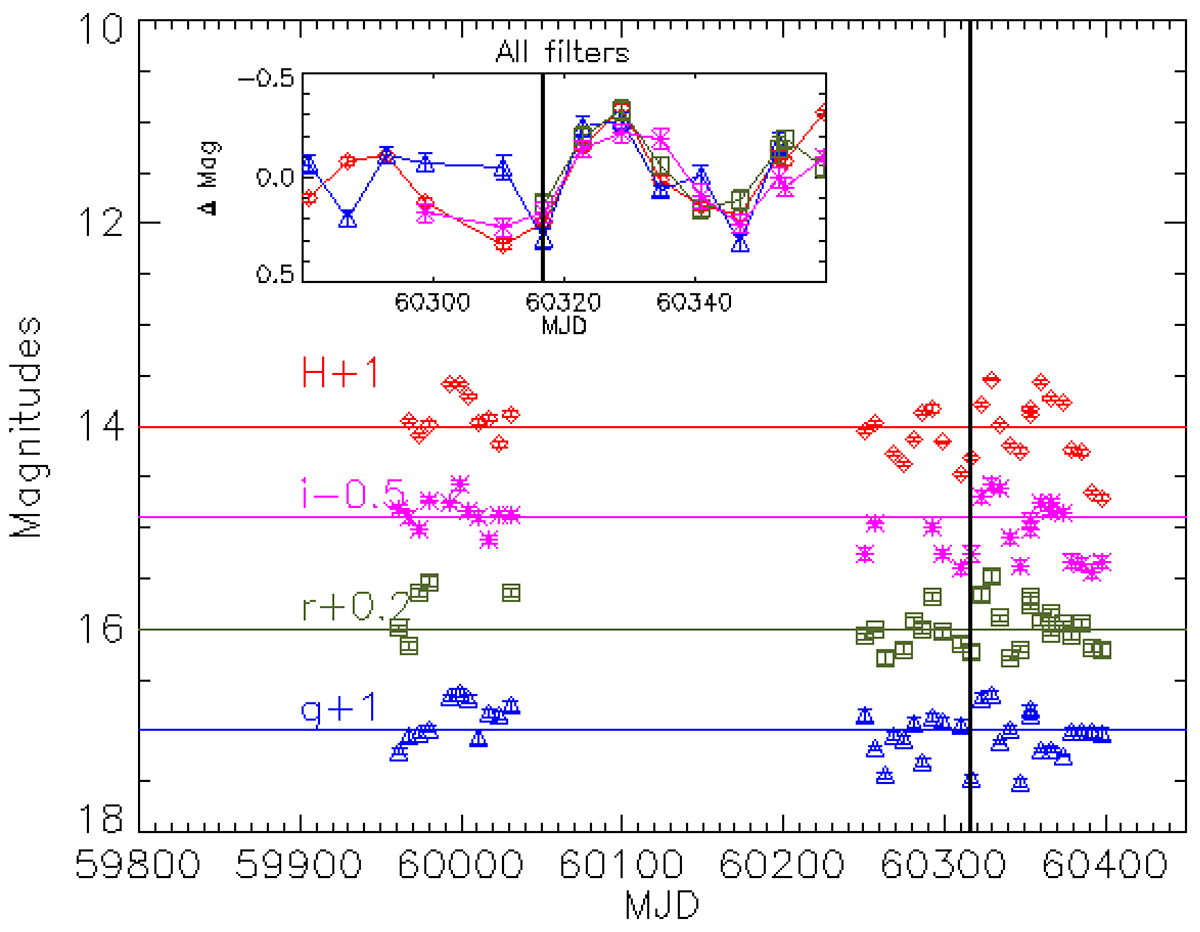
REM light curves of the blazar in the g, r, i, and H filters. The photometric points were obtained after subtraction of the nearby star photometric template. The magnitudes have been shifted for display purposes. The horizontal lines indicate the average magnitude values. The inset in the top of the figure shows the variation ΔMag = Mag-median(mag) for all filters around the time of the observation. In both plots, a vertical black line shows the date of our 2024 spectroscopic observation, which happened near a local flux minimum.
Current usage metrics show cumulative count of Article Views (full-text article views including HTML views, PDF and ePub downloads, according to the available data) and Abstracts Views on Vision4Press platform.
Data correspond to usage on the plateform after 2015. The current usage metrics is available 48-96 hours after online publication and is updated daily on week days.
Initial download of the metrics may take a while.