| Issue |
A&A
Volume 683, March 2024
|
|
|---|---|---|
| Article Number | A222 | |
| Number of page(s) | 16 | |
| Section | Extragalactic astronomy | |
| DOI | https://doi.org/10.1051/0004-6361/202348507 | |
| Published online | 20 March 2024 | |
Optical spectroscopy of blazars for the Cherenkov Telescope Array – III⋆
1
INAF – Istituto di Radioastronomia, Via Gobetti 101, 40129 Bologna, Italy
e-mail: This email address is being protected from spambots. You need JavaScript enabled to view it.
2
Université Paris-Cité, CNRS, CEA, Astroparticule et Cosmologie, 75013 Paris, France
3
Departamento de Astronomía, Universidad de Chile, Camino El Observatorio 1515, Las Condes, Santiago, Chile
4
Universidad de La Laguna (ULL), Departamento de Astrofísica, 38206 La Laguna, Tenerife, Spain
5
Instituto de Astrofísica de Canarias (IAC), 38200 La Laguna, Tenerife, Spain
6
Department of Physics, Chemistry & Material Science, University of Namibia, Private Bag 13301, Windhoek, Namibia
7
Santa Cruz Institute for Particle Physics and Department of Physics, University of California, Santa Cruz, CA 95064, USA
8
IPARCOS and Department of EMFTEL, Universidad Complutense de Madrid, 28040 Madrid, Spain
9
Centre for Space Research, North-West University, Potchefstroom 2520, South Africa
10
Centro Brasileiro de Pesquisas Fisicas (CBPF), Rua Dr. Xavier Sigaud 150 – Urca, Rio de Janeiro 22290-180, Brazil
11
Laboratoire Univers et Théories, Observatoire de Paris, Université PSL, Université Paris-Cité, CNRS, 92190 Meudon, France
12
Oxford Astrophysics, University of Oxford, Denys Wilkinson Building, Keble Road, Oxford OX1 3RH, UK
13
Ruhr-Universität Bochum, Fakultät für Physik und Astronomie, Astronomisches Institut (AIRUB), 44801 Bochum, Germany
14
Finnish Centre for Astronomy with ESO, FINCA, University of Turku, Turku 20014, Finland
15
Instituto de Astrofísica, Facultad de Fisíca, Pontificia Universidad Católica de Chile, Av. Vicuña Mackenna 4860, Macul, Santiago, Chile
16
Université Paris-Cité, CNRS, Astroparticule et Cosmologie, 75013 Paris, France
17
Department of Physics, University of the Free State, Bloemfontein 9300, South Africa
Received:
6
November
2023
Accepted:
21
December
2023
Abstract
Context. Blazars, which include BL Lacs and flat-spectrum radio quasars, represent the brightest persistent extragalactic sources in the high-energy (HE; 10 MeV–100 GeV) and very-high-energy (VHE; E > 100 GeV) γ-ray sky. Due to their almost featureless optical/UV spectra, it is challenging to measure the redshifts of BL Lacs. As a result, about 50% of γ-ray BL Lacs lack a firm measurement of this property, which is fundamental for population studies, indirect estimates of the extragalactic background light, and fundamental physics probes (e.g., searches for Lorentz-invariance violation or axion-like particles).
Aims. This paper is the third in a series of papers aimed at determining the redshift of a sample of blazars selected as prime targets for future observations with the next generation, ground-based VHE γ-ray astronomy observatory, Cherenkov Telescope Array Observatory (CTAO). The accurate determination of the redshift of these objects is an important aid in source selection and planning of future CTAO observations.
Methods. Promising targets were selected following a sample selection obtained with Monte Carlo simulations of CTAO observations. The selected targets were expected to be detectable with CTAO in observations of 30 h or less. We performed deep spectroscopic observations of 41 of these blazars using the Keck II, Lick, SALT, GTC, and ESO/VLT telescopes. We carefully searched for spectral lines in the spectra and whenever features of the host galaxy were detected, we attempted to model the properties of the host galaxy. The magnitudes of the targets at the time of the observations were also compared to their long-term light curves.
Results. Spectra from 24 objects display spectral features or a high signal-to-noise ratio (S/N). From these, 12 spectroscopic redshifts were determined, ranging from 0.2223 to 0.7018. Furthermore, 1 tentative redshift (0.6622) and 2 redshift lower limits at z > 0.6185 and z > 0.6347 were obtained. The other 9 BL Lacs showed featureless spectra, despite the high S/N (≥100) observations. Our comparisons with long-term optical light curves tentatively suggest that redshift measurements are more straightforward during an optical low state of the active galactic nucleus. Overall, we have determined 37 redshifts and 6 spectroscopic lower limits as part of our programme thus far.
Key words: galaxies: active / BL Lacertae objects: general / galaxies: distances and redshifts / gamma rays: galaxies
Reduced spectra are available at the CDS via anonymous ftp to cdsarc.cds.unistra.fr (130.79.128.5) or via https://cdsarc.cds.unistra.fr/viz-bin/cat/J/A+A/683/A222
© The Authors 2024
 Open Access article, published by EDP Sciences, under the terms of the Creative Commons Attribution License (https://creativecommons.org/licenses/by/4.0), which permits unrestricted use, distribution, and reproduction in any medium, provided the original work is properly cited.
This article is published in open access under the Subscribe to Open model. This email address is being protected from spambots. You need JavaScript enabled to view it. to support open access publication.
1. Introduction
Blazars are a type of active galactic nuclei (AGNs) that display exceptional observational properties. Their unique characteristics include beamed non-thermal emission from the radio to high-energy γ rays, as well as strongly polarized optical and radio emission (≥3%; see e.g., Angel & Stockman 1980; Angelakis et al. 2016; Lister et al. 2011), variability from a few percent up to a few orders of magnitude on different timescales at all wavelengths (see e.g., Wagner & Witzel 1995; Falomo et al. 2014), and (for some) the ejection of superluminal radio blobs (see e.g., Vermeulen & Cohen 1994). These characteristics are generally explained by Doppler boosting of the jet emission with Lorentz factors of up to ∼40 (e.g., Jorstad et al. 2017).
Recent decades have seen the emergence of a new observational window on the Universe: very-high-energy (VHE; E > 100 GeV) γ-ray astronomy. Thanks to three major imaging atmospheric Cherenkov telescopes (H.E.S.S.1, MAGIC2, and VERITAS3; see e.g. Aharonian et al. 2006; Aleksić et al. 2016a,b; Holder et al. 2006), 252 sources have been detected so far at VHE (TeVCAT4; Wakely & Horan 2008), and AGNs make up approximately one-third of these sources. Since 2008, this field has also benefitted from the detection of γ rays at high-energy (HE; 100 MeV < E < 100 GeV) with the Large Area Telescope (LAT) on board the Fermi Gamma Ray Space Telescope5 (Atwood et al. 2009). In the coming years, the future world-wide Cherenkov Telescope Array Observatory (CTAO6) will start its operations with a lower energy threshold for VHE γ-ray detections, down to a few tens of GeV, and a flux sensitivity improved by a factor of ∼10 compared to the current facilities.
Blazars, which include BL Lacs and flat-spectrum radio quasars (FSRQs), are by far the most numerous type of AGNs detected at VHE. The study of their population and evolution is key to high-energy astrophysics (Cherenkov Telescope Array Consortium 2019). However, one of the biggest difficulties in investigating VHE γ-ray emission from AGNs resides in their limited number, since only 84 of them are known to date. In the future, CTAO is expected to detect hundreds of AGNs of various types and make it possible to carry out population studies. The broad energy range covered by CTAO includes energies where γ rays are unaffected by absorption while propagating in the poorly characterized extragalactic background light (EBL; e.g., Gould & Schréder 1966; Hauser & Dwek 2001; Dwek & Krennrich 2013) and extends to the VHE regime, where the spectra are strongly distorted by the EBL. This will help reduce systematic effects combining spectra from different instruments, leading to a more reliable EBL determination, thus making it possible to constrain blazar models up to the highest energies with less ambiguity. One challenge in the study of the cosmological evolution of blazars is the difficulty in obtaining redshifts, particularly from the nearly featureless, continuum-dominated spectra of BL Lacs. Indeed, many of the early studies using X-ray or radio-selected samples had highly incomplete redshift measurements, even though the samples were confined to relatively bright sources (BZCAT7; Massaro et al. 2015a). Uncertainties related to extrapolating unknown redshifts from the measured set of redshifts have further complicated population studies.
The difficulty in measuring BL Lacs redshifts has not yet been solved and it also plagues present-day samples of blazars (Shaw et al. 2013; Paiano et al. 2017a; Massaro et al. 2015b,c; Peña-Herazo et al. 2020). Indeed, while the redshift distribution of γ-ray FSRQ (≥90% of them with known redshifts) displays a maximum at z ∼ 1 (Ajello et al. 2012), the redshift distribution of BL Lacs peaks at z < 0.5 (Ajello et al. 2014). This is reflected in the luminosity functions of the two classes. The luminosity function of FSRQ has a positive, luminosity-dependent evolution, while BL Lacs have a negative evolution at low luminosities, suggesting a very different evolution among the two classes. However, the results of BL Lacs are very likely biased by the lack of redshifts. For example, considering redshift lower limits from absorbing systems, a relevant population of BL Lacs with redshifts greater than 0.3–0.5 appears plausible. It is thus clear that samples with poor redshift coverage cannot be used to obtain reliable results on the cosmic evolution of γ-ray BL Lacs (Ajello et al. 2014). The problem is more severe for VHE BL Lacs, where the number of sources detected at higher redshift becomes sparser (less than ten BL Lacs at z > 0.3, of which two are at z > 0.4).
The VHE γ-ray detection of many BL Lacs in different redshift bins at z > 0.3 will allow for a more complete determination of the EBL density (see Cherenkov Telescope Array Consortium 2019). The redshift evolution of diffuse light in the Universe provides a powerful constraint on the galaxy evolution, the formation of stars and galaxies, and cosmology. In this context, the EBL is of fundamental importance. BL Lacs have so far been successfully used to investigate the EBL density (e.g., Ajello et al. 2014; Biteau & Williams 2015; Acciari et al. 2019). However, a major ingredient for its success is a robust redshift determination of the sources used for estimating it. It is therefore of great importance to make an effort to measure the redshift of a large fraction of AGNs detected with Fermi-LAT and that are likely to be detected with CTAO based on the extrapolation of their LAT spectra.
This is the third paper in a series that aims to determine the redshift of a sample of blazars that are promising targets for CTAO. In the previous two papers, we determined 25 spectroscopic redshifts with values between 0.0838 and 0.8125, 2 tentative redshifts, and 5 lower limits. In this paper, we present detailed results for 24 new targets. The results of the Lick spectra for 17 additional targets in our sample (see Sect. 2) are reported in Appendix A.
2. Sample selection
In this work, we use the sample introduced in Goldoni et al. (2021, hereafter Paper I) and Kasai et al. (2023, hereafter Paper II), which we briefly describe here. The sample has been selected to comprise the best candidates for future observations with the CTAO, extrapolating the spectral information of the hardest sources detected by Fermi-LAT at E > 10 GeV to the VHE.
We started from the sample of BL Lacs and blazar candidates of uncertain type (BCUs) in the Third Fermi LAT Catalog of High energy Sources (3FHL; Ajello et al. 2017), where the majority of the 1040 sources (64%) have no redshift measurement. To estimate their emission in the CTAO band, we extrapolated their average 3FHL energy spectrum, adding a 3 TeV exponential cutoff to simulate the expected spectral curvature in the VHE band. We then performed a Monte Carlo simulation with the Gammapy8 software (Deil et al. 2017; Nigro et al. 2019; Donath et al. 2023), using the publicly accessible CTAO performance files9, 10. To account for the energy- and redshift-dependent γ-ray opacity of the EBL, we used the model of Domínguez et al. (2011). For 3FHL sources with no redshift available, we assumed a value of z = 0.3, similar to that of zmed = 0.33 reported by Shaw et al. (2013) and zmed = 0.285 by Peña-Herazo et al. (2020). Incidentally, the median redshift of the sources reported in our two previous papers is zmed = 0.255, which excludes the lower limits with a mean value of zmed ll = 0.618. This value is consistent with this choice. After a first simulation run, we selected a smaller sample on which we performed a literature search that allowed us to correct the redshift of 32 sources (see Paper I) and rerun the simulations. As a result of these simulations, we estimated the minimum observing time required to get a 5σ detection with CTAO and the 3FHL sources with no redshift, which require less than 30 h to be detected, are included in our sample. The final sample contains 165 targets.
3. Observing strategy
As in the first two papers in the series (Paper I and Paper II), our main goal is to determine the spectroscopic redshifts or at least a spectroscopic lower limit for the BL Lacs in our sample. This is achieved by looking at stellar absorption features found in the luminous elliptical galaxies that usually host BL Lacs (Urry et al. 2000), such as Ca II HK doublet, Mgb, and Na I D. Despite the scarcity of their detection in BL Lac spectra, we also searched for emission lines such as [O II], [O III], Hα, and [N II]. A spectral resolution, λ/Δλ, of a few hundred (ideally up to 1000), along a signal-to-noise ratio (S/N) per pixel of ∼100 is required to detect features with EWs ≲5 Å expected in these sources. These two conditions have demonstrated good results in the past, as shown in Pita et al. (2014) and Papers I and II in our series. In difficult cases, the observations were intended to achieve at least one of these criteria. When possible, observations were carried out during a photometric minimum of the target to benefit from the higher S/N of the host galaxy features in the spectrum due to a reduced non-thermal emission of the central AGN.
4. Observations and data reduction
Observations were performed for 41 blazars between 2020-09-20 and 2022-03-26 for a total of 68 h using the Keck/ESI11 (Sheinis et al. 2002), Lick/KAST12, SALT/RSS13 (Burgh et al. 2003), VLT/FORS14 (Appenzeller et al. 1998), and GTC/OSIRIS15. We note that Keck II and GTC have primary mirror diameters of 10 m and SALT’s is 11 m, whereas the primary mirror diameter for the VLT is 8.2 m and the mirror diameter of the Shane telescope is 3 m.
The observations and data analysis follow similar procedures as described in Papers I and II, particularly with respect to the observational configuration, data reduction, flux calibration, telluric correction, and spectral dereddening procedures. After this treatment, the spectral shape is that generally expected for BL Lacs, showing a power-law continuum superposed with the emission of a host galaxy and (at times) weak emission lines. For some objects with a power law spectrum, namely, WISE J053629.06−334302.5, PKS 1424+240, and RBS 1457, as well as (to a smaller extent) 1RXS J203650.9−332817 and PMN J2221−5224, a flattening is displayed in the red part of the spectrum, which may be due to problems with flat-field frames. In this paper we give only a brief description of the VLT/FORS and GTC/OSIRIS instruments and of their data reduction as data from these instruments were not included in the first two papers in the series.
The visual and near-UV FOcal Reducer and low dispersion Spectrograph (FORS), part of the VLT of the European Southern Observatory (ESO), is a multi mode (imaging, polarimetry, long slit and multi-object spectroscopy) optical instrument mounted on the VLT UT1 Cassegrain focus (Appenzeller et al. 1998). To achieve the desired coverage, sensitivity, and spectral resolution on most targets, we selected GRISM 600RI+19, given its sensitivity in the range of 5000–8500 Å, with a spectroscopic resolution of λ/Δλ ∼ 800 and a 40–80% efficiency. For RBS 1751, we selected GRISM 1200B+97, which is sensitive in the range of 3600–5100 Å, with a spectroscopic resolution of λ/Δλ ∼ 1200 and a 60–80% efficiency. In all cases, we used a 1.3 arcsec slit, whereas a 5 arcsec slit was used for standard stars. Data reduction was performed using the FORS pipeline (Izzo et al. 2010) up to spectral extraction, which was then performed using Image Reduction and Analysis Facility (IRAF; Tody 1986).
OSIRIS is the work-horse imaging and spectroscopic instrument for the GTC (Cepa et al. 2003) installed at the Nasmyth focus. We carried out observations using the R1000B and R1000R gratings, with an overall spectral coverage from 3650 Å to 10 000 Å at a resolution of λ/Δλ ∼ 1000. The 1.0 arcsec slit was used for the target and for the standard star. We used standard IRAF (Tody 1986) procedures for long-slit observations to reduce tha data. Table 1 lists the sources and observational parameters used for the spectroscopic measurements of the 24 targets with spectral features or high S/N featureless spectra. Table 2 gives the parameters used in the observations at each telescope.
Spectroscopic mode, wavelength coverage, and throughput and spectral resolution of the five spectrographs, as used in this work.
All sources, except for 1RXS J035000.4+064053 and SUMMS J224017−524111, have been included not only in the 3FHL, but also in the Second Fermi-LAT Catalog of High-Energy Sources (2FHL; Ackermann et al. 2016); therefore, they has been detected by Fermi-LAT at energies higher than 50 GeV. 1RXS J035000.4+064053 and SUMMS J224017−524111 are the only sources presented in Table 1 not classified as a BL Lac object in the 4FGL-DR4 catalogue (Ballet et al. 2023). However, those two sources are classified as high-energy BL Lac objects (HBLs) in the 3HSP catalogue (Chang et al. 2019).
Table A.1 presents 26 spectra of 18 blazars observed with Lick/KAST, one of which is also reported in Table 1 (1RXS J035000.4+064053). The 17 remaining are not discussed in detail in this paper because of their low S/N and featureless spectra.
Equivalent widths in Å of the absorption features detected in the spectra at the measured redshift for each source.
5. Redshift measurement and estimation of the blazar total emission
To determine the redshift, we searched for absorption and emission features in the spectra, requiring a minimum of two independent detections corresponding to the same redshift for a robust determination. Details on the lines we searched can be found in Paper II. For each feature, we measured the EW by fitting the continuum with cubic splines and integrating the flux for each pixel. The uncertainties in the EW are determined by the quadrature sum of the normalized flux errors and the continuum placement contribution (see Sembach & Savage 1992).
The redshift uncertainty is estimated by considering the uncertainty in the position of the detected features. The feature position and its uncertainty were determined by a Gaussian fit. To this uncertainty, we added in quadrature the wavelength calibration uncertainty. The results are presented in Tables 3–6. In the case of SUMMS J224017−524111, by considering the large number of emission lines detected, the results are reported in a dedicated table.
Equivalent width (in Å) of the main emission features detected in the spectra at the measured redshift.
Equivalent widths (in Å) of the emission lines detected in SUMMS J224017−524111.
Analysis results for the sources of the ‘main sample’.
We modelled the SED with the sum of a power law for describing the jet emission and an elliptical galaxy template for describing the host (Mannucci et al. 2001; Bruzual & Charlot 2003). When needed, Gaussian emission features are added in the modelling (Pita et al. 2014) and only one template was used per spectrum for simplicity. Only two free parameters are needed: the power-law slope and jet-to-galaxy ratio. Table 6 shows the results of the fits.
We also estimated the absolute magnitude of the detected host galaxies. Slit losses are estimated by assuming the host galaxy effective radius, re, to be 10 kpc for a de Vaucouleurs profile. From the template spectra, we computed the K-corrections and did not apply evolutionary corrections. In the case of non-detection of a host, the spectra are fitted with a power law and normalised at the band centre. Due to the high S/N of the spectra, the relative errors on the fitted parameters are very small (10−3 or so). However, there is residual curvature seen in the spectra that maybe intrinsic (i.e., slope change) or due to calibration issues (fluxing and/or extinction correction). To take this into account, we fit the red and blue halves of the spectra separately and take the difference between the blue and the red parameters as 1σ errors on the parameters of the total spectrum. The uncertainties quoted in Table 6 are three times (i.e., 3σ) these values.
6. Sources and results
For the 24 sources in Table 1, twelve spectroscopic redshifts were determined, ranging from 0.2223 to 0.7018, one tentative redshift and two redshift lower limits (z > 0.6185 and z > 0.6347) were obtained. In the following we discuss the results of our observations for each of the sources.
6.1. 1RXS J005117.7–624154
A moderate S/N featureless EFOSC spectrum has been reported by Masetti et al. (2013), while Marais & van Soelen (in prep.) suggest a possible redshift of z = 0.156. We observed the source with VLT/FORS for an exposure time of 1740 s, but despite a very high S/N (212), the obtained spectrum is featureless (see Fig. 1, top panel, on the left).
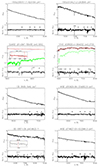 |
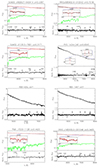
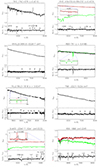
Fig. 1. Flux-calibrated and normalized spectra of the first eight sources in Table 1. Each panel contains the spectrum, continuum, and galaxy model for a given source. Each panel has two parts. Upper: Flux-calibrated and telluric-corrected spectrum (black) alongside the best fit model (red). The flux is in units of 10−16 erg cm−2 s−1 Å−1. The elliptical galaxy component is shown in green. Lower: Normalised spectrum with labels for the detected absorption features. Atmospheric telluric absorption features are indicated by the symbol ⊕ and Galactic absorption features are labelled ‘MW’. |
6.2. 1RXS J013427.2+263846
A low S/N featureless spectrum obtained with the Hobby-Eberly Telescope (HET) has been reported by Shaw et al. (2013). A moderate S/N Mayall/KOSMOS spectrum reported by Marchesi et al. (2018) shows the detection of a bright emission line. If it is interpreted as MgII, this line indicates z = 0.571. We observed the source with Keck/ESI for an exposure time of 6000 s. The resulting high S/N (135) spectrum (see Fig. 1, top panel, on the right) is featureless. The flux estimated at 5000 Å in our spectrum is only a factor of 1.5 higher than the flux in the spectrum reported in Marchesi et al. (2018), suggesting that the activity state of the AGN at the time of the two observations is not so different. We suspect that the MgII emission line reported in Marchesi et al. (2018) is an artefact.
6.3. SUMSS J014347–58455
Previous spectra obtained by SOAR, with a moderate S/N (Landoni et al. 2015), and by EFOSC, with a low S/N (Titov et al. 2017), are featureless. We performed two separate observations with SALT/RSS at distance of two days with a total exposure time of 4660 s. The total averaged spectrum with a S/N of 113 is presented in Fig. 1 (second row panel, on the left). We detected the CaH and CaIG, providing a redshift z = 0.3902 ± 0.0001. With SALT, the CaK line falls into a CCD gap.
6.4. 1RXS J035000.4+064053
No previous spectra are available in literature. We observed this source with Keck/ESI for an exposure time of 7000 s with a S/N of 46. We clearly detect in the spectrum (Fig. 1, second row panel, on the right) the host galaxy with several absorption features at z = 0.2730 ± 0.0002. We note that the jet-to-galaxy flux ratio is low at 0.4 ± 0.1, resulting in quite intense absorption lines, allowing for their detection even in a relatively low S/N spectrum. The host galaxy is quite luminous at MR = −23.1.
6.5. 1ES 0505–546
A featureless EFOSC spectrum with intermediate S/N has been reported by Masetti et al. (2013). We observed the source with SALT/RSS for an exposure time of 2340 s. Our SALT/RSS spectrum (Fig. 1, third row panel, on the left) has a high S/N (∼120) and it is featureless.
6.6. WISE J053629.06–334302.5
This BL Lac has been observed with NTT/EFOSC by Shaw et al. (2013), obtaining a medium S/N (∼40) featureless spectrum. We observed it with VLT/FORS for 1740 s. The resulting spectrum with S/N ∼ 170 (Fig. 1, third row panel, on the right) has no detectable spectral features. The redshift of WISE J053629.06−334302.5 remains unknown.
6.7. B2 0557+38
B2 0557+38 is a rather weak (i(PanStarrs) = 18.4) absorbed (EB − V = 0.484) source in the optical range. A low S/N featureless MMT spectrum has been presented in Paggi et al. (2014). The source was observed also by Paiano et al. (2020) using GTC/OSIRIS with a moderate S/N spectrum. In that spectrum, they tentatively detect the Ca II doublet at z = 0.662. We observed the source with Keck/ESI for 7200 s. In our Keck spectrum (Fig. 1, bottom panel, on the left) the detection of Ca II HK absorption feature is uncertain, but we possibly detect [OII] at z = 0.6622. Given the low S/N of the feature (38), we consider this as a tentative detection. The redshift of B2 0557+38 remains tentative. The host galaxy is very luminous at MR = −24.3.
6.8. WISE J074627.03–022549.3
An intermediate S/N featureless spectrum taken with NOT with an integration time of 1200 s has been reported by Marchesini et al. (2016). We performed an observation with Keck/ESI for 6600 s, obtaining a high S/N (∼110) spectrum (Fig. 1, bottom panel, on the right), but it is featureless. The redshift of WISE J074627.03−022549.3 remains unknown.
6.9. SUMSS J082627–640414
No previous spectrum of the source is available in literature. We performed a 2610 s observation with VLT/FORS obtaining a S/N = 112 spectrum (Fig. 2, top panel, on the left), and we are able to detected Ca II HK and other stellar features (CaIG, Mgb, CaFe, NaID) obtaining a precise redshift of z = 0.3397 ± 0.0002.
6.10. 1RXS J085802.6–313043
A moderate S/N featureless spectrum obtained at SALT with Goodman High Throughput spectrograph for 1050 s has been presented in Peña-Herazo et al. (2017). We performed three observations with VLT/FORS for a total exposure time of 7830 s, obtaining a S/N = 68 spectrum (Fig. 2, top panel, on the right). We are able to detect Ca II HK and Ca I G at a redshift z = 0.7018 ± 0.0002.
6.11. SUMSS J1130.5780105
A moderate S/N (72) spectrum obtained with CTIO/COSMOS for 3400 s has been taken by Desai et al. (2019). We performed two observations of the source with VLT/FORS for a total exposure of 4790 s. An high S/N = 119 spectrum (Fig. 2, second row panel, on the left) allows us to detect several absorption features (Ca II HK, CaIG, Mgb, Ca Fe, NaID), leading to a measured z = 0.3171 ± 0.0002, compatible with the value presented in Marais & van Soelen (in prep.). The host galaxy is quite luminous at MR = −23.2.
6.12. PKS 1424+240
PKS 1424+240 is a very bright γ-ray and TeV blazar, suggested as promising candidate neutrino emitter (Aartsen et al. 2020). A featureless spectrum was reported by Shaw et al. (2013), while Furniss et al. (2013) determined a lower limit z ≥ 0.6035 from the detection of hydrogen absorption systems in HST/COS spectra. A galaxy group at z ∼ 0.60 was identified in its environment and possibly associated with it (Rovero et al. 2016). Finally, weak detections of [OII] (EW ∼ 0.05 Å) and [OIII]b (EW ∼ 0.1 Å) emission lines at a S/N level between 3 and 5 (Paiano et al. 2017b) allowed a redshift determination of z = 0.604. While this redshift looks reliable, it would be useful to confirm it at a higher S/N level. Given that the above mentioned lines are of nebular origin and not variable (see e.g., Netzer et al. 1990), they should appear stronger when the non-thermal blazar flux declines. Thus an observation at a lower flux level of the AGN should confirm this result with higher S/N. We recently demonstrated the validity of this approach in Paper I by measuring the redshift of MAGIC J2001+435 through the detection of absorption features of the host galaxy during an optical low state.
The observations from Paiano et al. (2017b) were performed on 2015 June 30 with the source at a magnitude R = 13.8, as obtained by the Tuorla monitoring. We detected an historical minimum of PKS 1424+240 in March 2021 through the Tuorla monitoring: the flux level dropped to R = 14.70 ± 0.03, 0.9 mag lower than the values obtained during previous observations. We observed PKS 1424+240 on 2021 April 22 using OSIRIS on GTC (programme GTC02-21ADDT). Details are given in Table 1. The spectrum has a high S/N (305) and a power-law shape (Fig. 2, second row panel, on the right). In it, we detected [OII], [OIII]a and [OIII]b at EW = 0.15, 0.10, and 0.35 Å, respectively, with S/N ranging from 5 to 17 (see Table 4). The lines are thus about three times more intense than the previous detection (Fig. 3), which demonstrates the usefulness of low state spectroscopy for BL Lacs. The computed redshift is z = 0.6045 ± 0.0002, slightly higher than the value in Paiano et al. (2017b). The FWHM of the lines are 500 ± 33 km s−1 for [OII] and 400 ± 30 km s−1 for [OIII]a and [OIII]b. The redshift of PKS 1424+240 is thus confirmed with higher S/N.
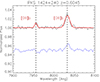 |
Fig. 3. [OIII] doublet during our observation of PKS 1424+240 above and during Paiano et al. (2017b) observations. Note: the slight depression near the [OIII]a line in the Paiano et al. (2017b) spectrum corresponds to an uncorrected telluric feature. |
6.13. RBS 1424
Two featureless high S/N spectra obtained with VLT and GTC have been reported by Sbarufatti et al. (2006) and Paiano et al. (2020), respectively. We observed the source with SALT/RSS for 2390 s. Our high S/N (∼130) spectrum (Fig. 2, third row panel, on the left) is featureless too. The redshift of the source remains undetermined.
6.14. RBS 1457
The spectrum obtained with the Hale Telescope at Mt. Palomar and presented in Shaw et al. (2013) claims the detection of an MgII absorber at ∼3380 Å, corresponding to a redshift lower limit of z ≥ 0.21. Piranomonte et al. (2007) and Paiano et al. (2020) find featureless spectra, obtained with the ESO 3.6 m and the GTC, but their range does not cover the possible absorber. We observed the source with VLT/FORS for 1950 s. The high S/N (∼120) spectrum obtained (Fig. 2, third row panel, on the right), which starts at 5100 Å, is featureless too. As in the previous observations, due to the lack of coverage for the wavelength at which the MgII absorber should be detected, with our spectrum we cannot confirm or revise the redshift lower limit suggested by Shaw et al. (2013).
6.15. PMN J1539–1128
Two intermediate S/N spectra are presented in Peña-Herazo et al. (2017), Goldoni et al. (2021), both of them featureless. We observed this BL Lac two times at separation of one day with SALT/RSS for a total exposure of 4380 s. In our high S/N (∼150) SALT/RSS spectrum (Fig. 2, bottom panel, on the left), we are able to detect Ca II HK and [OII]. We thus were able to determine the redshift of the source as z = 0.4420 ± 0.0002. The host galaxy is luminous with MR = −23.5.
6.16. 1RXS J165655.0–201049
Jones et al. (2009) reported a low S/N 6dF spectrum for this source, which has turned out to be featureless. A moderate S/N featureless spectrum obtained by SOAR/Goodman was reported in Peña-Herazo et al. (2017). We observed it with VLT/FORS, obtaining a high S/N (∼130) spectrum (Fig. 2, bottom panel, on the right). With our spectrum we were able to detect the Ca II HK, Mgb, CaFe, and NaID absorption features and determine a redshift z = 0.3405 ± 0.0002.
6.17. TXS 1742−078
TXS 1742−078 is a very absorbed source (EB − V = 0.802) near the Galactic plane (b = +10.8). A low S/N featureless spectrum obtained with the Hobby-Eberly Telescope has been presented in Shaw et al. (2013). The source has been observed with Swift-UVOT in the six UVOT filters and with SARA in SDSS g′,r′,i′, and z′ filters on 2018 August 28 (i′=17.97) but no photometric redshift or upper limit has been obtained by the SED fitting of the ten filters obtained by SARA+UVOT (Rajagopal et al. 2020). We noticed that at the time of the SARA observations the source was brighter (i′=17.97) with respect to the value reported by the Pan-STARSS survey (i = 19). We observed the source twice within a week with VLT/FORS for a total exposure time of 5200 s. In the resulting moderate S/N = 50 VLT/FORS spectrum (Fig. 4, top panel, on the left), we detected (with high S/N) the [OIII]b emission feature and with moderate S/N the [OIII]a and [OII] emission features, obtaining a redshift of z = 0.4210 ± 0.0002.
6.18. 1RXS J184230.6–584202
A moderate S/N spectrum (S/N = 33) obtained using the 4 m telescope at Cerro Tololo InterAmerican Observatory in Chile with 3600 s resulted in a featureless spectrum (Desai et al. 2019). Observations with SOAR for 2200 s, with a S/N of 27 comparable to the spectrum obtain by Desai et al. (2019), resulted to the detection of the Ca II HK absorption corresponding to a redshift z = 0.421 (Marchesini et al. 2019). Based on a moderate S/N spectrum obtained with NTT/EFOSC2 for 4500 s, in which the Ca II HK absorption has been detected, a tentative redshift of z = 0.421 has been reported in Paper I. We took two VLT/FORS observations for a total exposure time of 4100 s in order to confirm or disprove the result. In the resulting high S/N = 77 spectrum (Fig. 4, top panel, on the right), we determined a redshift z = 0.4226 ± 0.0003, based on the detection of the CaHK, CaIG, Mgb, and CaFe absorption features.
6.19. 1RXS J203650.9–332817
The redshift of the source is uncertain. A value of z = 0.237 has been suggested by Álvarez Crespo et al. (2016b) on the basis of a SOAR spectrum and the detection of the Ca II HK absorption. A low S/N NTT/EFOSC2 spectrum reported in Paper I did not offer the capability to confirm this detection. We observed it two times at a separation of two weeks with VLT/FORS for a total exposure time of 7200 s. The resulting high S/N spectrum (S/N = 143; Fig. 4, second row panel, on the left) is featureless, not confirming the redshift measurement of z = 0.237.
6.20. RBS 1751
A possible MgII absorber at z ∼ 0.681 was detected in a moderate S/N NTT/EFOSC2 spectrum presented in Goldoni et al. (2021). To confirm this redshift, we performed a short (350 s, S/N ∼ 20) VLT/FORS observation using Grism 1200B+97, confirming the absorber but at z = 0.6185 ± 0.0001 (Fig. 4, second row panel, on the right). We conclude that the blazar is at z > 0.6185. The total EW of the system is 1.70 ± 0.14 Å, and the two components have EW = 1.1 ± 0.1 Å and 0.6 ± 0.1 Å. The ratio of the two components is 1.8 ± 0.3, which indicates a saturated system (see e.g., Spitzer 1978).
6.21. RX J2156.0+1818
Two spectra of the source obtained with the Observatorio Astronómico Nacional San Pedro Mártir (OAN) for 5400 s (Álvarez Crespo et al. 2016a) and SDSS (Ahumada et al. 2020) are featureless. We took an high S/N (∼90) spectra with Keck/ESI for 6000 s (Fig. 4, third row panel, on the left) and we clearly detected a weak MgII absorber at z = 0.6347 ± 0.0001 with a total EW of 0.5 ± 0.04 Å. The two components’ EWs are 0.3 ± 0.03 Å and 0.2 ± 0.03 Å, respectively, and their ratio is 1.5 ± 0.3, indicating mild saturation. Deep imaging observations detected the host galaxy of this object (Nilsson et al., in prep.), which suggests a very bright host.
6.22. PMN J2221−5224
A spectrum of PMN J2221−5224 was reported by Shaw et al. (2013). Using NTT/EFOSC2 they obtained a featureless spectrum with low S/N. We observed the source with VLT/FORS for 900 s, obtaining an high S/N (∼150) spectrum (Fig. 4, third row panel, on the right) that is featureless. The redshift of the source remains undetermined.
6.23. SUMMS J224017−524111
A low S/N spectrum of the source obtained by CTIO with 1950 s is reported by Desai et al. (2019), resulting in a featureless spectrum. We observed it with VLT/FORS spectrum for 2600 s, obtaining a high S/N (∼90) spectrum (Fig. 4, bottom panel, on the left). We detected several absorption (CaIG, Mgb, CaFe) and emission lines (see Table 5) of the host galaxy at a common redshift of z = 0.2223 ± 0.0001.
6.24. RBS 1888
For this source, Fischer et al. (1998) propose a redshift z = 0.226 on the basis of a low S/N spectrum. To investigate this result we took an intermediate S/N (∼60) spectrum with VLT/FORS with an integration time of 3900 s (Fig. 4, bottom panel, on the right). We detected several absorption features (CaIG, Mgb, CaFe, and NaID) and the fit of these features gives a redshift z = 0.2265 ± 0.0002, thus validating the result presented in Fischer et al. (1998) with higher precision. The detection of strong Hγ absorption (EW = 2.8 ± 0.1 Å) hints at a stellar population younger than what usually is observed in the blazar hosts (see e.g., Falomo et al. 2014, Papers I and II and references therein).
7. Comparison with ZTF and ASAS-SN light curves
Spectroscopic observations triggered during a photometric minimum can improve the redshift measurement efficiency (see Sect. 6.12 of this paper and Paper I). This technique takes advantage of the weakening of the non-thermal emission during the photometric minimum of the AGN, which allows for the emergence of the host galaxy features that are used to determine the redshifts. For testing the importance of observing objects during a low-activity state, we investigated the light curves of the sources in Table 1. The light curves were collected from the Zwicky Transient Facility (ZTF; Masci et al. 2019)16 and the All Sky Automated Survey for SuperNovae (ASAS-SN; Shappee et al. 2014; Kochanek et al. 2017)17 in the period between January 2020 and March 2022 to check if our spectroscopic measurements are performed during an high-, intermediate-, or low-activity state and the effect on the redshift measurement efficiency. We briefly review the two survey characteristics. ZTF, which uses the 48-inch Oschin Schmidt telescope at Palomar Observatory, is sensitive down to r ∼ 20.6 (5σ in 30 s) and has a 1″ pixel scale, but its coverage is limited mostly to the northern hemisphere. ASAS-SN is sensitive to g ∼ 18 (5σ in 5 min) with a 8″ pixel scale and, thanks to several sites around the globe, it covers the entire sky. Whenever available, we report ZTF measurements that have smaller uncertainties.
We checked the light curves for consistency with archival photometric measurements and with our spectrophotometric magnitudes. This check led to the rejection of the ASAS-SN light curves of 1RXS J184230.6−584202 and SUMSS J113032−780105, which are strongly contaminated by nearby stars. Furthermore, the good-quality light curves of B2 0557+38, 1RXS J085802.6−313043, and TXS 1742−078 are not available due to their weakness. In Tables 7 and 8, the time separation between the spectroscopic measurement and the nearest observing data collected by ZTF and ASAS-SN, respectively, are reported together with the observed magnitude, the median, maximum, and minimum magnitude calculated over the entire period considered, and the redshift or lower limit measured in this paper.
Comparison with ZTF light curves (r band except 1RXS J013427.2+263846).
Comparison with ASAS-SN light curves (g band).
Taking a look at the ZTF light curves (Table 7), at the time of our spectroscopic observations, 7 out of 11 sources have been observed at a magnitude comparable or higher (thus, a lower brightness) with respect to the median magnitude (hereafter, ‘low state’) during 2020–2022. In particular, in the case of 1RXS J165655.0−201049 and RBS 1888, the sources have been observed almost at the minimum magnitude. For five of these seven sources, a redshift has been determined with our new spectroscopic observations, the only exceptions being RBS 1457 and RBS 1751 (for which a high lower limit has been estimated). The other four sources have been observed at a lower magnitude (thus higher brightness) with respect to the median magnitude (‘high state’) and no redshift has been determined.
In case of the ASAS-SN light curves, five out of eight sources have been observed in a low or intermediate (i.e., at a magnitude comparable to the median value) state, resulting in 2 redshift determinations. On the other hand, three sources have been observed in an high state with respect of the median value resulting in one redshift determination. The only source for which the redshift has been measured in high state is SUMSS J224017−524111, which has a low jet-to-galaxy ratio (2.6 ± 0.2) and several emission lines, thereby simplifying the detection.
In total, 12 sources in a low state (or intermediate in case of PMN J1539−1128 and SUMSS J082627−640414) yield 7 redshifts, while 7 sources in high state yield 1 redshift. As expected, ‘low state’ observations are preferable for redshift determination. We suggest that observers, when possible, should take into account this parameter when programming their spectroscopic observations.
Number of observed sources, along with redshift and lower limit measurements (uncertain results given in parentheses) for different groups of sources and for the whole sample for Paper I, Paper II, this paper (Paper III), and the combined results of our programme.
8. Conclusions
In this work, 41 BL Lacs, which have been included in the 3FHL catalogue and selected as potential candidates for future observations with CTAO, were observed with Keck II, Lick, SALT, VLT, and GTC telescopes. The 41 targets are divided in 24 taken with 8-m class telescopes and whose spectra have been described in detail and 17, which only have low S/N, featureless spectra taken with the Lick telescope and are not discussed in detail here. Of the 24 sources, 12 spectroscopic redshift (values between 0.2223 and 0.7018) and 1 tentative redshift (0.6622) have been determined. We also measured two redshift lower limits, z > 0.6185 and z > 0.6347. Taking a look at the quality of the spectra collected, for 15 out 24 BL Lacs, the S/N of the spectrum has been higher than 100; but it is only for 6 of them that a redshift measurement has been obtained. For the remaining 9 objects, the S/N values range between 23 and 95, from which we measured 6 firm redshifts, 1 tentative redshift, and 2 lower limits. As already noted in Paper II, an high S/N of the spectrum is an important but not sufficient condition for obtaining a redshift measurement. In fact, the contribution of the non-thermal jet emission can play an even more important role for the detection. We checked the activity level of the AGN in our sample investigating the ZTF and ASAS-SN light curves at the time of our spectroscopic observations and we found a high level of efficiency in the redshift detection in case of a low- or intermediate-activity state of the AGN; and, thus, a lower contribution of the non-thermal jet emission to the continuum spectrum. The case of PKS 1424+240, in which the emission lines observed by GTC during a low activity state are three times more intense than the lines previously observed, allowing us to improve the redshift determination of the source and confirming the importance of the optical state of the AGN. Following this indication, we are monitoring the optical state of the sources in our sample with the Telescopi Joan Oró (TJO; Colomé et al. 2010) and the Rapid Eye Mount (REM; Zerbi et al. 2001; Covino et al. 2004) in order to perform follow-up spectroscopic observations of the targets in a low state.
The 11 firmly detected host galaxies in this paper have an average magnitude of MR = −22.9, brighter than the values obtained in Papers I and II. All the 11 sources can be adequately fitted with a local elliptical template (Mannucci et al. 2001). Emission lines are detected for five objects, all of them with an equivalent width smaller that the 5 Å, limit historically used to separate FSRQ and BL Lacs.
The redshift measurement efficiency for the 24 sources taken with 8-m class telescopes is about 54 per cent, comparable to the results in Papers I and II. The median redshift obtained with the new observations  is comparable to the value reported in Paper II (
 ) and higher than the value reported in Paper I (
 ). We also computed the combined results of our programme to date (see Table 9). To do this, we took into account repeated observations. In this paper, we re-observed PKS 1424+240, PMN J1539–1128, 1RXS J184230.6–584202 (confirming its tentative redshift reported in Paper I), 1RXS J203650.9–332817, and RBS 1751 (confirming its tentative lower limit reported in Paper I). Thus, we have two tentative redshifts remaining (B2 0557+38 from this paper and RX J0819.2+0756 from Paper II) and no tentative lower limits remaining. Up to now, we observed 63 independent targets and obtained 37 solid redshifts with an efficiency of about 59% and a median redshift
  = 0.30.
By considering the high efficiency of redshift determinations in cases of low activity of the AGN, re-observations of sources for which a featureless spectrum has been obtained, despite a S/N > 100 spectrum, will be performed during a low activity state. For a better characterization of our sample of BL Lac objects, we are also currently performing deep near-IR imaging of these sources (Nilsson et al., in prep.). The most distant host galaxy we detected is that of RX J2156.0+1818, for which we report a spectroscopic lower limit of 0.6347 here.
With the new spectroscopic observations performed here, we obtained 9 redshifts and 1 tentative redshift higher than 0.3, similar to the numbers obtained in Paper II (i.e., 8 redshift and 1 tentative redshift with z > 0.3), but significantly higher than the numbers obtained in Paper I (i.e., 2 redshifts and 1 tentative redshift with z > 0.3). In total, 19 redshifts and 1 tentative redshift with z > 0.3 have been determined in our programme. As a comparison, 9 BL Lacs with redshifts of z > 0.3 are reported in TeVCat presently. Our sources thus represent an important pool of possible TeV sources at z > 0.3 that can be targets of VHE ground-based observatories such as CTAO. These objects are important for determining the luminosity function of BL Lacs and for EBL studies. For this reason, this redshift measurement campaign is recognized as necessary to support for future CTAO observations of AGN, in particular, for CTAO Key Science Projects on AGNs (e.g., Cherenkov Telescope Array Consortium 2021; Abdalla et al. 2021).
Echellette Spectrograph and Imager (ESI) on the Keck II telescope, https://www.keckobservatory.org/about/telescopes-instrumentation
KAST Double Spectrograph on the Shane telescope at the Lick Observatory, https://mthamilton.ucolick.org/techdocs/instruments/kast/
Robert Stobie Spectrograph (RSS) on the Southern African Large Telescope (SALT), www.salt.ac.za/telescope
FOcal Reducer and low dispersion Spectrograph (FORS) on the Very Large Telescope (VLT), https://www.eso.org/sci/facilities/paranal/instruments/fors.html
Optical System for Imaging and low-Intermediate-Resolution Integrated Spectroscopy (OSIRIS) on the Gran Canarias Telescope (GTC) http://www.gtc.iac.es/instruments/osiris/
Acknowledgments
This paper went through internal review by the CTA consortium. We thank M. Cerruti and N. Masetti for their helpful comments and suggestions as internal CTA reviewers. This research has made use of the CTA instrument response functions provided by the CTA Consortium and Observatory, see https://www.cta-observatory.org/science/cta-performance/ (version prod3b-v1) for more details. We gratefully acknowledge financial support from the agencies and organisations listed here: http://www.cta-observatory.org/consortium_acknowledgments, and in particular the U.S. National Science Foundation Grant PHY-2011420. The authors wish to recognise and acknowledge the very significant cultural role and reverence that the summit of Maunakea has always had within the indigenous Hawaiian community. We are most fortunate to have the opportunity to conduct observations from this mountain. Some of the observations reported in this paper were obtained with the Southern African Large Telescope (SALT). Based on observations made with the GTC telescope, in the Spanish Observatorio del Roque de los Muchachos of the Instituto de Astrofísica de Canarias, under Director’s Discretionary Time. This research has made use of the SIMBAD database, operated at CDS, Strasbourg, France. We thanks the anonymous referee for careful checking the manuscript and providing useful comments and suggestions.
References
- Aartsen, M. G., Ackermann, M., Adams, J., et al. 2020, Phys. Rev. Lett., 124, 051103 [Google Scholar]
- Abdalla, H., Abe, H., Acero, F., et al. 2021, J. Cosmol. Astropart. Phys., 2021, 048 [CrossRef] [Google Scholar]
- Acciari, V. A., Ansoldi, S., Antonelli, L. A., et al. 2019, MNRAS, 486, 4233 [NASA ADS] [CrossRef] [Google Scholar]
- Ackermann, M., Ajello, M., Atwood, W. B., et al. 2016, ApJS, 222, 5 [Google Scholar]
- Aharonian, F., Akhperjanian, A. G., Bazer-Bachi, A. R., et al. 2006, A&A, 457, 899 [NASA ADS] [CrossRef] [EDP Sciences] [Google Scholar]
- Ahumada, R., Allende Prieto, C., Almeida, A., et al. 2020, ApJS, 249, 3 [NASA ADS] [CrossRef] [Google Scholar]
- Ajello, M., Shaw, M. S., Romani, R. W., et al. 2012, ApJ, 751, 108 [NASA ADS] [CrossRef] [Google Scholar]
- Ajello, M., Gasparrini, D., Romani, R. W., & Shaw, M. S. 2014, Am. Astron. Soc. Meet. Abstr., 224, 410.09 [NASA ADS] [Google Scholar]
- Ajello, M., Atwood, W. B., Baldini, L., et al. 2017, ApJS, 232, 18 [Google Scholar]
- Aleksić, J., Ansoldi, S., Antonelli, L. A., et al. 2016a, Astropart. Phys., 72, 61 [Google Scholar]
- Aleksić, J., Ansoldi, S., Antonelli, L. A., et al. 2016b, Astropart. Phys., 72, 76 [Google Scholar]
- Álvarez Crespo, N., Masetti, N., Ricci, F., et al. 2016a, AJ, 151, 32 [CrossRef] [Google Scholar]
- Álvarez Crespo, N., Massaro, F., Milisavljevic, D., et al. 2016b, AJ, 151, 95 [CrossRef] [Google Scholar]
- Angel, J. R. P., & Stockman, H. S. 1980, ARA&A, 18, 321 [NASA ADS] [CrossRef] [Google Scholar]
- Angelakis, E., Hovatta, T., Blinov, D., et al. 2016, MNRAS, 463, 3365 [NASA ADS] [CrossRef] [Google Scholar]
- Appenzeller, I., Fricke, K., Fürtig, W., et al. 1998, The Messenger, 94, 1 [NASA ADS] [Google Scholar]
- Atwood, W. B., Abdo, A. A., Ackermann, M., et al. 2009, ApJ, 697, 1071 [CrossRef] [Google Scholar]
- Ballet, J., Bruel, P., Burnett, T. H., & Lott, B., & The Fermi-LAT Collaboration 2023, ArXiv e-prints [arXiv:2307.12546] [Google Scholar]
- Biteau, J., & Williams, D. A. 2015, ApJ, 812, 60 [CrossRef] [Google Scholar]
- Bruzual, G., & Charlot, S. 2003, MNRAS, 344, 1000 [NASA ADS] [CrossRef] [Google Scholar]
- Burgh, E. B., Nordsieck, K. H., Kobulnicky, H. A., et al. 2003, in Prime Focus Imaging Spectrograph for the Southern African Large Telescope: Optical Design, eds. M. Iye, & A. F. M. Moorwood, SPIE Conf. Ser., 4841, 1463 [Google Scholar]
- Cepa, J., Aguiar-Gonzalez, M., Bland-Hawthorn, J., et al. 2003, in Instrument Design and Performance for Optical/Infrared Ground-based Telescopes, eds. M. Iye, & A. F. M. Moorwood, SPIE Conf. Ser., 4841, 1739 [NASA ADS] [CrossRef] [Google Scholar]
- Chang, Y. L., Arsioli, B., Giommi, P., Padovani, P., & Brandt, C. H. 2019, A&A, 632, A77 [NASA ADS] [CrossRef] [EDP Sciences] [Google Scholar]
- Cherenkov Telescope Array Consortium 2019, Science with the Cherenkov Telescope Array (Singapour: World Scientific Publishing) [Google Scholar]
- Cherenkov Telescope Array Consortium 2021, J. Cosmol. Astropart. Phys., 02, 048 [Google Scholar]
- Colomé, J., Ribas, I., Francisco, X., et al. 2010, Adv. Astron., 2010, 183016 [Google Scholar]
- Covino, S., Stefanon, M., Sciuto, G., et al. 2004, in Ground-based Instrumentation for Astronomy, eds. A. F. M. Moorwood, & M. Iye, SPIE Conf. Ser., 5492, 1613 [NASA ADS] [CrossRef] [Google Scholar]
- Deil, C., Zanin, R., Lefaucheur, J., et al. 2017, Int. Cosmic Ray Conf., 301, 766 [Google Scholar]
- Desai, A., Marchesi, S., Rajagopal, M., & Ajello, M. 2019, ApJS, 241, 5 [NASA ADS] [CrossRef] [Google Scholar]
- Domínguez, A., Primack, J. R., Rosario, D. J., et al. 2011, MNRAS, 410, 2556 [Google Scholar]
- Donath, A., Terrier, R., Remy, Q., et al. 2023, A&A, 678, A157 [NASA ADS] [CrossRef] [EDP Sciences] [Google Scholar]
- Dwek, E., & Krennrich, F. 2013, Astropart. Phys., 43, 112 [NASA ADS] [CrossRef] [Google Scholar]
- Falomo, R., Pian, E., & Treves, A. 2014, A&ARv, 22, 73 [NASA ADS] [CrossRef] [Google Scholar]
- Fischer, J. U., Hasinger, G., Schwope, A. D., et al. 1998, Astron. Nachr., 319, 347 [NASA ADS] [CrossRef] [Google Scholar]
- Furniss, A., Williams, D. A., Danforth, C., et al. 2013, ApJ, 768, L31 [NASA ADS] [CrossRef] [Google Scholar]
- Goldoni, P., Pita, S., Boisson, C., et al. 2021, A&A, 650, A106 (Paper I) [NASA ADS] [CrossRef] [EDP Sciences] [Google Scholar]
- Gould, R. J., & Schréder, G. 1966, Phys. Rev. Lett., 16, 252 [NASA ADS] [CrossRef] [Google Scholar]
- Hauser, M. G., & Dwek, E. 2001, ARA&A, 39, 249 [Google Scholar]
- Holder, J., Atkins, R. W., Badran, H. M., et al. 2006, Astropart. Phys., 25, 391 [NASA ADS] [CrossRef] [Google Scholar]
- Izzo, C., de Bilbao, L., Larsen, J., et al. 2010, in Observatory Operations: Strategies, Processes, and Systems III, eds. D. R. Silva, A. B. Peck, & B. T. Soifer, SPIE Conf. Ser., 7737, 773729 [CrossRef] [Google Scholar]
- Jones, D. H., Read, M. A., Saunders, W., et al. 2009, MNRAS, 399, 683 [Google Scholar]
- Jorstad, S. G., Marscher, A. P., Morozova, D. A., et al. 2017, ApJ, 846, 98 [Google Scholar]
- Kasai, E., Goldoni, P., Pita, S., et al. 2023, MNRAS, 518, 2675 (Paper II) [Google Scholar]
- Kochanek, C. S., Shappee, B. J., Stanek, K. Z., et al. 2017, PASP, 129, 104502 [Google Scholar]
- Landoni, M., Massaro, F., Paggi, A., et al. 2015, AJ, 149, 163 [Google Scholar]
- Lister, M. L., Aller, M., Aller, H., et al. 2011, ApJ, 742, 27 [CrossRef] [Google Scholar]
- Mannucci, F., Basile, F., Poggianti, B. M., et al. 2001, MNRAS, 326, 745 [Google Scholar]
- Marchesi, S., Kaur, A., & Ajello, M. 2018, AJ, 156, 212 [NASA ADS] [CrossRef] [Google Scholar]
- Marchesini, E. J., Masetti, N., Chavushyan, V., et al. 2016, A&A, 596, A10 [NASA ADS] [CrossRef] [EDP Sciences] [Google Scholar]
- Marchesini, E. J., Peña-Herazo, H. A., Álvarez Crespo, N., et al. 2019, Ap&SS, 364, 5 [NASA ADS] [CrossRef] [Google Scholar]
- Masci, F. J., Laher, R. R., Rusholme, B., et al. 2019, PASP, 131, 018003 [Google Scholar]
- Masetti, N., Sbarufatti, B., Parisi, P., et al. 2013, A&A, 559, A58 [NASA ADS] [CrossRef] [EDP Sciences] [Google Scholar]
- Massaro, E., Maselli, A., Leto, C., et al. 2015a, Ap&SS, 357, 75 [Google Scholar]
- Massaro, F., D’Abrusco, R., Landoni, M., et al. 2015b, ApJS, 217, 2 [NASA ADS] [CrossRef] [Google Scholar]
- Massaro, F., Landoni, M., D’Abrusco, R., et al. 2015c, A&A, 575, A124 [NASA ADS] [CrossRef] [EDP Sciences] [Google Scholar]
- Netzer, H. 1990, Active Galactic Nuclei, eds. R. D. Blandford, H. Netzer, L. Woltjer, T. J. L. Courvoisier, & M. Mayor (Berlin: Springer-Verlag), 57 [Google Scholar]
- Nigro, C., Deil, C., Zanin, R., et al. 2019, A&A, 625, A10 [NASA ADS] [CrossRef] [EDP Sciences] [Google Scholar]
- Paggi, A., Milisavljevic, D., Masetti, N., et al. 2014, AJ, 147, 112 [NASA ADS] [CrossRef] [Google Scholar]
- Paiano, S., Falomo, R., Franceschini, A., Treves, A., & Scarpa, R. 2017a, ApJ, 851, 135 [NASA ADS] [CrossRef] [Google Scholar]
- Paiano, S., Landoni, M., Falomo, R., et al. 2017b, ApJ, 837, 144 [Google Scholar]
- Paiano, S., Falomo, R., Treves, A., & Scarpa, R. 2020, MNRAS, 497, 94 [CrossRef] [Google Scholar]
- Peña-Herazo, H. A., Marchesini, E. J., Álvarez Crespo, N., et al. 2017, Ap&SS, 362, 228 [CrossRef] [Google Scholar]
- Peña-Herazo, H. A., Amaya-Almazán, R. A., Massaro, F., et al. 2020, A&A, 643, A103 [NASA ADS] [CrossRef] [EDP Sciences] [Google Scholar]
- Piranomonte, S., Perri, M., Giommi, P., Landt, H., & Padovani, P. 2007, A&A, 470, 787 [NASA ADS] [CrossRef] [EDP Sciences] [Google Scholar]
- Pita, S., Goldoni, P., Boisson, C., et al. 2014, A&A, 565, A12 [NASA ADS] [CrossRef] [EDP Sciences] [Google Scholar]
- Rajagopal, M., Kaur, A., Ajello, M., et al. 2020, ApJ, 898, 18 [NASA ADS] [CrossRef] [Google Scholar]
- Rovero, A. C., Muriel, H., Donzelli, C., & Pichel, A. 2016, A&A, 589, A92 [NASA ADS] [CrossRef] [EDP Sciences] [Google Scholar]
- Sbarufatti, B., Treves, A., Falomo, R., et al. 2006, AJ, 132, 1 [NASA ADS] [CrossRef] [Google Scholar]
- Sembach, K. R., & Savage, B. D. 1992, ApJS, 83, 147 [NASA ADS] [CrossRef] [Google Scholar]
- Shappee, B. J., Prieto, J. L., Grupe, D., et al. 2014, ApJ, 788, 48 [Google Scholar]
- Shaw, M. S., Romani, R. W., Cotter, G., et al. 2013, ApJ, 764, 135 [NASA ADS] [CrossRef] [Google Scholar]
- Sheinis, A. I., Bolte, M., Epps, H. W., et al. 2002, PASP, 114, 851 [Google Scholar]
- Spitzer, L. 1978, Physical Processes in the Interstellar Medium (New York: Wiley) [Google Scholar]
- Titov, O., Pursimo, T., Johnston, H. M., et al. 2017, AJ, 153, 157 [Google Scholar]
- Tody, D. 1986, in The IRAF Data Reduction and Analysis System, ed. D. L. Crawford, SPIE Conf. Ser., 627, 733 [NASA ADS] [Google Scholar]
- Urry, C. M., Scarpa, R., O’Dowd, M., et al. 2000, ApJ, 532, 816 [NASA ADS] [CrossRef] [Google Scholar]
- Vermeulen, R. C., & Cohen, M. H. 1994, ApJ, 430, 467 [NASA ADS] [CrossRef] [Google Scholar]
- Wagner, S. J., & Witzel, A. 1995, ARA&A, 33, 163 [NASA ADS] [CrossRef] [Google Scholar]
- Wakely, S. P., & Horan, D. 2008, Int. Cosmic Ray Conf., 3, 1341 [NASA ADS] [Google Scholar]
- Zerbi, R. M., Chincarini, G., Ghisellini, G., et al. 2001, Astron. Nachr., 322, 275 [Google Scholar]
Appendix A: ‘Additional sample’ observations with the Lick telescope
Additional observations performed with Lick/KAST are reported here. They yield S/N < 100 and no detection of spectral features for a total of 26 spectra for 18 blazars. One of them (1RXS J035000.4+064053) has an high S/N spectrum obtained with Keck/ESI, reported in Table1.
Analysis results on 26 featureless spectra of 18 blazars observed with Lick/KAST. They include one spectrum of 1RXS J035000.4+064053 for which we report Keck/ESI observations in Table 3 which resulted in its redshift measurement: z = 0.2730. The Lick/KAST spectrum has a S/N that is too low to confirm this result.
All Tables
Spectroscopic mode, wavelength coverage, and throughput and spectral resolution of the five spectrographs, as used in this work.
Equivalent widths in Å of the absorption features detected in the spectra at the measured redshift for each source.
Equivalent width (in Å) of the main emission features detected in the spectra at the measured redshift.
Equivalent widths (in Å) of the emission lines detected in SUMMS J224017−524111.
Number of observed sources, along with redshift and lower limit measurements (uncertain results given in parentheses) for different groups of sources and for the whole sample for Paper I, Paper II, this paper (Paper III), and the combined results of our programme.
Analysis results on 26 featureless spectra of 18 blazars observed with Lick/KAST. They include one spectrum of 1RXS J035000.4+064053 for which we report Keck/ESI observations in Table 3 which resulted in its redshift measurement: z = 0.2730. The Lick/KAST spectrum has a S/N that is too low to confirm this result.
All Figures
|
Fig. 1. Flux-calibrated and normalized spectra of the first eight sources in Table 1. Each panel contains the spectrum, continuum, and galaxy model for a given source. Each panel has two parts. Upper: Flux-calibrated and telluric-corrected spectrum (black) alongside the best fit model (red). The flux is in units of 10−16 erg cm−2 s−1 Å−1. The elliptical galaxy component is shown in green. Lower: Normalised spectrum with labels for the detected absorption features. Atmospheric telluric absorption features are indicated by the symbol ⊕ and Galactic absorption features are labelled ‘MW’. |
| In the text | |
|
Fig. 3. [OIII] doublet during our observation of PKS 1424+240 above and during Paiano et al. (2017b) observations. Note: the slight depression near the [OIII]a line in the Paiano et al. (2017b) spectrum corresponds to an uncorrected telluric feature. |
| In the text | |
Current usage metrics show cumulative count of Article Views (full-text article views including HTML views, PDF and ePub downloads, according to the available data) and Abstracts Views on Vision4Press platform.
Data correspond to usage on the plateform after 2015. The current usage metrics is available 48-96 hours after online publication and is updated daily on week days.
Initial download of the metrics may take a while.