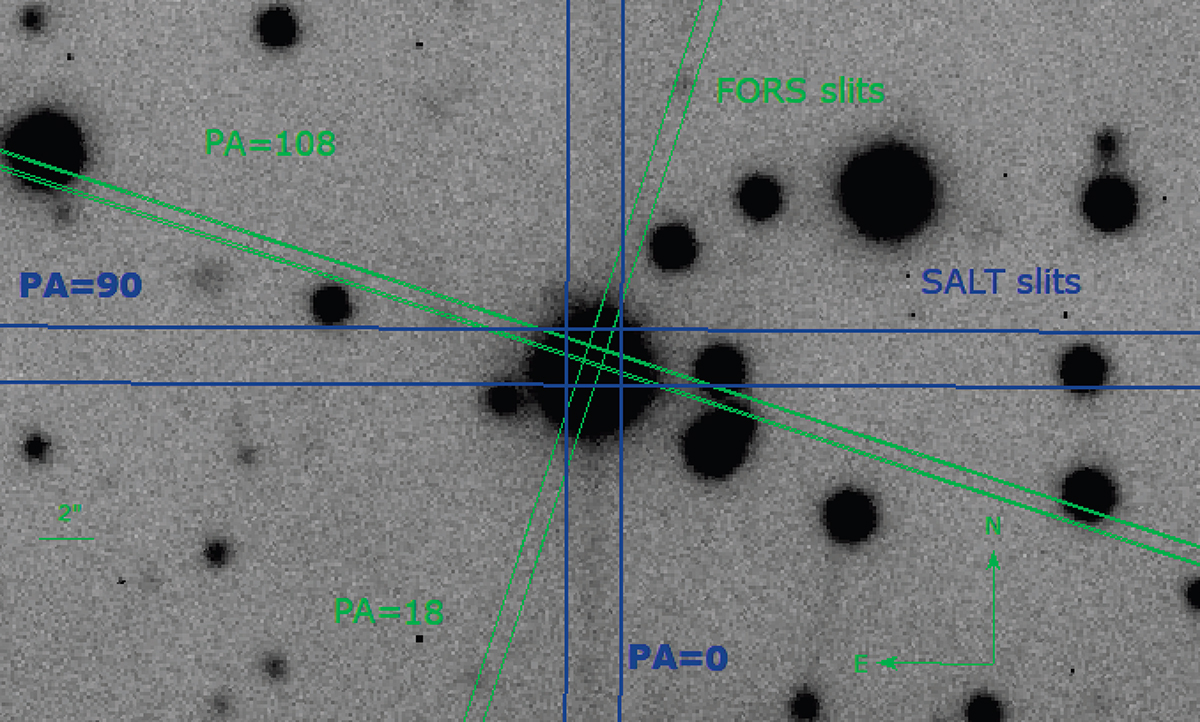
Fig. A.1.
Download original image
Slit positions of our observations superimposed on a SUperb Seeing Imager R-band image of the field (observation date 1994-01-08) retrieved from the ESO archive. Note that, as the star is much brighter than the blazar in this observation, the centres of our observations are offset from the centre of the optical emission. The blue lines represent the SALT slits, (width = 2″) and the green lines represent the FORS2 slits (width = 0.7″ and 0.5″). Position angles (in degrees) are also indicated near the corresponding slits with corresponding colors.
Current usage metrics show cumulative count of Article Views (full-text article views including HTML views, PDF and ePub downloads, according to the available data) and Abstracts Views on Vision4Press platform.
Data correspond to usage on the plateform after 2015. The current usage metrics is available 48-96 hours after online publication and is updated daily on week days.
Initial download of the metrics may take a while.