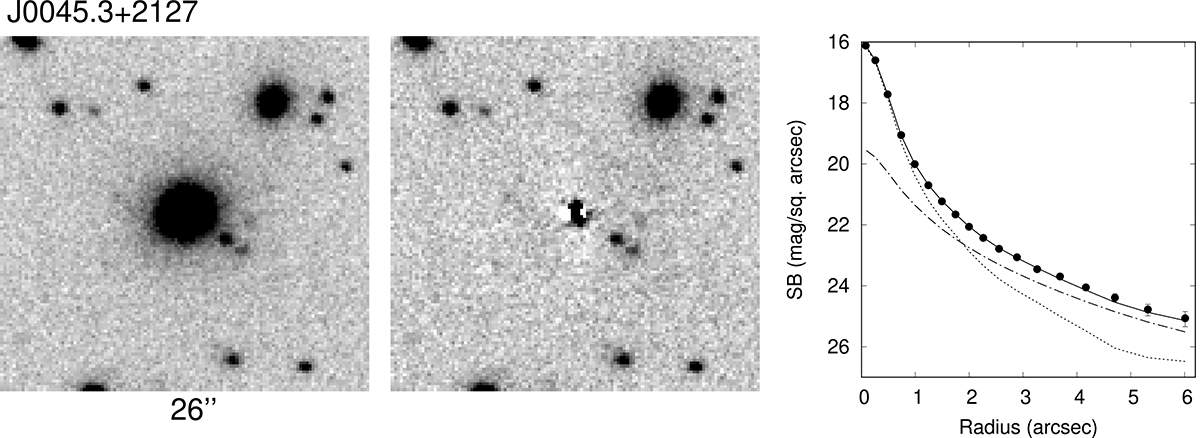
Fig. 2.
Download original image
Example of the AGN + host galaxy decomposition. The complete results are presented in Appendix A. Left panel: Grey-scale image of the target. North is up, and east is to the left. The field of view is given under the figure. Middle panel: Same image after subtracting the model. Right panel: Radial surface brightness profiles of the target (filled symbols), model (solid line), AGN nucleus (dashed line), and host galaxy (dot dashed line).
Current usage metrics show cumulative count of Article Views (full-text article views including HTML views, PDF and ePub downloads, according to the available data) and Abstracts Views on Vision4Press platform.
Data correspond to usage on the plateform after 2015. The current usage metrics is available 48-96 hours after online publication and is updated daily on week days.
Initial download of the metrics may take a while.