| Issue |
A&A
Volume 691, November 2024
|
|
|---|---|---|
| Article Number | A65 | |
| Number of page(s) | 11 | |
| Section | Galactic structure, stellar clusters and populations | |
| DOI | https://doi.org/10.1051/0004-6361/202450106 | |
| Published online | 30 October 2024 | |
The Smallest Scale of Hierarchy Survey (SSH)
III. Dwarf-dwarf satellite merging phenomena in the low-mass regime
1
Leibniz-Institut für Astrophysik Potsdam (AIP),
An der Sternwarte 16,
14482
Potsdam,
Germany
2
INAF–Osservatorio di Astrofisica e Scienza dello Spazio di Bologna,
Via Gobetti 93/3,
40129
Bologna,
Italy
3
European Southern Observatory,
Karl-Schwarzschild-Strasse 2,
85748,
Garching bei München,
Germany
4
Macalester College,
1600 Grand Avenue,
Saint Paul,
MN
55105,
USA
5
Department of Physics and Astronomy, Dartmouth College,
17 Fayerweather Hill Rd,
Hanover,
NH
03755,
USA
6
INAF – Osservatorio Astronomico di Roma,
Via Frascati 33,
00078
Monte Porzio Catone,
Italy
7
University Observatory, Faculty of Physics, Ludwig-Maximilians-Universität,
Scheinerstr. 1,
81679
München,
Germany
8
Department of Astronomy, Indiana University,
727 East 3rd Street,
Bloomington,
IN
47405,
USA
9
Department of Physics – University of Pisa,
Largo B. Pontecorvo 3,
56127
Pisa,
Italy
10
INFN – Istituto Nazionale di Fisica Nucleare,
Largo B. Pontecorvo 3,
56127
Pisa,
Italy
11
INAF – Osservatorio Astrofisico di Arcetri,
Largo E. Fermi 5,
50125
Firenze,
Italy
★ Corresponding author; This email address is being protected from spambots. You need JavaScript enabled to view it.
Received:
24
March
2024
Accepted:
4
June
2024
Abstract
We present new deep, wide-field imaging data from the Large Binocular Telescope (LBT) in g and r bands from the Smallest Scale of Hierarchy Survey (SSH) that reveal previously undetected tidal features and stellar streams in the outskirts of six dwarf irregular galaxies (NGC 5238, UGC 6456, UGC 6541, UGC 7605, UGC 8638, and UGC 8760) with stellar masses in the range 1.2 × 10⁷ M⊙ to 1.4 × 10⁸ M⊙. The six dwarfs are located 1-2 Mpc away from large galaxies, which implies that the observed distortions are unlikely to be due to tidal effects from a nearby, massive companion. At the distances of ~3-4 Mpc at which the dwarfs lie, the identified tidal features are all resolved into individual stars in the LBT images and appear to consist of a population older than 1–2 Gyr. This excludes the possibility that they result from irregular and asymmetric star formation episodes that are common in gas-rich dwarf galaxies. The most plausible explanation is that we witness the hierarchical merging assembly of these dwarfs with their satellite populations. This scenario is also supported by the peculiar morphology and disturbed velocity field of their HI component. From the SSH sample, we estimate that a fraction of ~13% of the late-type dwarfs show signs of merging with satellites. This is in agreement with other recent independent studies and theoretical predictions within the ΛCDM cosmological framework.
Key words: galaxies: dwarf / galaxies: evolution / galaxies: interactions / galaxies: irregular / galaxies: stellar content
© The Authors 2024
 Open Access article, published by EDP Sciences, under the terms of the Creative Commons Attribution License (https://creativecommons.org/licenses/by/4.0), which permits unrestricted use, distribution, and reproduction in any medium, provided the original work is properly cited.
This article is published in open access under the Subscribe to Open model. This email address is being protected from spambots. You need JavaScript enabled to view it. to support open access publication.
1 Introduction
The lambda cold dark matter (ΛCDM) cosmological scenario has proven remarkably successful at explaining the origin and evolution of large-scale structures in the Universe (White & Rees 1978; Planck Collaboration XIII 2016). However, when zooming-in to the dwarf galaxy regime, the comparison between predictions and observations becomes less extensive and somewhat challenging (Bullock & Boylan-Kolchin 2017). In particular, the self-similarity of the ΛCDM predicts that even low-mass host halos should have substructures down to the resolution limit of the simulations (Wetzel et al. 2016; Dooley et al. 2017; Besla et al. 2018; Jahn et al. 2019; Wang et al. 2020). This means that present-day dwarf galaxies should be surrounded by satellites and stellar streams (Diemand et al. 2008). This circumstance has not been sufficiently verified until recently.
The Magellanic Clouds (MC) are a most unique example in this context. A number of new satellites were found around them by deep imaging surveys (e.g., Drlica-Wagner et al. 2015; Martin et al. 2015; Nidever et al. 2017; Koposov et al. 2018; Torrealba et al. 2018; Cerny et al. 2023), providing a great opportunity to test ΛCDM models. A deeper insight into the satellite population around nearby dwarfs is still needed to place stronger constraints on cosmological models at small scales and understand how interaction and accretion events impact the evolution of dwarf galaxies, affect their morphology and kinematics, and possibly provide a viable mechanism to trigger the inflow of gas and the onset of starbursts (Bekki 2008; Stierwalt et al. 2015; Carlin et al. 2016; Kado-Fong et al. 2020).
By definition, satellites of dwarfs (or their disrupted relics) should be very faint and have a low surface brightness. This makes them very hard to detect. Consequently, direct observational evidence for merging events in dwarfs beyond the Local Group is limited to a few examples, such as the Magellanic irregular NGC 4449 (Martínez-Delgado et al. 2012), the extremely metal-poor DDO 68 (Annibali et al. 2016), or the sample of interacting dwarfs by Paudel et al. (2018), all systems with relatively high stellar masses (M★ ~ 108–109 M⊙). Moreover, the Local Group is quite an evolved system, and dwarfs in younger, less evolved groups should be studied as well.
To make improvements in this direction, we carried out a systematic search of the traces of merger events around dwarf galaxies. The Smallest Scale of Hierarchy Survey (SSH; Annibali et al. 2020) was specifically designed to determine the frequency and properties of interaction and merging events around a large sample of dwarf galaxies by exploiting the high sensitivity and large field of view (≃23′ × 23′) of the Large Binocular Camera (LBC) on the Large Binocular Telescope (LBT). We acquired deep g and r images for 45 late-type dwarfs at distances between ~1 and ~10 Mpc with the aim of revealing the presence of faint tidal features around them down to a surface brightness of μr ≃ 31 mag/arcsec2 (where r is in the SDSS system, thus AB mag, as in the remainder of the paper). For the nearest galaxies in the sample, within a distance of ~5 Mpc, this can be efficiently accomplished by selecting individual stars in the color-magnitude diagrams (CMDs) that are associated with the dwarf galaxy or with a potential satellite, and by then exploring their spatial distribution.
In this paper, we present the most striking examples of tidal and accretion features we identified in six dwarfs (NGC 5238, UGC 6456, UGC 6541, UGC 7605, UGC 8638, and UGC 8760) out of the entire SSH sample. These galaxies, with stellar masses between ~107 and 108 M⊙, represent some of the smallest systems observed so far. They bear signs of merging events with one or more smaller companions.
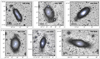 |
Fig. 1 LBT images of the six galaxies in the SSH survey exhibiting clear tidal features in their external regions. The grayscale maps highlight the low surface brightness emission, and the g, r color-combined maps are used to emphasize the morphology of the central starburst regions. The horizontal black bar is 1 kpc long, adopting the distances listed in Table 1. (North is up, and east is to the left.) |
2 Tidal features in dwarf galaxies
Fig. 1 shows portions of the LBT images centered on the six galaxies with tidal features, whose properties are summarized in Table 1. In the plot, grayscale tones are used to highlight the low surface brightness emission of the galaxies, while g, r color- combined images illustrate the morphology of the central starforming regions.
The detected tidal features appear as low surface brightness asymmetrical structures protruding from the main body of the galaxies and extending up to ~2–3 kpc away from the center. They are reminiscent of shells (UGC 7605), giant plumes (UGC 6541, NGC 5238 south, UGC 8638, and UGC 6456) and umbrella-like features (NGC 5238 north and UGC 8760), similar to those described in Martínez-Delgado et al. (2010) in their classification of the most common signatures of satellite mergers that occurred in real and simulated (large) galaxies.
The substructures in UGC 6456, UGC 6541, and UGC 8638 appear to be aligned with the galaxy major axis, protruding from the two opposite sides of the main body. This resembles the disk-like substructures observed by Bellazzini et al. (2011) in UGC 4879, but in contrast to that case, here there is always a significant asymmetry in shape, extension, and/or surface density between the substructures at the opposite sides of the same galaxy. In UGC 8760, a clump of stars is detected to the northeast that appears to be connected to the main galaxy by a sort of bridge, while a less prominent overdensity is visible in the southern part of the galaxy. A similar morphology is revealed in NGC 5238, with an umbrella feature to the north that is connected to the main galaxy by a bridge, and a more sparse overdensity of stars to the south. In UGC 7605, the shell-like feature seems to encircle the southern part of galaxy, outlining what appears as a sort of fan. These types of low surface brightness substructures are commonly interpreted as the result of a merging event with a smaller satellite that becomes tidally disrupted while still in orbit around the main galaxy (Bullock & Johnston 2005; Johnston et al. 2008; Martínez-Delgado et al. 2010; Zhang et al. 2020; Vera-Casanova et al. 2022; Pascale et al. 2024).
None of these features is detected in existing SDSS images. They lack sufficient depth and only reveal the star-forming central regions, while available HST images of the six dwarfs cover relatively small areas around the galaxy centers. HST images therefore lack the spatial coverage necessary to capture the tidal features we see in the distant outskirts.
Main properties of the analyzed galaxies.
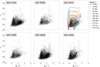 |
Fig. 2 r vs g - r CMDs from our new SSH data of the six galaxies analyzed here (see labels). As an example, we overplot the PARSEC isochrones of different ages (as labeled) on UGC 6541, shifted to a distance of 3.89 Mpc and corrected for a foreground extinction AV = 0.052; the isochrone metallicity of Z = 0.001 is consistent with the H II region oxygen abundance of 12 + log(O/H) = 7.82 (Berg et al. 2012). |
2.1 Color-magnitude diagrams
The galaxies lie relatively close, at distances of ∼3.2–4.5 Mpc. Individual stars are therefore resolved in our LBT images down to the brightest portion of the red giant branch (RGB; see the CMDs in Fig. 2). Photometric catalogs were obtained by performing point spread function (PSF) fitting photometry with PSFEX (Bertin 2013) on the stacked SSH g and r images, as described in detail in Annibali et al. (2020). The final catalogs contain calibrated astrometry and g,r photometry1, plus several structural and quality parameters for all the detected sources. We applied various selection cuts to remove spurious detections and contaminants, using the available output parameters provided by PSFex. In particular, we only retained sources with the following parameters:
flag = 0 in both bands, that is, best-measured individual sources;
g – gap, r – rap (i.e., PSF-fitting minus aperture magnitudes) within 2σ of the locus of the point sources (see Figure 3 for the example of UGC 8638; for some of the galaxies with fewer statistics, we used 3σ instead);
half-light radius (rh in both g and r) within 3σ of the mean value for point sources.
The last two selection criteria were aimed at removing background galaxies from our catalogs because they are the main source of contamination in the magnitude range we considered (see Bellazzini et al. 2011 and references therein). These final cleaned catalogs were then used for our selection of stellar counts in the six dwarfs, as described in the following.
In Fig. 2 we show the CMDs derived for portions of the LBT images enclosing the main body of the six galaxies, together with PARSEC isochrones (Bressan et al. 2012) from 10 Myr to 10 Gyr, overlapped as an example on top of UGC 6541, and properly shifted according to the galaxy distance and foreground extinction (see Table 1); the isochrone metallicity of Z = 0.001 is consistent with the H II region oxygen abundance of 12 + log(O/H) = 7.82 (Berg et al. 2012). All the CMDs are quite similar because all galaxies have a similar distance and are of a similar morphological type. The younger isochrones are bluer than the bulk of the observed stars because the contribution of young stars to the blue side of the CMDs is marginal at most. This is due to the circumstance that at distances of ∼3.3–4.3 Mpc, the innermost galactic regions are unresolved in our LBT images because of stellar crowding. The younger population, which is prominent but largely confined to the most crowded regions, is therefore poorly represented in our catalogs. The handful of stars that is brighter than r ≃ 23.0 or redder than g – r ≃ 1.5 are mostly foreground stars of our own Galaxy or red compact background galaxies. Instead, the wedgeshaped distribution of sources with g – r ≲ 0.8, centered at g – r ≲ 0.5, is dominated by completely unresolved background galaxies belonging to the blue sequence (see Bellazzini et al. 2011 for a discussion and references, in particular, their Fig. 5). On the other hand, stars fainter than r ≃ 24.0 and redder than g – r ≃ 0.8 are mostly genuine RGB stars of the SSH galaxies, with some asymptotic giant branch (AGB) stars beyond the evident discontinuity in the luminosity function that marks the RGB tip (between r ≃ 24.0 and r ≃ 25.0, depending on the specific galaxy). The isochrones are redder than the actual RGB stars because the old population is likely more metal poor than the HII regions in which the metallicity was derived.
The top panel of Fig. 4 shows the polygonal region we adopted to select RGB stars (in NGC 5238, but similar regions were defined for the other galaxies), which were used to trace the spatial distribution of the population older than ∼1–2 Gyr in the main body and outskirts of the galaxies. To verify that stars selected in this way are indeed bona fide RGBs, we crossmatched our SSH catalogs with HST photometry that is publicly available for all these galaxies. An example of the outcome of these experiments is displayed in Fig. 4, where the CMDs of the stars in common between our catalog of NGC 5238 and that based on HST data from the LEGUS survey (Calzetti et al. 2015) are compared2. In the LEGUS CMD, the stars that we selected as RGBs based on the SSH CMD are plotted in red and are fully confirmed as genuine RGB stars. All the available HST observations sample the central regions of these galaxies, and therefore, the overlap with the SSH sample typically occurs in the innermost corona that is resolved in the SSH images. The photometric errors for the displayed CMDs are therefore the largest, while both the photometric accuracy and the completeness are expected to improve in the outermost galaxy regions, where merger signatures are detected.
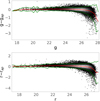 |
Fig. 3 One of the selection parameters we used on the photometric catalog of UGC 8638, showing the PSF-fitting minus aperture magnitudes vs PSF magnitudes in g (top panel) and r (bottom panel). The red line shows the median of the distribution, and the green lines show the ±2σ levels that were used to select the sources. |
2.2 RGB star maps and comparison with HI
In the middle columns of Figures 5–10, we present the background-subtracted RGB density maps derived for the six dwarfs through the approach discussed in Section 2.1. We estimated the background in an external portion of the total LBT field far from the main galaxy, computing the density of sources falling within our RGB selection polygon. To do this, we selected a region with the same area as the one centered on the galaxy, but located at least 10 arcmin far away from it. We then selected candidate RGB stars in the CMDs of both fields and computed the average surface density of the galaxy (µgal), that of the background (µbkg), and its sigma (σbkg). The RGB map was then created in units of (µgal – µbkg)/σbkg.
Moreover, pixels below three times the standard deviation of the background (σbkg) were set to zero in order to mask density noise due to background contaminants. The hole in the central regions of each density map is an artifact that is due to the extreme crowding from star-forming regions, as already mentioned above. The displayed surface density is in units of σbkg.
In the same figures, the RGB maps are compared with portions of our LBT images on the same scale (left columns), as well as with HI emission contours (middle columns) and HI velocity fields (right columns) obtained with the Karl G. Jansky Very Large Array (VLA) and with the Giant Metrewave Radio Telescope (GMRT) in the context of different programs or public surveys: the Local Irregulars That Trace Luminosity Extremes in The H I Nearby Galaxy Survey (LITTLE THINGS; Hunter et al. 2012) for UGC 6456 and UGC 6541; the VLA Survey of ACS Nearby Galaxy Survey Treasury Galaxies (VLA-ANGST; Ott et al. 2012) for UGC 8760; and the Faint Irregular Galaxies GMRT Survey (FIGGS; Begum et al. 2008) for UGC 7605. The VLA data of UGC 8638 are taken from Hunter (2023), while the VLA B configuration data of NGC 52383 are taken from program VLA/23A-195 (PI: Cannon) and will appear in a forthcoming publication (Cannon, Schisgal et al. in preparation).
Figures 5–10 show that most of the external tidal features identified in the LBT images correspond to overdensities in the RGB maps. This is very clear for UGC 6541, UGC 7605, UGC 8638, and UGC 8760 (Figures 7–10), but less evident in NGC 5238 (Fig. 5) and UGC 6456 (Fig. 6), whose maps are more noisy and with less striking overdensities. However, the substructures appear to be more extended in the RGB maps than in the g (or r) images, which is a consequence of the fainter surface brightness that is probed by individual star counts compared to a mere inspection of the images. On the other hand, none of the extended stellar features in the six dwarfs appears to have a counterpart in HI (the only possible exception being the southern plume in NGC 6456), although deeper HI observations could potentially reveal low-density gas emission at these locations.
The RGB map in NGC 5238 (Fig. 5) traces an extended distribution of old stars out to a galactocentric distance of ∼4 kpc. The most prominent overdensity in the maps (more than ten times the background standard deviation) corresponds to the northern shell that is visible in the LBT image. As already discussed in Cannon et al. (2016), the HI disk of NGC 5238 is asymmetric in the outer regions, and the morphological major axis is elongated from northeast to southwest. The high column density HI gas displays a crescent-shaped morphology. The galaxy also shows complex kinematics, with significant velocity asymmetries throughout the disk and an S-shaped velocity profile. The HI emission is very compact compared to the extended distribution of RGB stars, and there is no clear evidence for extended HI gas in the outer regions (also confirmed by new D- configuration data currently under analysis by Cannon, Schisgal et al., in prep.). We further note that within the northern shell, at least three round extended sources appear to be good candidate star clusters (see the upper blue polygon in Fig. 5) that may be associated with the tidal feature. This intriguing hypothesis requires a more detailed analysis that we defer to a future contribution.
In UGC 6456 (Fig. 6), the extended southern and northern stellar plumes identified in the LBT images correspond to peaks in the RGB counts, although here, the maps are quite noisy, also due to a significant incompleteness and contamination from foreground stars. The HI contours and velocity field clearly show a highly distorted gas, in particular, on the southern side, where the RGB density map exhibits a corresponding plume of stars. On the other hand, the northern stellar feature appears to be devoid of HI gas. Because of its peculiar HI properties, UGC 6456 was already suggested to have undergone a possible interaction event, although no obvious HI or stellar companion was ever detected (Ashley et al. 2017).
For UGC 6541 (Fig. 7), the least massive galaxy presented here, RGB stars trace the two tidal features oriented along its major axis very effectively. They appear to be significantly more extended in the RGB maps than in the LBT images, the one to the southeast reaching out to ∼3.5 kpc from the galaxy center. The HI gas extends toward the less prominent stellar plume to the northwest of the galaxy, and it is absent in the denser one to the southeast. The HI velocity field suggests complex large-scale dynamics. The modest velocity gradient (~10 km/s) within the inner disk is cospatial with the high surface brightness stellar component, although the central isovelocity contour (~250 km/s) is curved and not aligned with either the optical major or the optical minor axes. The projected velocity gradient turns over (to higher velocities) in both the northern and the southern portions of the disk. Furthermore, a gas component at lower velocity (~230 km/s) is present on the northwest side of the disk (cospatial with but larger than the low surface brightness stellar extension in the same direction). Taken together, the complex HI kinematics suggest that UGC 6451 is involved in an ongoing merger event in which the neutral gas has not yet settled, as previously suggested by Ashley et al. (2017).
In Figure 8, the RGB map of UGC 7605 highlights a concentration of stars that correspond to the southern fan-like feature detected in the LBT image. This is the most prominent over-density identified in the RGB map of UGC 7605, reaching more than 30 times the background standard deviation. The HI contours derived from low-resolution data cubes (43″ × 38″ beam) of the FIGGS data indicate an absence of gas at the location of the southern feature here as well. The velocity field to the right, displayed for a higher-resolution configuration (16″ × 12″ beam) of the FIGGS data, appears to be very complex and is highly distorted.
In UGC 8638 (Figure 9), the two stellar plumes that extend to the northeast and southwest of its main central body are very clearly visible both in the ɡ-band image and in the RGB map. Here, the western feature corresponds to an overdensity exceeding 20 times the background standard deviation. Both features appear to be more extended in the RGB map than in the images, reaching out to ~4 kpc from the galaxy center. The HI emission map and velocity field come from VLA data presented in Hunter (2023). The gas is confined to the galaxy main body, and the velocity field exhibits significant distortion.
We finally present the RGB map of UGC 8760 in Figure 10. This dwarf irregular, the closest in our sample, exhibits a prominent RGB overdensity northeast of its central body, corresponding to the faint clump of stars that is visible in the LBT image. The RGB map clearly shows that this clump of stars is not detached from the galaxy, but rather represents the densest part of an elongated, continuous distribution that departs from the galaxy itself. Another smaller overdensity is visible to the south, where an even fainter arc of stars appears at the edge of the HI emission. The velocity field is quite regular, except for a distortion on the northern side that is probably due to the interaction with the smaller satellite that caused the northern overdensity, in the area included in the blue polygon plotted in the left panel (RA ≃ 207.74, Dec ≃ 38.05). The satellite is not yet completely merged, but a clear bridge of stars connects it to the main body of the galaxy, corresponding to the highest peak in the RGB map.
We note that although the tidal features around the six dwarfs are clearly detected and are in some cases even more clearly visible directly in the LBT images, our RGB map analysis demonstrates thatthey consistofold stars (see also Appendix A): This proves that (i) they are statistically significant in terms of overdensities in star counts with respect to the background, and (ii) they are not vagaries of recent star formation episodes, but genuine results of the perturbation of the gravitational potential.
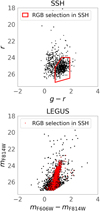 |
Fig. 4 CMD of NGC 5238 after the match of the SSH and LEGUS catalogs. Top panel: r vs. g - r CMD (from SSH data); the red box shows the selection we used to isolate RGB stars. Bottom panel: mF814W vs. mF606W – mF814W CMD of the same matched stars as in the top panel, but measured with HS T by LEGUS; the red points are the stars falling into our RGB selection box. |
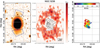 |
Fig. 5 Left panel: central part of the ɡ-band LBT image of NGC 5238, covering a field of view of ~ 4.9′ × 7.5′, or ~ 6.0 × 9.2 kpc2 (using the distance in Table 1). The peculiar structures with low surface brightness are highlighted by the blue polygons. Middle panel: map of RGB stars in the same area, background-subtracted and with pixels below 3σ of the background set to zero. The HI iso-density contours are superimposed in black and correspond to a column density of [2.5, 5, 10, ad 20] ×1020 atoms/cm2. The horizontal black bar is 1 kpc long, adopting the distances in Table 1. Right panel: HI velocity field. The beam size is also shown in the bottom right corner. North is up, and east is to the left. The HI data are from the VLA program 23A-195 (Cannon, Schisgal et al., in prep.). All three panels are exactly on the same scale. |
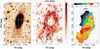 |
Fig. 6 Same as Figure 5 for UGC 6456. The field of view here is ~4.5′ × 7.1′, or ~5.6 × 8.9 kpc2, and the HI contours correspond to [0.1, 0.5, 1, 5.2, 10, and20] ×1020 atoms/cm2. TheHI data are taken from the VLA program LITTLE THINGS (Hunter et al. 2012). |
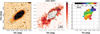 |
Fig. 7 Same as Figures 5 and 6 for UGC 6541. The field of view here is ~ 4.9′ × 4.9′, or ~ 5.5 × 5.5 kpc2, and the HI contours correspond to [0.1, 0.5, 1, 5, and 10] ×1020 atoms/cm2. The HI data are taken from the VLA program LITTLE THINGS (Hunter et al. 2012). |
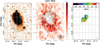 |
Fig. 8 Same as Figures 5–7 for UGC 7605. The field of view here is ~4.1′ × 5.8′, or ~5.3 × 7.4 kpc2, and the HI contours correspond to [0.1, 0.5, 1, 2, 3, and 4] ×1020 atoms/cm2. The gas emission in the central and right panels has a different resolution, with a 43″ × 38″ beam for the HI contours and a higher-resolution 16″ × 12″ beam for the velocity field. The HI data are taken from the GMRT program FIGGS (Begum et al. 2008). |
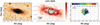 |
Fig. 9 Same as Figures 5–8 for UGC 8638. The field of view here is ~8.3′ × 4.9′, or ~10.3 × 6.1 kpc2, and the HI contours correspond to [0.1, 0.2, 1, 2, 5, 10, and20] ×1020 atoms/cm2. The HI data are taken from the VLA (Hunter 2023). |
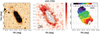 |
Fig. 10 Same as Figures 5–9 for UGC 8760. The field of view here is ~5.3′ × 5.3′, or ~4.9 × 5.0 kpc2, and the HI contours correspond to [1, 5, 10, and 15] ×1020 atoms/cm2. The HI data are taken from the VLA program ANGST (Ott et al. 2012). |
3 Discussion
The LBT images of the six dwarfs analyzed in this paper unequivocally reveal asymmetric low surface density structures emanating from the main body of the galaxies, with characteristic scales of ~2–3 kpc or more, and shapes consistent with those predicted by simulations for relics of merger events (Bullock & Johnston 2005; Johnston et al. 2008; Martínez-Delgado et al. 2010; Zhang et al. 2020; Vera-Casanova et al. 2022, see also Pascale et al. 2024 for detailed hydrodynamical N-body simulations of UGC 8760 and NGC 5238). These substructures are largely dominated by RGB stars, whose old ages (≳2 Gyr) guarantee that they are not due to recent off-center star formation episodes, but instead are due to genuine perturbations of the gravitational potential. The analysis of the RGB spatial distribution indeed reveals that these substructures are even more extended than what is directly visible in the LBT images.
For all our six galaxies, not only the RGB star distribution, but also the gas morphology and kinematics hold the signature of merging or interaction events. The HI intensity maps typically show an asymmetric and distorted morphology, and the HI velocity fields are highly disturbed. For NGC 5238, UGC 6456, and UGC 6541, these peculiarHIproperties were already pointed out and discussed by previous studies (Cannon et al. 2016; Ashley et al. 2017), which proposed a merger event as a viable explanation, but could not find any distinct companion that could obviously be interacting with the dwarfs.
Since the gas has a relatively short-term memory of past mergers, the high level of perturbation observed in HI provides a stringent constraint on how recently the merger or interaction event may have occurred. On a first approximation, the interaction likely occurred no longer than ~1 Gyr ago because on longer timescales, orbital mixing and energy dissipation tend to erase high signal distortions in the HI velocity field. Hydro-dynamical N-body simulations for UGC 8760 and NGC 5238 (Pascale et al. 2024) showed that the low surface brightness substructures observed in these galaxies, as well as the gas properties, are well explained with recent (≲1 Gyr ago) interactions with smaller companions with a stellar mass a few 105 M⊙, ~50 times less massive than the corresponding hosts. All six dwarfs are located 1–2 Mpc away from large galaxies, and therefore, we can safely exclude that the observed stellar tidal features and HI peculiarities are due to the interaction with a nearby massive companion.
We expect the occurrence of a recent interaction event to have left its signature also on the star formation history (SFH) of the dwarfs. Hydrodynamical simulations predict that the merger of a gas-rich dwarf with a smaller companion will cause bursts of star formation at or just after, pericenter passages (Bekki 2008; Starkenburg et al. 2016a,b). For NGC 5238, Cignoni et al. (2019) derived a clear increase in the star formation activity around 20 Myr ago, while the SFH is more uncertain at earlier epochs. The SFH of UGC 6456, as inferred from optical CMDs by McQuinn et al. (2010), shows a very recent burst in the last 100 Myr and three lower peaks over the last 1 Gyr. UGC 6541 is an actively star-forming galaxy, with a prominent population of young Wolf-Rayet stars (Kehrig et al. 2013) and evidence from a resolved CMD analysis of vigorous star formation that occurred several hundred million years ago (Schulte-Ladbeck et al. 2000). The SFH of UGC 8760 derived by Weisz et al. (2011) exhibits a modest peak of star formation activity about 2 Gyr ago, although the errors are quite large. These SFHs provide a valuable ingredient to be combined with hydrodynamical N-body simulations in order to reconstruct a coherent picture for the merging history of dwarfs and its effect on their star formation activity.
It is very interesting to note that out of the 45 dwarfs in the full SSH sample, the 6 galaxies presented here show the clearest signs of recent interaction or merger events, that is, a fraction of about F=13%4. We can compare this rate to what is found in the literature. Kado-Fong et al. (2020) presented an empirical study of unresolved galaxies using imaging from the Hyper Suprime-Cam Subaru Strategic Program and spectra from the Galaxy and Mass Assembly and Sloan Digital Sky Surveys campaigns. They built a sample of 6875 isolated galaxies with log(M★/M⊙) < 9.6 and used an automatic detection method to search for tidal features. They identified 226 galaxies with detectable low surface brightness debris (101 of which showed unambiguous signs of a dwarf-dwarf merger after visual inspection), making the detection rate about F=3.3% (6.1% when considering only galaxies at z < 0.05). F strongly grows as a function of the star formation activity, that is, for galaxies with bluer colors and extremely high Hα equivalent widths, reaching about 15% in starbursts.
Most recently, Lazar et al. (2024) analyzed a sample of 257 local dwarf galaxies in low-density environments, finding that 14, 27, and 19% of early-type, late-type, and featureless dwarfs, respectively, exhibit evidence of interactions. The authors also showed that morphological parameters could be used to separate interacting from noninteracting dwarfs, in particular, when taking into account the level of asymmetry. This is also evident in the analysis by Paudel et al. (2018), who presented a catalog of 177 interacting dwarf galaxies with stellar masses <1010M⊙ and redshift <0.02. The authors clearly showed and classified low surface brightness features around these galaxies, including shells, stellar streams, loops, and antennae, likely resulting from an interaction between dwarfs (more than 75% of the galaxies reside in low-density environments).
On the theoretical side, Deason et al. (2014) used a suite of cosmological zoom-in simulations of Milky Way- and M31-like host halos to study major mergers (stellar mass ratio > = 0.1, i.e., a total mass ratio of about >0.3). They reported that the fraction of mergers is ~3% for M★ = 103–5 M⊙, ~5% for M★ = 105–6 M⊙, and 10% for M★ > 106 M⊙/More isolated galaxies with M★ = 107–9 M⊙ that are within z = 0.5 have F=8.9% (within z = 1 , F=18.4%). However, we note that these results apply to major mergers with mass ratios higher than 0.1, whereas the tidal features detected in the outskirts of our six dwarfs are likely due to minor mergers, as also supported by the simulations presented by Pascale et al. (2024) for UGC 8760 and NGC 5238, where the satellites are 50 times less massive than their hosts.
Another interesting work by Martin et al. (2021) analyzed 1000 dwarf galaxies from the NEWHORIZON cosmological simulation to investigate how mergers and flybys drive their mass assembly and structural evolution. In only a small proportion of the galaxies exhibiting disturbed morphologies were the disturbances driven by mergers. These features are instead primarily the result of interactions that do not end in a merger (e.g., flybys). In their sample, galaxies of all stellar masses spent a significant amount of time (between 10 and 30%) in a morphologically disturbed state, and the time that merger remnants take to relax increases toward low redshift. Although this study is focused on a redshift between 5 and 0.5, these results highlight the need for a local sample to detect and study disturbed galaxies.
More recently, Deason et al. (2022) modeled the merger history of dwarf galaxies with Mhalo ~ 1010 M⊙ (for both major and minor mergers). Given the consistent uncertainties on the stellar mass – halo mass ratio, our galaxies could fall in this regime. Their model B, characterized by a lower mass threshold for the ignition of star formation5 within a ACDM framework, predicts a fraction of dwarfs with disturbed morphologies due to interaction with satellites of ≃10%. This agrees with our findings.
We can conclude that three independent observational studies targeting very different samples and using different methods broadly agree that the fraction F of late-type isolated dwarfs showing detectable signs of interaction or merging with satellites is between ≃10 and ≃20%. This agrees well with the theoretical predictions within the ACDM framework by Deason et al. (2014, 2022), and Martin et al. (2021). In this context, SSH provides the most local estimate of F. The nearby target galaxies offer the opportunity of a detailed simultaneous study of the morphology and the kinematics of the stars and the gas components, as well as of the star formation history, as derived from the CMD of resolved stars. This in turn allows a detailed hydro-dynamical modeling of the merging events that led to the current status of the systems, giving unmatched insight into the assembly process of dwarf galaxies (Pascale et al. 2021, 2022). The detectability fraction discussed here depends on the depth of our observations. This means that new upcoming facilities such as the Roman telescope are very valuable for this type of analysis.
4 Conclusions
We presented the six most convincing cases of tidal features discovered in our SSH survey, which aims to study the process of hierarchical merging at the smallest galactic scales (SSH, Annibali et al. 2020). The six galaxies are isolated dIrrs or BCDs with stellar mass in the 107 M⊙ < M★ < 2 × 10⁸ M⊙ range.
The asymmetries and substructures we found in the distribution of old (RGB) stars extend beyond the main body of the target galaxies, out to a few kiloparsec from the galaxy centers, and are similar to the tidal features observed and classified by Martínez-Delgado et al. (2010) in giant spirals. When traced with RGB star counts, all of them are found to have high statistical significance, as overdensities above a background of unrelated fore- or background sources. These features show the effect of dynamical perturbations, and in these dwarfs that are distant from large (massive) companions, they indicate an interaction with former satellites, marking an important milestone toward a deeper understanding of hierarchical merging phenomena at the smallest galaxy scales.
From the identification of six galaxies with highly convincing merger or interaction features out of the entire sample of 45 dwarfs in SSH, we can set our merger detection fraction at about F=13%. This agrees well with recent independent studies and theoretical predictions (Deason et al. 2014, 2022; Kado-Fong et al. 2020; Martin et al. 2021; Lazar et al. 2024). However, a few less obvious other cases could be present in the remaining SSH sample, and their stellar and gaseous properties are currently under study. Our fraction therefore is a lower limit.
Data availability
The reduced images are available at the CDS via anonymous ftp to cdsarc.cds.unistra.fr (130.79.128.5) or via https://cdsarc.cds.unistra.fr/viz-bin/cat/J/A+A/691/A65
Acknowledgements
The National Radio Astronomy Observatory is a facility of the National Science Foundation operated under cooperative agreement by Associated Universities, Inc. (AUI). E.S. wishes to thank Valentina La Torre and Maria Elisabetta Dalla Mura, invaluable sources of support and advice throughout the past years and during the work that brought to this publication.
Appendix A Stellar populations in the substructures
As an additional check to our RGB selection, we compared the CMDs of all stars contained in each polygon highlighted in Figures 5 to 10 with those of similar control fields of the same area, but taken further away from the galaxies. Figure A.1 shows an example of these different CMDs in UGC 8638. The top row contains the spatial map of the central portion of our image and the CMDs of the stars (mainly RGBs) contained in the two northeastern and southwestern boxes (the gray background points are all the stars in this central field). The bottom row shows the whole field (with an empty rectangle corresponding to the central area where the galaxy is, shown in the top row); the background gray points are the same as before, as a reference, while the red points show the stars contained in the two control fields. The excess of RGB stars in the areas containing the tidal features is striking, while in the control fields we find mostly background blue sequence galaxies (Blanton & Mous-takas 2009) and probably a few residual MW disk stars, once more confirming that the over-densities shown in the RGB maps are statistically significant.
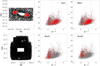 |
Fig. A.1 Top row. Spatial distribution of the central portion of our image for UGC 8638 and CMDs of the stars contained in the two highlighted regions (cyan boxes); the gray background points are all the stars in this central field. Bottom row. Map of the whole field (with an empty rectangle corresponding to the central area in the top panel, where the galaxy is); the background gray points are the same as before, as a reference, while the red points show the stars contained in the two control fields (cyan boxes). |
References
- Annibali, F., Nipoti, C., Ciotti, L., et al. 2016, ApJ, 826, L27 [NASA ADS] [CrossRef] [Google Scholar]
- Annibali, F., Beccari, G., Bellazzini, M., et al. 2020, MNRAS, 491, 5101 [NASA ADS] [Google Scholar]
- Ashley, T., Simpson, C. E., Elmegreen, B. G., Johnson, M., & Pokhrel, N. R. 2017, AJ, 153, 132 [NASA ADS] [CrossRef] [Google Scholar]
- Begum, A., Chengalur, J. N., Karachentsev, I. D., Sharina, M. E., & Kaisin, S. S. 2008, MNRAS, 386, 1667 [NASA ADS] [CrossRef] [Google Scholar]
- Bekki, K. 2008, MNRAS, 388, L10 [Google Scholar]
- Bellazzini, M., Beccari, G., Oosterloo, T. A., et al. 2011, A&A, 527, A58 [NASA ADS] [CrossRef] [EDP Sciences] [Google Scholar]
- Berg, D. A., Skillman, E. D., Marble, A. R., et al. 2012, ApJ, 754, 98 [NASA ADS] [CrossRef] [Google Scholar]
- Bertin, E. 2013, PSFEx: Point Spread Function Extractor, Astrophysics Source Code Library [record ascl:1301.001] [Google Scholar]
- Besla, G., Patton, D. R., Stierwalt, S., et al. 2018, MNRAS, 480, 3376 [NASA ADS] [CrossRef] [Google Scholar]
- Blanton, M. R., & Moustakas, J. 2009, ARA&A, 47, 159 [Google Scholar]
- Bressan, A., Marigo, P., Girardi, L., et al. 2012, MNRAS, 427, 127 [NASA ADS] [CrossRef] [Google Scholar]
- Bullock, J. S., & Boylan-Kolchin, M. 2017, ARA&A, 55, 343 [Google Scholar]
- Bullock, J. S., & Johnston, K. V. 2005, ApJ, 635, 931 [Google Scholar]
- Calzetti, D., Lee, J. C., Sabbi, E., et al. 2015, AJ, 149, 51 [Google Scholar]
- Cannon, J. M., McNichols, A. T., Teich, Y. G., et al. 2016, AJ, 152, 202 [NASA ADS] [CrossRef] [Google Scholar]
- Carlin, J. L., Sand, D. J., Price, P., et al. 2016, ApJ, 828, L5 [NASA ADS] [CrossRef] [Google Scholar]
- Cerny, W., Drlica-Wagner, A., Li, T. S., et al. 2023, ApJ, 953, L21 [NASA ADS] [CrossRef] [Google Scholar]
- Cignoni, M., Sacchi, E., Tosi, M., et al. 2019, ApJ, 887, 112 [NASA ADS] [CrossRef] [Google Scholar]
- Deason, A., Wetzel, A., & Garrison-Kimmel, S. 2014, ApJ, 794, 115 [Google Scholar]
- Deason, A. J., Bose, S., Fattahi, A., et al. 2022, MNRAS, 511, 4044 [NASA ADS] [CrossRef] [Google Scholar]
- Diemand, J., Kuhlen, M., Madau, P., et al. 2008, Nature, 454, 735 [NASA ADS] [CrossRef] [Google Scholar]
- Dooley, G. A., Peter, A. H. G., Carlin, J. L., et al. 2017, MNRAS, 472, 1060 [NASA ADS] [CrossRef] [Google Scholar]
- Drlica-Wagner, A., Bechtol, K., Rykoff, E. S., et al. 2015, ApJ, 813, 109 [Google Scholar]
- Fukugita, M., Ichikawa, T., Gunn, J. E., et al. 1996, AJ, 111, 1748 [Google Scholar]
- Hunter, L. C. 2023, PhD thesis, Indiana University, USA [Google Scholar]
- Hunter, D. A., Ficut-Vicas, D., Ashley, T., et al. 2012, AJ, 144, 134 [CrossRef] [Google Scholar]
- Jahn, E. D., Sales, L. V., Wetzel, A., et al. 2019, MNRAS, 489, 5348 [NASA ADS] [CrossRef] [Google Scholar]
- Johnston, K. V., Bullock, J. S., Sharma, S., et al. 2008, ApJ, 689, 936 [Google Scholar]
- Kado-Fong, E., Greene, J. E., Greco, J. P., et al. 2020, AJ, 159, 103 [NASA ADS] [CrossRef] [Google Scholar]
- Kehrig, C., Pérez-Montero, E., Vílchez, J. M., et al. 2013, MNRAS, 432, 2731 [NASA ADS] [CrossRef] [Google Scholar]
- Koposov, S. E., Walker, M. G., Belokurov, V., et al. 2018, MNRAS, 479, 5343 [NASA ADS] [CrossRef] [Google Scholar]
- Lazar, I., Kaviraj, S., Watkins, A. E., et al. 2024, MNRAS, 529, 499 [NASA ADS] [CrossRef] [Google Scholar]
- Lelli, F., Verheijen, M., & Fraternali, F. 2014, A&A, 566, A71 [NASA ADS] [CrossRef] [EDP Sciences] [Google Scholar]
- Martin, N. F., Nidever, D. L., Besla, G., et al. 2015, ApJ, 804, L5 [NASA ADS] [CrossRef] [Google Scholar]
- Martin, G., Jackson, R. A., Kaviraj, S., et al. 2021, MNRAS, 500, 4937 [Google Scholar]
- Martínez-Delgado, D., Gabany, R. J., Crawford, K., et al. 2010, AJ, 140, 962 [Google Scholar]
- Martínez-Delgado, D., Romanowsky, A. J., Gabany, R. J., et al. 2012, ApJ, 748, L24 [CrossRef] [Google Scholar]
- McQuinn, K. B. W., Skillman, E. D., Cannon, J. M., et al. 2010, ApJ, 724, 49 [NASA ADS] [CrossRef] [Google Scholar]
- Nidever, D. L., Olsen, K., Walker, A. R., et al. 2017, AJ, 154, 199 [Google Scholar]
- Ott, J., Stilp, A. M., Warren, S. R., et al. 2012, AJ, 144, 123 [NASA ADS] [CrossRef] [Google Scholar]
- Pascale, R., Bellazzini, M., Tosi, M., et al. 2021, MNRAS, 501, 2091 [CrossRef] [Google Scholar]
- Pascale, R., Annibali, F., Tosi, M., et al. 2022, MNRAS, 509, 2940 [Google Scholar]
- Pascale, R., Annibali, F., Tosi, M., et al. 2024, A&A, 688, A144 [NASA ADS] [CrossRef] [EDP Sciences] [Google Scholar]
- Paudel, S., Smith, R., Yoon, S. J., Calderón-Castillo, P., & Duc, P.-A. 2018, ApJS, 237, 36 [Google Scholar]
- Planck Collaboration XIII. 2016, A&A, 594, A13 [NASA ADS] [CrossRef] [EDP Sciences] [Google Scholar]
- Schulte-Ladbeck, R. E., Hopp, U., Greggio, L., & Crone, M. M. 2000, AJ, 120, 1713 [NASA ADS] [CrossRef] [Google Scholar]
- Starkenburg, T. K., Helmi, A., & Sales, L. V. 2016a, A&A, 587, A24 [NASA ADS] [CrossRef] [EDP Sciences] [Google Scholar]
- Starkenburg, T. K., Helmi, A., & Sales, L. V. 2016b, A&A, 595, A56 [NASA ADS] [CrossRef] [EDP Sciences] [Google Scholar]
- Stierwalt, S., Besla, G., Patton, D., et al. 2015, ApJ, 805, 2 [NASA ADS] [CrossRef] [Google Scholar]
- Torrealba, G., Belokurov, V., Koposov, S. E., et al. 2018, MNRAS, 475, 5085 [NASA ADS] [CrossRef] [Google Scholar]
- Vera-Casanova, A., Gómez, F. A., Monachesi, A., et al. 2022, MNRAS, 514, 4898 [NASA ADS] [CrossRef] [Google Scholar]
- Wang, J., Bose, S., Frenk, C. S., et al. 2020, Nature, 585, 39 [Google Scholar]
- Weisz, D. R., Dalcanton, J. J., Williams, B. F., et al. 2011, ApJ, 739, 5 [CrossRef] [Google Scholar]
- Wetzel, A. R., Hopkins, P. F., Kim, J.-h., et al. 2016, ApJ, 827, L23 [NASA ADS] [CrossRef] [Google Scholar]
- White, S. D. M., & Rees, M. J. 1978, MNRAS, 183, 341 [Google Scholar]
- Zhang, H.-X., Smith, R., Oh, S.-H., et al. 2020, ApJ, 900, 152 [NASA ADS] [CrossRef] [Google Scholar]
- Zheng, Y., Faerman, Y., Oppenheimer, B. D., et al. 2024, ApJ, 960, 55 [NASA ADS] [CrossRef] [Google Scholar]
In the photometric system of the Sloan Digital Sky Survey (Fukugita et al. 1996).
The full LEGUS CMD of the region (see, e.g., Cignoni et al. 2019) spans a much wider range of magnitudes that is both brighter and fainter than those measurable by LBT, as well as a prominent blue plume of young stars.
VLA configuration C data of NGC 5238 were presented in Cannon et al. (2016).
This should be considered as a preliminary lower limit as there are a couple of cases that requires additional investigation. In any case the fraction of galaxies in the SSH sample showing clear signs of past merging event should not exceed 20%.
M50 = 107.5 M⊙, with respect to M50 = 109.3 M⊙ adopted for the other set of models they explore (model A); see Deason et al. (2022) for definition and details.
All Tables
All Figures
|
Fig. 1 LBT images of the six galaxies in the SSH survey exhibiting clear tidal features in their external regions. The grayscale maps highlight the low surface brightness emission, and the g, r color-combined maps are used to emphasize the morphology of the central starburst regions. The horizontal black bar is 1 kpc long, adopting the distances listed in Table 1. (North is up, and east is to the left.) |
| In the text | |
|
Fig. 2 r vs g - r CMDs from our new SSH data of the six galaxies analyzed here (see labels). As an example, we overplot the PARSEC isochrones of different ages (as labeled) on UGC 6541, shifted to a distance of 3.89 Mpc and corrected for a foreground extinction AV = 0.052; the isochrone metallicity of Z = 0.001 is consistent with the H II region oxygen abundance of 12 + log(O/H) = 7.82 (Berg et al. 2012). |
| In the text | |
|
Fig. 3 One of the selection parameters we used on the photometric catalog of UGC 8638, showing the PSF-fitting minus aperture magnitudes vs PSF magnitudes in g (top panel) and r (bottom panel). The red line shows the median of the distribution, and the green lines show the ±2σ levels that were used to select the sources. |
| In the text | |
|
Fig. 4 CMD of NGC 5238 after the match of the SSH and LEGUS catalogs. Top panel: r vs. g - r CMD (from SSH data); the red box shows the selection we used to isolate RGB stars. Bottom panel: mF814W vs. mF606W – mF814W CMD of the same matched stars as in the top panel, but measured with HS T by LEGUS; the red points are the stars falling into our RGB selection box. |
| In the text | |
|
Fig. 5 Left panel: central part of the ɡ-band LBT image of NGC 5238, covering a field of view of ~ 4.9′ × 7.5′, or ~ 6.0 × 9.2 kpc2 (using the distance in Table 1). The peculiar structures with low surface brightness are highlighted by the blue polygons. Middle panel: map of RGB stars in the same area, background-subtracted and with pixels below 3σ of the background set to zero. The HI iso-density contours are superimposed in black and correspond to a column density of [2.5, 5, 10, ad 20] ×1020 atoms/cm2. The horizontal black bar is 1 kpc long, adopting the distances in Table 1. Right panel: HI velocity field. The beam size is also shown in the bottom right corner. North is up, and east is to the left. The HI data are from the VLA program 23A-195 (Cannon, Schisgal et al., in prep.). All three panels are exactly on the same scale. |
| In the text | |
|
Fig. 6 Same as Figure 5 for UGC 6456. The field of view here is ~4.5′ × 7.1′, or ~5.6 × 8.9 kpc2, and the HI contours correspond to [0.1, 0.5, 1, 5.2, 10, and20] ×1020 atoms/cm2. TheHI data are taken from the VLA program LITTLE THINGS (Hunter et al. 2012). |
| In the text | |
|
Fig. 7 Same as Figures 5 and 6 for UGC 6541. The field of view here is ~ 4.9′ × 4.9′, or ~ 5.5 × 5.5 kpc2, and the HI contours correspond to [0.1, 0.5, 1, 5, and 10] ×1020 atoms/cm2. The HI data are taken from the VLA program LITTLE THINGS (Hunter et al. 2012). |
| In the text | |
|
Fig. 8 Same as Figures 5–7 for UGC 7605. The field of view here is ~4.1′ × 5.8′, or ~5.3 × 7.4 kpc2, and the HI contours correspond to [0.1, 0.5, 1, 2, 3, and 4] ×1020 atoms/cm2. The gas emission in the central and right panels has a different resolution, with a 43″ × 38″ beam for the HI contours and a higher-resolution 16″ × 12″ beam for the velocity field. The HI data are taken from the GMRT program FIGGS (Begum et al. 2008). |
| In the text | |
|
Fig. 9 Same as Figures 5–8 for UGC 8638. The field of view here is ~8.3′ × 4.9′, or ~10.3 × 6.1 kpc2, and the HI contours correspond to [0.1, 0.2, 1, 2, 5, 10, and20] ×1020 atoms/cm2. The HI data are taken from the VLA (Hunter 2023). |
| In the text | |
|
Fig. 10 Same as Figures 5–9 for UGC 8760. The field of view here is ~5.3′ × 5.3′, or ~4.9 × 5.0 kpc2, and the HI contours correspond to [1, 5, 10, and 15] ×1020 atoms/cm2. The HI data are taken from the VLA program ANGST (Ott et al. 2012). |
| In the text | |
|
Fig. A.1 Top row. Spatial distribution of the central portion of our image for UGC 8638 and CMDs of the stars contained in the two highlighted regions (cyan boxes); the gray background points are all the stars in this central field. Bottom row. Map of the whole field (with an empty rectangle corresponding to the central area in the top panel, where the galaxy is); the background gray points are the same as before, as a reference, while the red points show the stars contained in the two control fields (cyan boxes). |
| In the text | |
Current usage metrics show cumulative count of Article Views (full-text article views including HTML views, PDF and ePub downloads, according to the available data) and Abstracts Views on Vision4Press platform.
Data correspond to usage on the plateform after 2015. The current usage metrics is available 48-96 hours after online publication and is updated daily on week days.
Initial download of the metrics may take a while.