Fig. A.1
Download original image
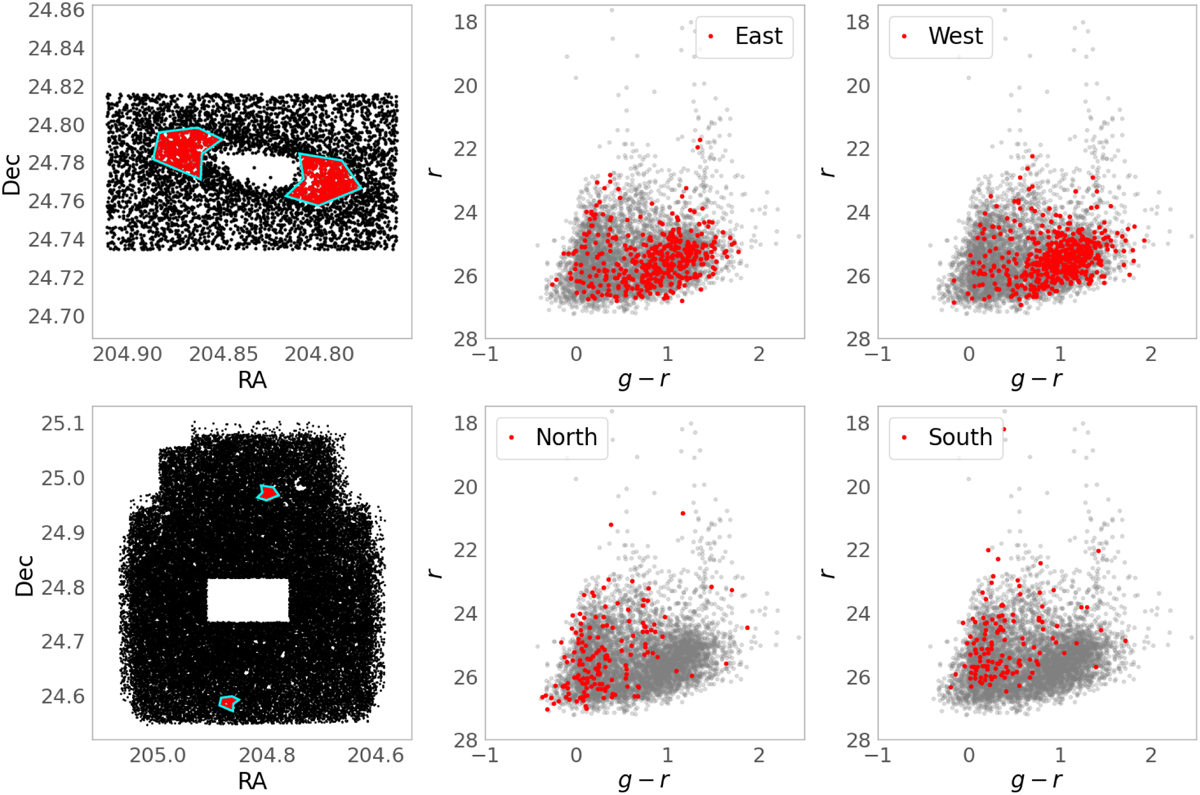
Top row. Spatial distribution of the central portion of our image for UGC 8638 and CMDs of the stars contained in the two highlighted regions (cyan boxes); the gray background points are all the stars in this central field. Bottom row. Map of the whole field (with an empty rectangle corresponding to the central area in the top panel, where the galaxy is); the background gray points are the same as before, as a reference, while the red points show the stars contained in the two control fields (cyan boxes).
Current usage metrics show cumulative count of Article Views (full-text article views including HTML views, PDF and ePub downloads, according to the available data) and Abstracts Views on Vision4Press platform.
Data correspond to usage on the plateform after 2015. The current usage metrics is available 48-96 hours after online publication and is updated daily on week days.
Initial download of the metrics may take a while.