| Issue |
A&A
Volume 690, October 2024
|
|
|---|---|---|
| Article Number | L12 | |
| Number of page(s) | 9 | |
| Section | Letters to the Editor | |
| DOI | https://doi.org/10.1051/0004-6361/202451810 | |
| Published online | 18 October 2024 | |
Letter to the Editor
Old massive clusters (and a nuclear star cluster?) in the tidal tails of NGC 5238
1
INAF - Osservatorio di Astrofisica e Scienza dello Spazio di Bologna, via Piero Gobetti 93/3, 40129 Bologna, Italy
2
INAF - Osservatorio Astronomico di Roma, Via Frascati 33, 00078 Monteporzio Catone, Rome, Italy
3
INAF - Osservatorio Astronomico di Capodimonte, Via Moiariello, 16, 80131 Napoli, Italy
4
Space Telescope Science Institute, 3700 San Martin Drive, Baltimore, MD 21218, USA
5
Leibniz-Institut für Astrophysik Potsdam (AIP), An der Sternwarte 16, 14482 Potsdam, Germany
6
ASI-Space Science Data Center, Via del Politecnico, I-00133 Rome, Italy
7
Department of Physics – University of Pisa, Largo B. Pontecorvo 3, 56127 Pisa, Italy
8
INFN, Largo B. Pontecorvo 3, 56127 Pisa, Italy
9
Macalester College, 1600 Grand Avenue, Saint Paul, MN 55105, USA
10
Department of Astronomy, The Oskar Klein Centre, Stockholm University, AlbaNova, 10691 Stockholm, Sweden
11
Astrophysics Division, Science Mission Directorate, NASA Headquarters, 300 E Street SW, Washington, DC 20546, USA
12
European Southern Observatory, Karl-Schwarzschild-Strasse 2, 85748 Garching bei München, Germany
13
Dipartimento di Fisica e Astronomia “Augusto Righi”, Università di Bologna, Via Gobetti 93/2, 40129 Bologna, Italy
Received:
6
August
2024
Accepted:
15
September
2024
Abstract
New, deep HST photometry allowed us to identify and study eight compact and bright (MV ≤ −5.8) star clusters in the outskirts of the star-forming isolated dwarf galaxy NGC 5238 (M* ≃ 108 M⊙). Five of these clusters are new discoveries, and six appear projected onto and/or aligned with the tidal tails recently discovered around this galaxy. The clusters are partially resolved into stars, and their colour magnitude diagrams reveal a well-developed red giant branch, implying ages older than 1–2 Gyr. Their integrated luminosity and structural parameters are typical of classical globular clusters, and one of them, with MV = −10.56 ± 0.07, is as bright as ω Cen, the brightest globular cluster in the Milky Way. Since the properties of this cluster are in the range spanned by those of nuclear star clusters we suggest that it may be the nuclear remnant of the disrupted satellite of NGC 5238 that produced the observed tidal tails.
Key words: galaxies: dwarf / galaxies: interactions / galaxies: individual: NGC 5238 / galaxies: star clusters: general
Corresponding author; This email address is being protected from spambots. You need JavaScript enabled to view it.
© The Authors 2024
 Open Access article, published by EDP Sciences, under the terms of the Creative Commons Attribution License (https://creativecommons.org/licenses/by/4.0), which permits unrestricted use, distribution, and reproduction in any medium, provided the original work is properly cited.
This article is published in open access under the Subscribe to Open model. This email address is being protected from spambots. You need JavaScript enabled to view it. to support open access publication.
1. Introduction
The current Λ cold dark matter paradigm predicts that galaxies form by means of a hierarchical merging process (Primack 2024) irrespective of the mass scale of the galaxies over a very wide range of mass (Diemand et al. 2005; Wang et al. 2020). Hence, the paradigm must be tested at all scales, including the smallest ones, that is, in the realm of dwarf galaxies. Here the test is especially challenging due to the intrinsic faint and low surface brightness (SB) nature of the dwarfs and of their possible satellites. However, systematic searches among local unresolved galaxies are beginning to provide interesting results (Paudel et al. 2018; Kado-Fong et al. 2020).
In this context, the Smallest Scale of the Hierarchy (SSH) survey (Annibali et al. 2020) is searching for signs of recent interactions or mergers with satellites in a sample of nearby (D ≲ 10 Mpc), isolated, and (at least partially) resolved dwarf galaxies, by tracing their stellar structure using star counts down to a very low SB level (μr ≲ 31 mag/arcsec2). While requiring that the galaxies can be resolved into stars strongly limits the accessible volume, it allows one to discriminate between young stars, which trace the (typically) strongly asymmetric distribution of star-forming regions, and old stars, specifically red giant branch (RGB) stars (age ≳ 1 − 2 Gyr), whose distribution should reliably trace the galaxy gravitational potential and the possible disturbances induced by interactions with satellites.
Recently, Sacchi et al. (2024) reported on the discovery of prominent asymmetric extended features in the distribution of RGB stars in the outskirts of six SSH dwarfs, all interpreted as relics of the interaction with and ingestion of a former satellite (e.g. similar to the case of DDO68; see Annibali et al. 2016, 2019). Among these six cases, the star-forming galaxy NGC 5238 (D ≃ 4.5 Mpc, M* ≃ 108 M⊙; see Cannon et al. 2016, and our Appendix A) was shown to display two wide asymmetric stellar features protruding from the northern and the southern edges of the regular ellipsoidal main body of the galaxy as traced by RGB stars (see Fig. 1, right panel). The northern feature ends with a kind of shell with a sharp edge in surface density that bends somewhat to the south-west. To follow up on this intriguing case of ingestion of a satellite by a dwarf, we obtained deep Hubble Space Telescope (HST) observations that cover the entire body of the galaxy as well as the tidal tails (programme GO-171401; P.I. F. Annibali). Inspecting the mosaic of Advanced Camera for Surveys - Wide Field Channel (ACS-WFC) images, we noted, in the outskirts of the galaxy, eight obvious bright, compact, and partially resolved star clusters, five of which were previously unknown. Their colour magnitude diagram (CMD) suggests an old age for all of them. The newly discovered clusters and the outermost of the already known clusters lie far beyond the main body of the galaxy and appear to correlate with the tidal tails. One lies exactly within the northern tail, at least in projection, and is as bright as the brightest globular cluster (GC) of the Milky Way (MW), showcasing properties typical of nuclear star clusters (NSCs; Neumayer et al. 2020, N20 hereafter). In this Letter we report on these newly discovered clusters and their relation with the tidal tails of NGC 5238.
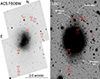 |
Fig. 1. Images of NGC 5238 from our HST (left image) and LBT (right image) data, with the star clusters considered in this Letter circled and labelled. The different intensity cuts in the two images are intended to highlight the irregular structure of the inner star-forming region (ACS image) and the regular ellipsoid of the main body as well as the shape of the tidal features protruding from its northern and southern edges (LBC image). |
2. Analysis
The star cluster population in the main body of NGC 5238 has been systematically studied by the Legacy ExtraGalactic UV Survey (LEGUS) HST Treasury Program (PI D. Calzetti) with an automatic pipeline (Adamo et al. 2017). Ages were estimated by fitting spectral energy distribution (SED) models to the set of available HST magnitudes, which vary from cluster to cluster. The vast majority of the LEGUS candidate clusters unfortunately were classified as low-quality candidates, and only nine were confirmed by visual inspection as likely genuine clusters (Adamo et al. 2017; Cook et al. 2019, 2023). All nine have estimated ages ≤2 × 10⁸ yr according to the LEGUS catalogue2 and, above all, are deeply embedded into the main body of the galaxy. We will re-examine these inner clusters in the light of our new data in a future study, where we will investigate the star formation and the morphology of the galaxy in detail.
The final mosaics of drizzled ACS-WFC images of NGC 5238 we inspected had a total exposure time of 13 824 s in F606W and 22698.5 s in F814W. The F606W image is reproduced in the left panel of Fig. 1, flanked, on the right panel, by the SSH r-band image from Sacchi et al. (2024) obtained with the Large Binocular Camera (LBC; Giallongo et al. 2008) mounted on the Large Binocular Telescope (LBT3); the two images have the same scale. The LBC image highlights the regular shape of the ellipsoidal main body of the galaxy and the two tails protruding from its northern and southern edges, while the intensity cuts of the ACS image have been set to reveal the complex morphology of the innermost star-forming regions. In both images we mark the bright and compact star clusters that we clearly identified in our ACS image as partially resolved into stars. Three of them, C4, C6, and C7, were already included in the LEGUS catalogue of candidate star clusters in NGC 52384, while the other five are new discoveries as they all lie beyond the footprint of the LEGUS images of this galaxy. Zoomed-in stamp images of the clusters can be found in Appendix C.
We used the Aperture Photometry Tool (APT; Laher et al. 2012a,b) to estimate the cluster centres and to obtain surface aperture photometry on circular apertures for all eight clusters. Throughout the paper we always report F606W and F814W magnitudes in the VEGAMAG system (Sirianni et al. 2005; Bedin et al. 2005). The integrated magnitude in F606W and F814W was obtained using apertures large enough to also include the contribution of the resolved stars in the cluster outskirts (see Table 1). The background flux to be subtracted was estimated in large concentric annuli to include the contribution of resolved stars in the field of NGC 5238 as well as the contribution of background sources (the field is rich in distant galaxies). The coordinates of the clusters and their integrated magnitudes obtained in this way are reported in Table 1. The magnitudes of C4 and C6 are in good agreement with those measured by the LEGUS pipeline (based on Sextractor; Bertin & Arnouts 1996, see Appendix D), while for C7 they provide values fainter than ours by about two magnitudes, in both passbands, and are thus clearly not compatible with the observed cluster. When reducing our ACS images with Sextractor, we noted that this relatively sparse and resolved cluster was split by the code into (at least) two fainter sources. This behaviour is likely at the origin of the underestimate of the integrated flux of C7 by LEGUS.
Compact clusters in the outskirts of NGC 5238.
The clusters’ SB profiles were obtained using aperture photometry on circular annuli with APT. We determined the structural parameters of the clusters in two ways on the F606W profiles. First, we fitted the observed SB profiles with King (1966, K66 hereafter) single-mass models convoluted with a simple model of the ACS point spread function (PSF), as done in Federici et al. (2007) and Barmby et al. (2007). The central SB was fixed at the value of the innermost point of the observed profile, and then we searched for the values of the core radius (rc) and concentration parameter (C = log(rt/rc), where rt is the tidal radius; see K66) that minimise χ2. Second, we fitted straight Elson et al. (1987, EFF87) models to the observed profiles with the curve fit Python library, as done in Gatto et al. (2021). The observed profiles of the clusters, their best fitting curves, and the resulting structural parameters are presented and briefly discussed in Appendix D. The two sets of models perform very similarly in the innermost regions of the clusters, while EFF87 appears to be much better at reproducing the extended outer regions of the clusters. In particular, the external parts of the profiles of C1, C3, and C8 do not seem compatible with tidal truncation, as is typical of clusters in dwarf galaxies (EFF87, Gatto et al. 2021, and references therein). It is reassuring to note that by integrating the EFF87 profiles we obtain integrated magnitudes that are in excellent agreement with those reported in Table 1. On the other hand, core and half-light radii from the fit of the K66 model must be considered as our best estimates of the true cluster size since in this case the effect of the PSF is taken into account.
Stellar PSF photometry was obtained using the latest version of DOLPHOT (Dolphin 2000, 2016), following the approach described in Annibali et al. (2019) and the setup from Williams et al. (2014). Additional details and the adopted selections are described in Appendix B. In the left panel of Fig. 2 we show the CMD of the entire ACS sample, which is dominated by a prominent RGB, tipping around F814W0 ≃ 24.1 and (F606W-F814W)0 ≃ 1.0. A significant population of asymptotic giant branch (AGB) stars, tracing intermediate-age populations, is clearly visible above the RGB tip. At colours bluer than the RGB, the sequences of red and blue young core He-burning (He-b) stars can be easily identified; the young main sequence is also evident and marks the blue edge of the CMD for F814W0 ≲ 27.0. Thanks to the quality of our data, it is easy to select RGB stars on this CMD to obtain a map of the oldest populations that can be identified in our data, which is shown in the right panel of Fig. 2. Both the southern and the northern tidal tails are clearly evident on the map, as is the sharp, SW-bending edge of the latter (compare this with Fig. 1, right panel). It is extremely interesting and somehow striking, given the distance of the galaxy, that six of the eight clusters listed in Table 1 are readily visible on the map as small-scale overdensities of RGB stars: the five newly discovered clusters (C1, C2, C3, C5, and C8) and the outermost cluster already found by LEGUS (C7). The CMD of the small circular fields around these clusters is shown in Fig. C.2 and compared with the CMD of control fields (CFs). The comparisons fully support the idea that the clusters are old and metal-poor (albeit in some of them, the presence of intermediate-age AGB stars cannot be excluded; see Appendix C). It is intriguing to note that C1, C2, and C3 are projected onto the northern tail, somewhat following the bending of its sharp edge. The position of C5 is not incompatible with the possible southward prolongation of the northern tail5. C7 and C8 lie just beyond the south-east edge of the southern tail. In the following we focus our attention on these six clusters as they are those most likely associated with the tidal tails6. In the following we adopt D = 4.17 ± 0.10 Mpc and E(B-V) = 0.01 (see Appendix E).
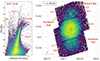 |
Fig. 2. A view of NGC 5238 from our HST ACS-WFC photometry. Left panel: CMD of the entire sample. The main evolutionary phases are labelled, and the RGB selection box is plotted in red. Right panel: Map of the RGB stars in our field (RA and Dec in degrees). Each star is colour-coded according to the local density. The main tidal features and all the star clusters possibly associated with them are labelled; they appear as local overdensities on the map. Please note how prominent the overdensity associated with C1 is. The two diagonal under-dense stripes correspond to the gaps between the ACS-WFC CCDs in the two WFC images used to build our mosaic image. In these stripes, the effective exposure time is lower than elsewhere. |
It is worth noting that the entire field of view spanned by our ACS images, with a maximum projected distance from the galaxy centre of ≃6.3 kpc, is dominated by stars of NGC 5238. This means that the tidal tails are immersed into a vaster, low-SB halo whose end we do not detect and where additional star clusters may lie.
3. Discussion and conclusion
To derive absolute integrated magnitudes in the V band, we transformed the ACS magnitudes into V using Eq. (1) of Galleti et al. (2006). The clusters in Table 1 have −5.8 ≤ MV ≤ −10.5 and half-light radii 3.4 pc ≤ Rh ≤ 14.5 pc, within the range spanned by classical GCs (see Fig. 3). Adopting the mean mass-to-light ratio of Galactic GCs (M/LV = 1.8; Baumgardt et al. 2020), the estimated masses lie in the range 4.5 ≤ log(M/M⊙) ≤ 6.4. We verified that they follow all the GC scaling relations that we were able to check (e.g. C vs rc, C vs MV, etc; Djorgovski et al. 2003). Their mean colours as well as their CMD are typical of old and mildly metal-poor GCs. The fact that six of these bright GCs lie in the extreme outskirts of the galaxy and are correlated (in projection) with the prominent tidal tails discovered by Sacchi et al. (2024) suggests that they were associated with the destroyed satellite that produced the tails. We have clear examples of GCs lying within tidal tails and therefore being accreted into a larger galaxy along tidal tails around the MW (e.g. Bellazzini et al. 2020, and references therein) and M31 (Mackey et al. 2019); however, to the best of our knowledge, this is the first case in which this is observed to occur in a dwarf galaxy (though accretion of clusters in a dwarf has been suggested by Hwang et al. 2014, for NGC 6822).
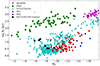 |
Fig. 3. NGC 5238 clusters listed in Table 1 compared with the sample of pressure-supported stellar systems from Norris et al. (2014) in the plane opposing the logarithm of Rh and the absolute integrated V magnitude. The Norris et al. (2014) catalogue does not discriminate between GCs, UCDs, and compact ellipticals (cEs), but the distribution of the GC–UCD–cE class is dominated by UCDs and cEs for MV ≤ −10.0 and by GCs for MV > −10.0. |
The case of C1 is especially intriguing in this sense. C1, located right in the middle of the northern tail, has an absolute integrated V magnitude MV = −10.56 ± 0.07. This magnitude is very similar to that of ω Cen (MV = −10.51 ± 0.05; Baumgardt et al. 2020; Baumgardt & Vasiliev 2021)7, the brightest GC of the MW, a galaxy with a GC system of more than 150 members and whose stellar mass is ≃500 times larger than that of NGC 5238 (Bland-Hawthorn & Gerhard 2016). ω Cen is generally believed to be the nuclear remnant of a former, and now disrupted, satellite of the MW (Ibata et al. 2019), in analogy with the case of another very bright GC, M 54 (MV = −9.99 ± 0.07), which is part of the stellar nucleus of the disrupting Sgr dSph galaxy (Bellazzini et al. 2008; Carretta et al. 2010; Alfaro-Cuello et al. 2019, 2020). Figure 3 shows that C1 lies in the region of the MV – log(Rh) plane that is dominated by faint NSCs and ultra-compact dwarf galaxies (UCDs; at least some of which may be the compact central remnant of tidally stripped galaxies; Misgeld & Hilker 2011; Mieske et al. 2013, N20). In particular, its luminosity and size are typical of stellar nuclei in dwarf galaxies (M⋆ < 109 M⊙; see Table 2 of N20). Also, the low ellipticity, ϵ = 0.07 ± 0.018, is typical of low-mass NSCs. It is tantalising to hypothesise that C1 was in fact the nuclear remnant of the dwarf satellite that was disrupted in the interaction with NGC 5238, producing the tidal tails. This appears to be the most likely explanation for the presence of such a massive star cluster so far away from the centre of a dwarf galaxy (≃2.5 kpc in projection, which is more than five times the half light radius of the galaxy9). In this context it is also worth recalling another case of a possible nuclear remnant found in the outskirts of a dwarf galaxy, CL77 in NGC 4449, reported by Annibali et al. (2012), as well as the examples of UCDs caught in the process of formation via tidal shredding around spiral galaxies reported by Jennings et al. (2015) and Paudel et al. (2023). The case of NGC3628-UCD1 is particularly interesting as the system is embedded in a tidal tail and is remarkably similar to C1 in terms of size and luminosity. NGC 5238 hosts another star cluster of comparable brightness as C1 close to its optical centre, LEGUS 242, with MV = −10.7 ± 0.3 (from LEGUS photometry). However, this cluster has a much bluer colour than C1, (F606W − F814W)0 = 0.43 ± 0.12 versus (F606W − F814W)0 = 0.73 ± 0.03, and appears to be associated with very strong nebular emission (Cannon et al. 2016). LEGUS reports a very young age for this cluster (106 − 107 yr, depending on the version of the catalogue) and, consequently, a relatively low mass, M ≲ 5 × 10⁴ M⊙.
At this stage, only speculations based on uncertain assumptions can be made as to the nature of the hypothesised progenitor of C1. According to the relation between the stellar masses of NSCs and the host galaxies (Eq. (1) of N20), if C1 is a stripped NSC, the most likely mass of its parent galaxy is M⋆ ≃ 108.7 M⊙. However, given the large scatter of the relation, progenitor masses down to M⋆ ≃ 107.0 − 108.0 M⊙ are also possible (see also Lambert et al. 2024), which would imply a (stellar) mass ratio in the range ∼0.1 − 1 for the merging event, assuming, for simplicity, that the two interacting galaxies have the same M/L ratio. Assuming that the six clusters in the tidal tails belonged to the disrupted satellite, its GC-specific frequency (SN; see Brodie & Strader 2006) would fall within the range observed in nucleated dwarfs with MV ≳ −14.5 for stellar mass ratios ≳0.2 (Miller & Lotz 2007). A lower mass ratio for the merger is possible, for example if C1 is itself a low-mass UCD (Saifollahi et al. 2021), in which case it would be difficult to explain the presence of the other clusters in the tails.
The tentative model of NGC5238 and its tails from Pascale et al. (2024) was only constrained by the apparent surface density distribution and by the H I kinematics. The discovery of these bright clusters in the tidal tails opens the path for obtaining new and more powerful constraints, for example by using the clusters to probe the stellar velocity field in the tails, thus opening a window onto the rare and fascinating case of mergers of nearby dwarf galaxies.
The images of NGC 5238 from this programme have been used for a beautiful ESA image of the week; https://esahubble.org/images/potw2429a/
We used the reference LEGUS catalogue, which is the one that uses MW extinction, the averaged aperture correction method, and Padova stellar evolutionary tracks (see https://archive.stsci.edu/prepds/legus/cluster_catalogs/ngc5238.html).
C6 = LEGUS 591 is one of the nine confirmed LEGUS candidates; the other two clusters in common with our sample did not pass the cut for further visual inspection in the LEGUS pipeline.
Some of the LEGUS candidate clusters look intriguingly aligned in a north-south narrow sheet southwards of C5 and close to C7 and C8, but all of them were classified as low-quality candidates. A close inspection of our images confirmed that they actually are background or foreground objects.
Although they do not emerge as obvious overdensities over the strong background of the stars in the main body of the galaxy in Fig. 2, the CMDs of C4 and C6 are also dominated by RGB stars, and their properties are also typical of classical GCs. The optical spectrum of C6 provided by Sloan Digital Sky Survey DR17 (Ahumada et al. 2020) suggests that the cluster should have an age in the range 1–4 Gyr.
Average and standard deviation of the measurements obtained from the F606W and F814W images with Sextractor.
According to the values reported in the NASA/IPAC Extragalactic Database; http://ned.ipac.caltech.edu
Acknowledgments
We are grateful to Angela Adamo and David Cook for their help and assistance in the use of LEGUS catalogues. MB and FA acknowledge financial support to this project by INAF, through the PRIN-2023 grant Ob. Fu 1.05.23.05.09 “Dwarf galaxies as probes of the Lambda Cold Dark Matter hierarchical paradigm at the smallest scales” (P.I.: F. Annibali). M. Correnti acknowledge financial support from the ASI-INAF agreement n.2022-14-HH-0. M. Cignoni acknowledges the support of INFN “iniziativa specifica TAsP”. MG acknowledges the INAF AstroFIt grant Fu Ob. 1.05.11. RP acknowledge the financial support to this research by the Italian Research Center on High Performance Computing Big Data and Quantum Computing (ICSC), project funded by European Union - NextGenerationEU - and National Recovery and Resilience Plan (NRRP) - Mission 4 Component 2 within the activities of Spoke 3 (Astrophysics and Cosmos Observations). These data are associated with the HST GO program 17140 (PI: F. Annibali). Support for program number 17140 was provided by NASA through a grant from the Space Telescope Science Institute, which is operated by the Association of Universities for Research in Astronomy under NASA contract This work is based on LBT data. The LBT is an international collaboration among institutions in the United States, Italy, and Germany. LBT Corporation partners are the University of Arizona on behalf of the Arizona Board of Regents; Istituto Nazionale di Astrofisica, Italy; LBT Beteiligungsgesellschaft, Germany, representing the Max Planck Society, the Leibniz Institute for Astrophysics Potsdam, and Heidelberg University; the Ohio State University, and the Research Corporation, on behalf of the University of Notre Dame, University of Minnesota, and University of Virginia. We acknowledge the support from the LBT-Italian Coordination Facility for the execution of observations, data distribution, and reduction. This research has made use of the SIMBAD database, operated at CDS, Strasbourg, France. This research has made use of the NASA/IPAC Extragalactic Database (NED), which is operated by the Jet Propulsion Laboratory, California Institute of Technology, under contract with the National Aeronautics and Space Administration. In this analysis we made use of TOPCAT (http://www.starlink.ac.uk/topcat/, Taylor 2005), APT (https://www.aperturephotometry.org, Laher et al. 2012a,b), DOLPHOT (http://americano.dolphinsim.com/dolphot/, Dolphin 2000, 2016).
References
- Adamo, A., Ryon, J. E., Messa, M., et al. 2017, ApJ, 841, 131 [Google Scholar]
- Ahumada, R., Allende Prieto, C., Almeida, A., et al. 2020, ApJS, 249, 3 [NASA ADS] [CrossRef] [Google Scholar]
- Aihara, H., Allende Prieto, C., An, D., et al. 2011, ApJS, 193, 29 [NASA ADS] [CrossRef] [Google Scholar]
- Alfaro-Cuello, M., Kacharov, N., Neumayer, N., et al. 2019, ApJ, 886, 57 [Google Scholar]
- Alfaro-Cuello, M., Kacharov, N., Neumayer, N., et al. 2020, ApJ, 892, 20 [CrossRef] [Google Scholar]
- Annibali, F., Tosi, M., Aloisi, A., van der Marel, R. P., & Martinez-Delgado, D. 2012, ApJ, 745, L1 [NASA ADS] [CrossRef] [Google Scholar]
- Annibali, F., Nipoti, C., Ciotti, L., et al. 2016, ApJ, 826, L27 [NASA ADS] [CrossRef] [Google Scholar]
- Annibali, F., Bellazzini, M., Correnti, M., et al. 2019, ApJ, 883, 19 [NASA ADS] [CrossRef] [Google Scholar]
- Annibali, F., Beccari, G., Bellazzini, M., et al. 2020, MNRAS, 491, 5101 [NASA ADS] [Google Scholar]
- Barmby, P., McLaughlin, D. E., Harris, W. E., Harris, G. L. H., & Forbes, D. A. 2007, AJ, 133, 2764 [Google Scholar]
- Baumgardt, H., & Vasiliev, E. 2021, MNRAS, 505, 5957 [NASA ADS] [CrossRef] [Google Scholar]
- Baumgardt, H., Sollima, A., & Hilker, M. 2020, PASA, 37, e046 [Google Scholar]
- Bedin, L. R., Cassisi, S., Castelli, F., et al. 2005, MNRAS, 357, 1038 [NASA ADS] [CrossRef] [Google Scholar]
- Bellazzini, M., & Pascale, R. 2024, A&A, in press, https://doi.org/10.1051/0004-6361/202449575 [Google Scholar]
- Bellazzini, M., Ibata, R. A., Chapman, S. C., et al. 2008, AJ, 136, 1147 [Google Scholar]
- Bellazzini, M., Perina, S., Galleti, S., & Oosterloo, T. 2011, A&A, 533, A37 [NASA ADS] [CrossRef] [EDP Sciences] [Google Scholar]
- Bellazzini, M., Ibata, R., Malhan, K., et al. 2020, A&A, 636, A107 [NASA ADS] [CrossRef] [EDP Sciences] [Google Scholar]
- Bertin, E., & Arnouts, S. 1996, A&AS, 117, 393 [NASA ADS] [CrossRef] [EDP Sciences] [Google Scholar]
- Bland-Hawthorn, J., & Gerhard, O. 2016, ARA&A, 54, 529 [Google Scholar]
- Bressan, A., Marigo, P., Girardi, L., et al. 2012, MNRAS, 427, 127 [NASA ADS] [CrossRef] [Google Scholar]
- Brodie, J. P., & Strader, J. 2006, ARA&A, 44, 193 [Google Scholar]
- Cannon, J. M., McNichols, A. T., Teich, Y. G., et al. 2016, AJ, 152, 202 [NASA ADS] [CrossRef] [Google Scholar]
- Carretta, E., Bragaglia, A., Gratton, R. G., et al. 2010, ApJ, 714, L7 [Google Scholar]
- Cook, D. O., Lee, J. C., Adamo, A., et al. 2019, MNRAS, 484, 4897 [NASA ADS] [CrossRef] [Google Scholar]
- Cook, D. O., Lee, J. C., Adamo, A., et al. 2023, MNRAS, 519, 3749 [CrossRef] [Google Scholar]
- Diemand, J., Moore, B., & Stadel, J. 2005, Nature, 433, 389 [Google Scholar]
- Djorgovski, S. G., Côté, P., Meylan, G., et al. 2003, ASP Conf. Ser., 296, 479 [NASA ADS] [Google Scholar]
- Dolphin, A. E. 2000, PASP, 112, 1383 [Google Scholar]
- Dolphin, A. 2016, Astrophysics Source Code Library [record ascl:1608.013] [Google Scholar]
- Elson, R. A. W., Fall, S. M., & Freeman, K. C. 1987, ApJ, 323, 54 [Google Scholar]
- Federici, L., Bellazzini, M., Galleti, S., et al. 2007, A&A, 473, 429 [NASA ADS] [CrossRef] [EDP Sciences] [Google Scholar]
- Fukugita, M., Ichikawa, T., Gunn, J. E., et al. 1996, AJ, 111, 1748 [Google Scholar]
- Galleti, S., Federici, L., Bellazzini, M., Buzzoni, A., & Pecci, F. F. 2006, ApJ, 650, L107 [NASA ADS] [CrossRef] [Google Scholar]
- Gatto, M., Ripepi, V., Bellazzini, M., et al. 2021, MNRAS, 507, 3312 [NASA ADS] [CrossRef] [Google Scholar]
- Giallongo, E., Ragazzoni, R., Grazian, A., et al. 2008, A&A, 482, 349 [NASA ADS] [CrossRef] [EDP Sciences] [Google Scholar]
- Hwang, N., Park, H. S., Lee, M. G., et al. 2014, ApJ, 783, 49 [NASA ADS] [CrossRef] [Google Scholar]
- Ibata, R. A., Bellazzini, M., Malhan, K., Martin, N., & Bianchini, P. 2019, Nat. Astron., 3, 667 [Google Scholar]
- Jennings, Z. G., Romanowsky, A. J., Brodie, J. P., et al. 2015, ApJ, 812, L10 [NASA ADS] [CrossRef] [Google Scholar]
- Kado-Fong, E., Greene, J. E., Greco, J. P., et al. 2020, AJ, 159, 103 [NASA ADS] [CrossRef] [Google Scholar]
- Karachentsev, I. D., Makarov, D. I., & Kaisina, E. I. 2013, AJ, 145, 101 [Google Scholar]
- King, I. R. 1966, AJ, 71, 64 [Google Scholar]
- Laher, R. R., Gorjian, V., Rebull, L. M., et al. 2012a, PASP, 124, 737 [NASA ADS] [CrossRef] [Google Scholar]
- Laher, R. R., Rebull, L. M., Gorjian, V., et al. 2012b, PASP, 124, 764 [NASA ADS] [CrossRef] [Google Scholar]
- Lambert, M., Khim, D. J., Zaritsky, D., & Donnerstein, R. 2024, AJ, 167, 61 [NASA ADS] [CrossRef] [Google Scholar]
- Mackey, A. D., Ferguson, A. M. N., Huxor, A. P., et al. 2019, MNRAS, 484, 1756 [NASA ADS] [CrossRef] [Google Scholar]
- Makarov, D. I., Makarova, L. N., & Uklein, R. I. 2013, Astrophys. Bull., 68, 125 [NASA ADS] [CrossRef] [Google Scholar]
- Marble, A. R., Engelbracht, C. W., van Zee, L., et al. 2010, ApJ, 715, 506 [NASA ADS] [CrossRef] [Google Scholar]
- Mieske, S., Frank, M. J., Baumgardt, H., et al. 2013, A&A, 558, A14 [NASA ADS] [CrossRef] [EDP Sciences] [Google Scholar]
- Miller, B. W., & Lotz, J. M. 2007, ApJ, 670, 1074 [NASA ADS] [CrossRef] [Google Scholar]
- Misgeld, I., & Hilker, M. 2011, MNRAS, 414, 3699 [Google Scholar]
- Moustakas, J., & Kennicutt, R. C., Jr. 2006, ApJS, 164, 81 [CrossRef] [Google Scholar]
- Neumayer, N., Seth, A., & Böker, T. 2020, A&ARv, 28, 4 [Google Scholar]
- Norris, M. A., Kannappan, S. J., Forbes, D. A., et al. 2014, MNRAS, 443, 1151 [NASA ADS] [CrossRef] [Google Scholar]
- Pascale, R., Annibali, F., Tosi, M., et al. 2024, A&A, 688, A144 [NASA ADS] [CrossRef] [EDP Sciences] [Google Scholar]
- Paudel, S., Smith, R., Yoon, S. J., Calderón-Castillo, P., & Duc, P.-A. 2018, ApJS, 237, 36 [Google Scholar]
- Paudel, S., Duc, P.-A., Lim, S., et al. 2023, MNRAS, 526, L136 [NASA ADS] [CrossRef] [Google Scholar]
- Peacock, M. B., Maccarone, T. J., Knigge, C., et al. 2010, MNRAS, 402, 803 [NASA ADS] [CrossRef] [Google Scholar]
- Primack, J. 2024, ARA&A, 74, 173 [Google Scholar]
- Sabbi, E., Calzetti, D., Ubeda, L., et al. 2018, ApJS, 235, 23 [Google Scholar]
- Sacchi, E., Bellazzini, M., Annibali, F., et al. 2024, A&A, in press, https://doi.org/10.1051/0004-6361/202450106 [Google Scholar]
- Saifollahi, T., Janz, J., Peletier, R. F., et al. 2021, MNRAS, 504, 3580 [NASA ADS] [CrossRef] [Google Scholar]
- Schlafly, E. F., & Finkbeiner, D. P. 2011, ApJ, 737, 103 [Google Scholar]
- Schlegel, D. J., Finkbeiner, D. P., & Davis, M. 1998, ApJ, 500, 525 [Google Scholar]
- Sirianni, M., Jee, M. J., Benítez, N., et al. 2005, PASP, 117, 1049 [Google Scholar]
- Taylor, M. B. 2005, ASP Conf. Ser., 347, 29 [Google Scholar]
- Tully, R. B., Rizzi, L., Shaya, E. J., et al. 2009, AJ, 138, 323 [NASA ADS] [CrossRef] [Google Scholar]
- Vergely, J. L., Lallement, R., & Cox, N. L. J. 2022, A&A, 664, A174 [NASA ADS] [CrossRef] [EDP Sciences] [Google Scholar]
- Wang, J., Bose, S., Frenk, C. S., et al. 2020, Nature, 585, 39 [Google Scholar]
- Williams, B. F., Lang, D., Dalcanton, J. J., et al. 2014, ApJS, 215, 9 [Google Scholar]
Appendix A: Properties and isolation of NGC 5238
In Table A.1 we summarise the main properties of NGC 5238, including the tidal indices defined by Karachentsev et al. (2013) to quantify the possible impact of tides from nearby galaxies (see Annibali et al. 2016, for a discussion related to the selection of SSH targets). Negative values of these indices imply that the effect of tidal forces from known surrounding galaxies is negligible. θ1 is intended to measure the tidal force exerted on the galaxy by the main disturber while θ5 combines the effects of the five strongest disturbers. It is interesting to note that both parameters are negative, in the case of NGC 5238.
NGC 5238 is a member of the Canes Venatici I Cloud (CVn I Cloud; Makarov et al. 2013) that includes several galaxies with distance and line of sight velocity very similar to it. However, according to Karachentsev et al. (2013) the main disturber of NGC 5238 is the Seyfert galaxy NGC 4736 (M 94) that lies ≃13.0° apart in projection, corresponding to ≃960 kpc. The closest dwarf galaxy is UGC 8331, ≃5.1° apart in projection, corresponding to ≃370 kpc. Assuming that this galaxy is exactly at the same line of sight distance as NGC 5238 and a transverse velocity two times the velocity dispersion of the CVn I Cloud (σ = 51 km/s; Makarov et al. 2013), it would require ≃3.5 Gyr to bring the two galaxies at the same position. In summary, it seems highly unlikely that the existing galaxies around NGC 5238 can be responsible for its disturbed morphology; the galaxy appears to be remarkably isolated.
Main properties of NGC 5238.
Appendix B: Data reduction
We downloaded from the HST archive10 the flc science images, which correspond to the bias-corrected, dark-subtracted, flat-fielded, charge transfer efficiency-corrected, Gaia-aligned images. We combined them in a single-stacked, distortion-corrected image (to be used as a reference frame in the photometric data reduction). Then, we used the latest version of DOLPHOT (Dolphin 2000, 2016) to obtain simultaneous multi-filter PSF photometry. We set DOLPHOT parameters using a combination between the default values and those derived by (Williams et al. 2014).
To exclude artifacts and spurious detections from the DOLPHOT output, we adopted a series of selection cuts using diagnostic parameters included in the photometric catalog (following e.g. Annibali et al. 2019). In particular, after a first selection where we retained only the sources with Object type ≤ 1, photometry quality flag ≤ 2, and S/N > 3, we adopted cuts in the sharp parameter, tracing the difference in extension of the image of a source with respect to a point source, and in the crowd parameter, indicative of the degree of contamination by nearby stars, that allows to remove a large fraction of contaminants (see, e.g. Bellazzini et al. 2011, and references therein). The sharp cuts have been derived from the sharp vs magnitude distribution, selecting sources with |sharp| < 0.075 or, after calculating the mean and sigma of the sharp distribution in 0.5 magnitudes bins, within ±2.0σ from the local mean. For the crowd parameter, we selected sources with crowd < 0.1 or within 2.0 σ from the local mean, calculated from the mean and sigma of the crowd distribution in 0.5 magnitudes bins.
Additional details on the data reduction will be provided in a forthcoming paper where we will discuss in detail the structure and star formation history of the galaxy.
Appendix C: Cluster images and CMDs
The RGB colour stamp images zoomed on the eight clusters listed in Table 1 are presented in Fig. C.1. There are several features that may be worth noting here: (a) the great extension of C1, with many well resolved stars in the outer regions, (b) the fact that all the clusters appear as partially resolved, (c) the background galaxy very close to C2, to the south-south-west of its centre, (d) the fact that C2, C5, and C7 are significantly less compact that the other five clusters, with bright stars resolved also very close to the centre, (e) the remarkable elongation of C6 (see Appendix D). All these clusters appear as genuine GCs.
In Fig. C.2, for each of the six clusters possibly associated with the tidal tails, we show the CMD of the stars enclosed within the reported radial annulus centred on the cluster centre (left panels, red filled circles), flanked by the CMD of the stars located within an annulus of the same area but centred ≃20″ away from the cluster (the CF), carefully avoiding possibly problematic regions (e.g. including bright foreground stars and/or bright or extended background galaxies). Both the stars in the cluster and in the CF region are superimposed to the CMD of the stars in the outskirts of the galaxy (r> 70.0″, grey dots), for reference. It may be worth noting that these regions of the galaxy are populated only by old (RGB) and intermediate-age (bright AGB) stars. We have also superimposed to each CMD the RGB of three theoretical isochrones from the Padova set Bressan et al. (2012)11 of age 12.0 Gyr and [M/H]=-2.2, -1.5, -1.0, properly shifted to the distance of NGC 5238. From all the comparisons it emerges that the considered clusters are indeed over-densities of RGB stars with respect to the surrounding field, as shown already in Fig. 2, albeit in the case of the most compact cluster (C3) the statistical significance may be low due to the low number of individual stars that can be resolved in the cluster outskirts. In all cases the cluster stars are roughly enclosed between the [M/H]=-1.5 and the [M/H]=-2.2 isochrones, suggesting that the clusters, if old, are quite metal-poor. In the cluster regions of C1, C2, and C3 there are also one, one and two AGB stars brighter that the RGB tip, respectively, that have no counterpart in the CFs. This may suggest that these clusters may in fact have an intermediate age. It is hard to state the statistical significance of this difference given the extremely low numbers and the fact that field AGB stars are distributed all over the galaxy.
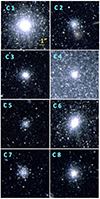 |
Fig. C.1. Stamp images zoomed in on a 10″ × 10″ box centred on the cluster for the eight clusters listed in Table 1. North is up and east to the left. The RGB images were obtained using the F814W image for the red channel, the F606W image for the blue channel, and the sum of the F814W and F606w images for the green channel. |
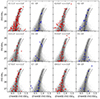 |
Fig. C.2. CMDs for the six star clusters possibly associated with the tidal tails. In each panel the CMD of the field population in the outskirts of NGC 5238 (r> 70.0″) is plotted in grey, and the RGB of three Padova isochrones (Bressan et al. 2012) of age 12.0 Gyr and [M/H]=-2.2, -1.5, -1.0 (from left to right) are plotted as black continuous curves, for reference. For each cluster, stars within a small radial annulus around the cluster centre are plotted as red circles in the ‘on cluster’ CMD, while those of a nearby CF of the same area are plotted as blue circles in the flanking CMD. The limits of the radial annuli are reported in the ‘on cluster’ panels. |
Appendix D: Surface brightness profiles
The observed SB profile together with the best fit K66 and EFF87 models for the six clusters possibly associated with the tidal tails of NGC 5238 are displayed in Fig. D.1. The adopted EFF87 profiles have the form
 (D.1)
(D.1)
where μ0 ≡ μ(0) (Gatto et al. 2021).
As done in Gatto et al. (2021), the fit of the EFF87 is limited to the SB points out to a limiting radius rf that approximately coincide to the last points of the observed profile shown in each panel of Fig. D.1. The structural parameters of the studied clusters, derived from the SB profile fits shown in Fig. D are reported in Table D.1. The half-light radii have been obtained by direct integration of the best-fit profiles.
As a sanity check on the remarkably bright integrated magnitudes of C1, we used APT to measure them also in the SSH LBC images. We obtain g = 17.72 ± 0.06 and r = 17.22 ± 0.05, in the Sloan Digital Sky Survey ABMAG photometric system (Fukugita et al. 1996), calibrated as described in Annibali et al. (2020). With the same assumptions on distance and reddening as above, the corresponding absolute magnitudes are Mg = −10.42 ± 0.08 and Mr = −10.90 ± 0.07. The colour (g − r)0 = 0.48 ± 0.08 is typical of classical MW GCs (Peacock et al. 2010). Using the transformation
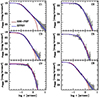 |
Fig. D.1. SB profiles of the clusters possibly associated with the NGC 5238 tidal tails. Over-plotted is the best-fit K66 model convolved with a simple model of the HST PSF (red) and EFF87 (blue) models. |
 (D.2)
(D.2)
from Lupton (2005)12, we obtain MV = −10.7 ± 0.1, compatible with the measure obtained from HST data and, above all, providing a fully independent confirmation of the high luminosity of C1.
This Letter is focused on the six clusters that appear to correlate more strictly to the tidal tails of NGC 5238. C4 and C6 were included in our list because they appeared evident in the visual inspection of the galaxy outskirts that lead to the discovery of the new clusters. However, in the present analysis, they play the precious role of a bridge between us and LEGUS since they allowed us to verify that, for these clusters, our newly derived integrated magnitudes are in good agreement with the independent measures by LEGUS (see Sect. 2). In particular, the differences in the integrated magnitudes between our measures and those by LEGUS are ΔF606W = 0.01 ± 0.10 and ΔF814W = −0.06 ± 0.10 for C4, and ΔF606W = −0.14 ± 0.09 and ΔF814W = −0.22 ± 0.09 for C6. The fact that our magnitudes are slightly brighter than those by LEGUS is due to the fact that we adopted large apertures, purposely suited to include the contribution by resolved stars, while Sextractor, by definition, should have considered only the unresolved body of the clusters when computing the magnitudes within the LEGUS pipeline. Indeed, the magnitudes we derived from our images with Sextractor more closely match the LEGUS values than those obtained with APT. Finally, we note that also C6 is quite a bright cluster (MV = −9.55 ± 0.06), with properties overlapping with those of the faintest NSCs, and it also displays a significant ellipticity, ϵ ≃ 0.25, as measured with Sextractor.
Appendix E: Distance and reddening
We derived a new distance estimate for NGC 5238 from the RGB tip (TRGB) using our ACS photometry. Following exactly the same procedure as Bellazzini & Pascale (2024) we obtain F814W0TRGB = 24.10 ± 0.01 and (F606W − F814W)0TRGB = 1.13 ± 0.06. Adopting, from the same authors, MF814W0TRGB = −3.996 ± 0.045 for the TRGB of the Small Magellanic Cloud that have the same colour, we get (m − M)0 = 28.10 ± 0.05, corresponding to D = 4.17 ± 0.10 Mpc. At a first glance this is significantly smaller than D = 4.51 ± 0.06 Mpc by Tully et al. (2009) but, in fact, this is based on a very different calibration and the uncertainty on the calibration is completely neglected, while it is fully taken into account by Bellazzini & Pascale (2024). Moreover, Tully et al. (2009) derive F814W0TRGB = 24.20 ± 0.02, that is hardly compatible with our CMD, even at a first glance. On the other hand, the LEGUS collaboration reports D = 4.43 ± 0.34 Mpc (Sabbi et al. 2018; Cook et al. 2023), compatible with our measure, within the uncertainties. We do not enter here in the discussion of the merit of the various distance estimates, we simply adopt our own one because is smaller than the others, a conservative choice in the derivation of the absolute integrated magnitude of the clusters in the sense that the values that we obtain are unlikely to be inflated by the adoption of an overly large distance.
The Schlegel et al. (1998) reddening maps show that the foreground extinction is very low and uniform over the field covered by our ACS images and in the extreme outskirts of the galaxy, where the clusters we are interested in are located, there should be no contribution from internal extinction. Consequently we adopt E(B − V) = 0.01, re-calibrating the mean value from the Schlegel et al. (1998) maps according to Schlafly & Finkbeiner (2011). As a sanity check, these results have been confirmed using the extinction maps by Vergely et al. (2022). We adopt the reddening laws reported in Bellazzini & Pascale (2024).
Structural parameters of the analysed clusters.
All Tables
All Figures
|
Fig. 1. Images of NGC 5238 from our HST (left image) and LBT (right image) data, with the star clusters considered in this Letter circled and labelled. The different intensity cuts in the two images are intended to highlight the irregular structure of the inner star-forming region (ACS image) and the regular ellipsoid of the main body as well as the shape of the tidal features protruding from its northern and southern edges (LBC image). |
| In the text | |
|
Fig. 2. A view of NGC 5238 from our HST ACS-WFC photometry. Left panel: CMD of the entire sample. The main evolutionary phases are labelled, and the RGB selection box is plotted in red. Right panel: Map of the RGB stars in our field (RA and Dec in degrees). Each star is colour-coded according to the local density. The main tidal features and all the star clusters possibly associated with them are labelled; they appear as local overdensities on the map. Please note how prominent the overdensity associated with C1 is. The two diagonal under-dense stripes correspond to the gaps between the ACS-WFC CCDs in the two WFC images used to build our mosaic image. In these stripes, the effective exposure time is lower than elsewhere. |
| In the text | |
|
Fig. 3. NGC 5238 clusters listed in Table 1 compared with the sample of pressure-supported stellar systems from Norris et al. (2014) in the plane opposing the logarithm of Rh and the absolute integrated V magnitude. The Norris et al. (2014) catalogue does not discriminate between GCs, UCDs, and compact ellipticals (cEs), but the distribution of the GC–UCD–cE class is dominated by UCDs and cEs for MV ≤ −10.0 and by GCs for MV > −10.0. |
| In the text | |
|
Fig. C.1. Stamp images zoomed in on a 10″ × 10″ box centred on the cluster for the eight clusters listed in Table 1. North is up and east to the left. The RGB images were obtained using the F814W image for the red channel, the F606W image for the blue channel, and the sum of the F814W and F606w images for the green channel. |
| In the text | |
|
Fig. C.2. CMDs for the six star clusters possibly associated with the tidal tails. In each panel the CMD of the field population in the outskirts of NGC 5238 (r> 70.0″) is plotted in grey, and the RGB of three Padova isochrones (Bressan et al. 2012) of age 12.0 Gyr and [M/H]=-2.2, -1.5, -1.0 (from left to right) are plotted as black continuous curves, for reference. For each cluster, stars within a small radial annulus around the cluster centre are plotted as red circles in the ‘on cluster’ CMD, while those of a nearby CF of the same area are plotted as blue circles in the flanking CMD. The limits of the radial annuli are reported in the ‘on cluster’ panels. |
| In the text | |
|
Fig. D.1. SB profiles of the clusters possibly associated with the NGC 5238 tidal tails. Over-plotted is the best-fit K66 model convolved with a simple model of the HST PSF (red) and EFF87 (blue) models. |
| In the text | |
Current usage metrics show cumulative count of Article Views (full-text article views including HTML views, PDF and ePub downloads, according to the available data) and Abstracts Views on Vision4Press platform.
Data correspond to usage on the plateform after 2015. The current usage metrics is available 48-96 hours after online publication and is updated daily on week days.
Initial download of the metrics may take a while.