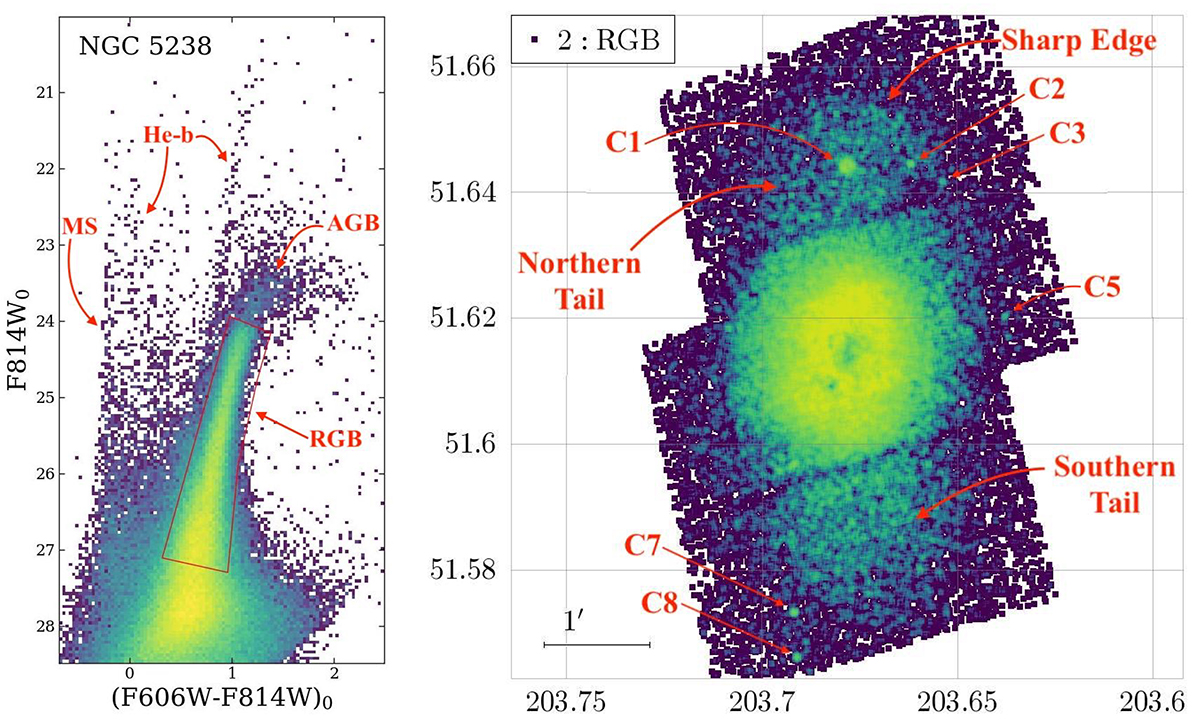
Fig. 2.
Download original image
A view of NGC 5238 from our HST ACS-WFC photometry. Left panel: CMD of the entire sample. The main evolutionary phases are labelled, and the RGB selection box is plotted in red. Right panel: Map of the RGB stars in our field (RA and Dec in degrees). Each star is colour-coded according to the local density. The main tidal features and all the star clusters possibly associated with them are labelled; they appear as local overdensities on the map. Please note how prominent the overdensity associated with C1 is. The two diagonal under-dense stripes correspond to the gaps between the ACS-WFC CCDs in the two WFC images used to build our mosaic image. In these stripes, the effective exposure time is lower than elsewhere.
Current usage metrics show cumulative count of Article Views (full-text article views including HTML views, PDF and ePub downloads, according to the available data) and Abstracts Views on Vision4Press platform.
Data correspond to usage on the plateform after 2015. The current usage metrics is available 48-96 hours after online publication and is updated daily on week days.
Initial download of the metrics may take a while.