Open Access
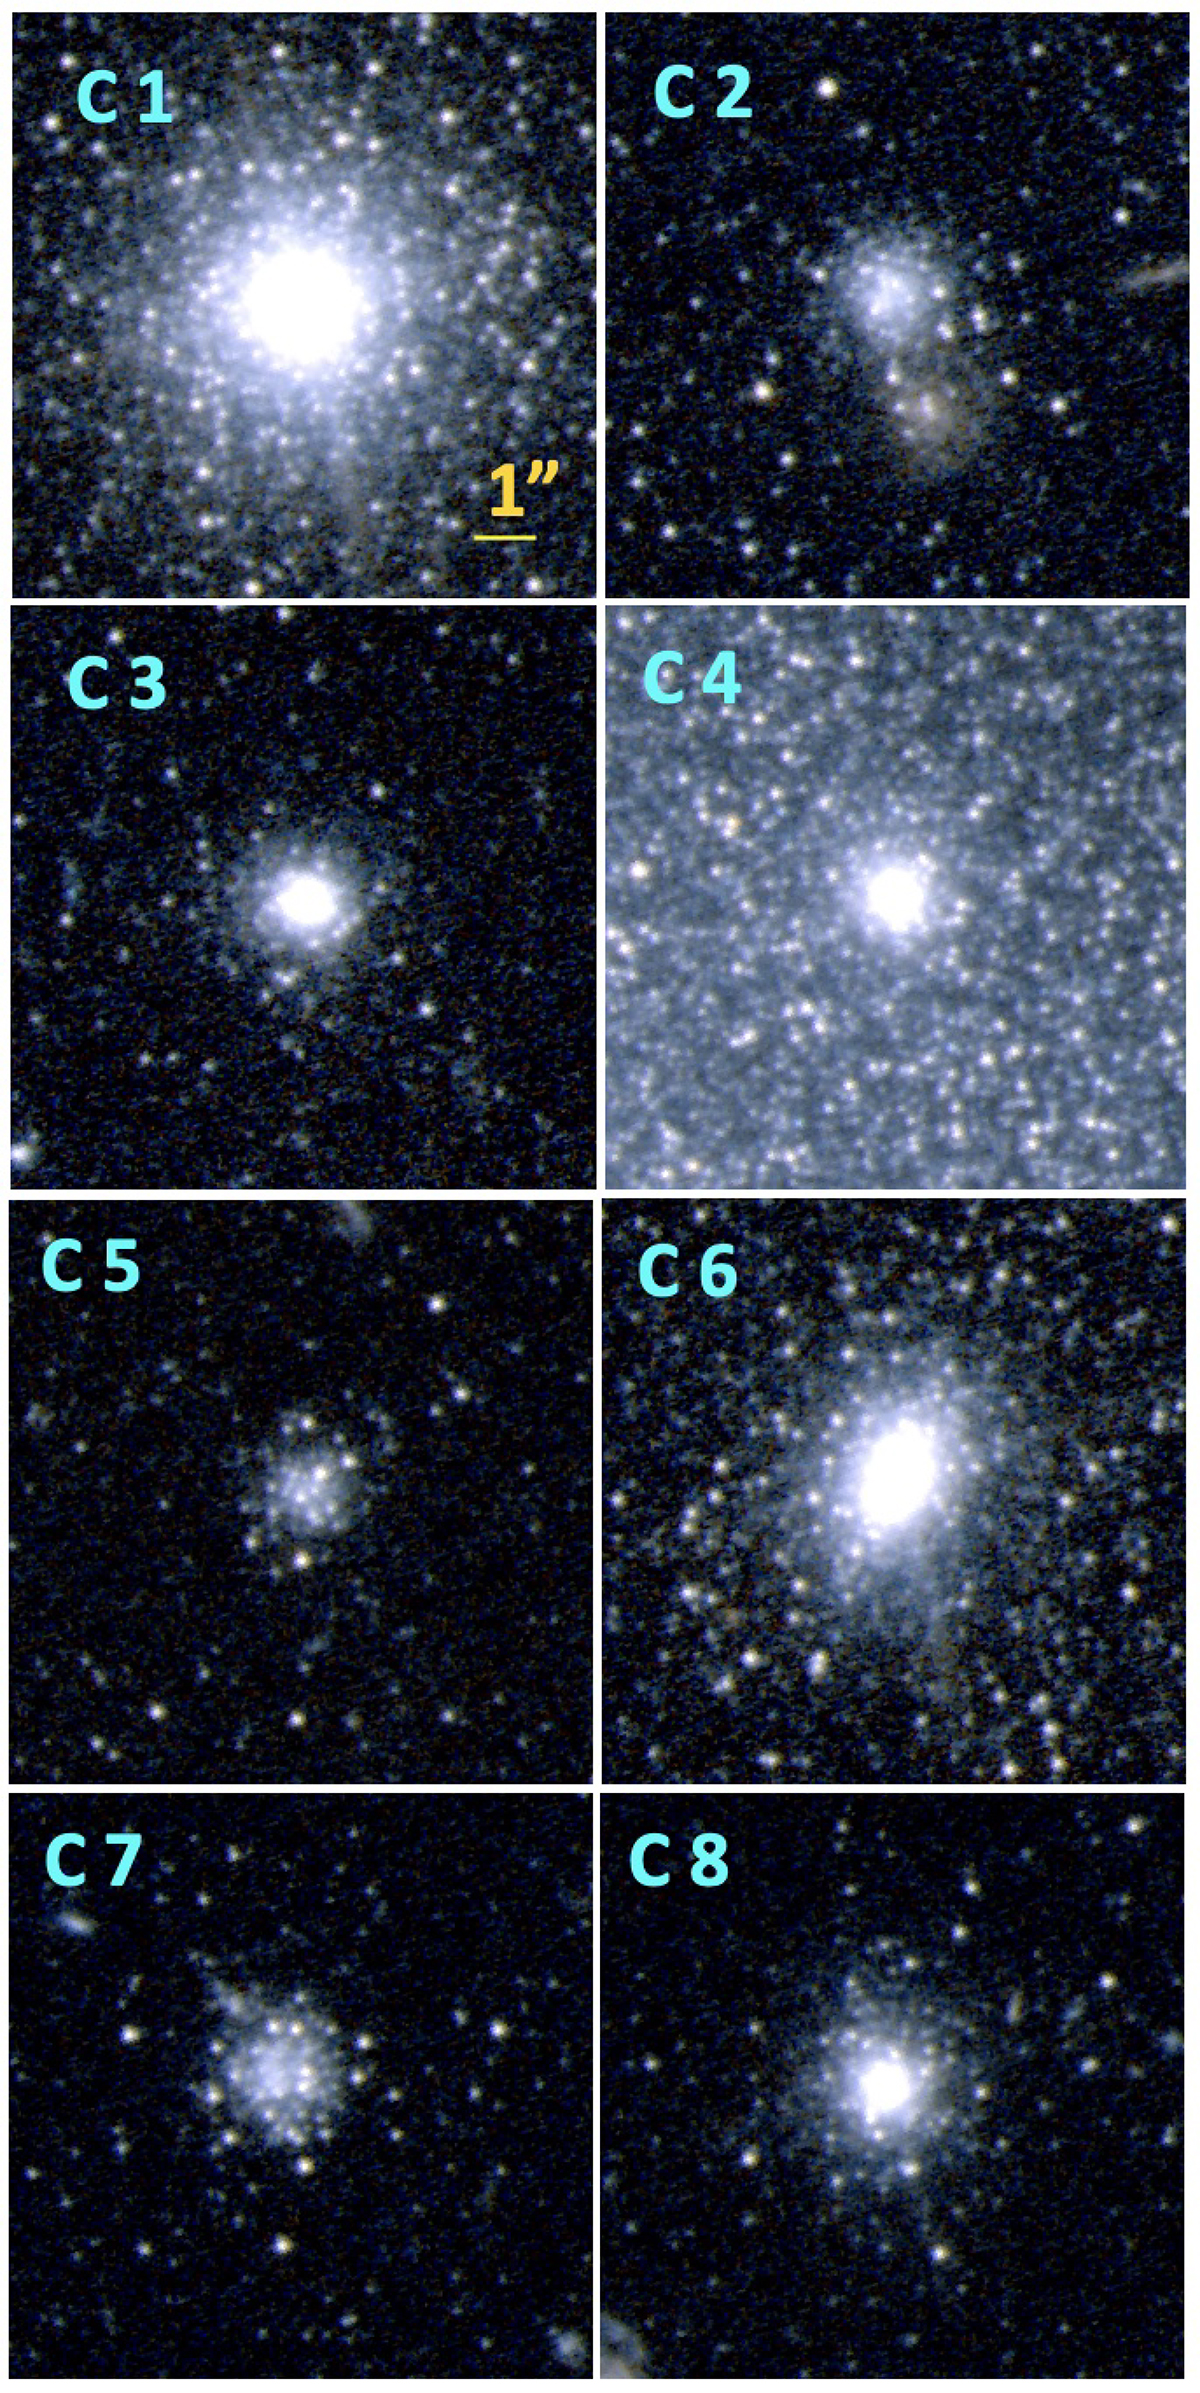
Fig. C.1.
Download original image
Stamp images zoomed in on a 10″ × 10″ box centred on the cluster for the eight clusters listed in Table 1. North is up and east to the left. The RGB images were obtained using the F814W image for the red channel, the F606W image for the blue channel, and the sum of the F814W and F606w images for the green channel.
Current usage metrics show cumulative count of Article Views (full-text article views including HTML views, PDF and ePub downloads, according to the available data) and Abstracts Views on Vision4Press platform.
Data correspond to usage on the plateform after 2015. The current usage metrics is available 48-96 hours after online publication and is updated daily on week days.
Initial download of the metrics may take a while.