Fig. 5
Download original image
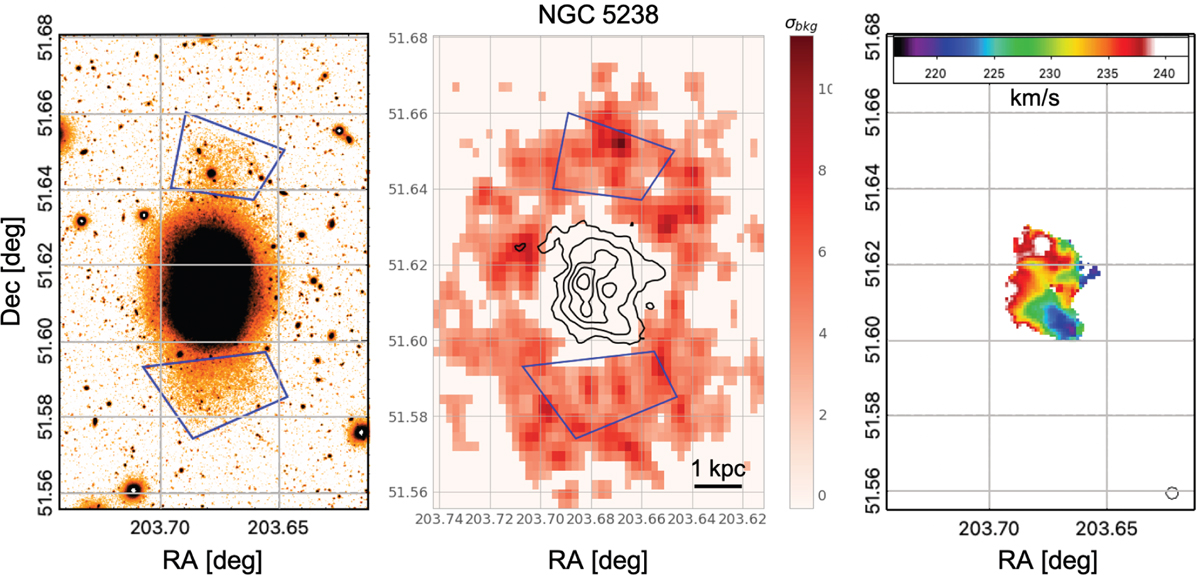
Left panel: central part of the ɡ-band LBT image of NGC 5238, covering a field of view of ~ 4.9′ × 7.5′, or ~ 6.0 × 9.2 kpc2 (using the distance in Table 1). The peculiar structures with low surface brightness are highlighted by the blue polygons. Middle panel: map of RGB stars in the same area, background-subtracted and with pixels below 3σ of the background set to zero. The HI iso-density contours are superimposed in black and correspond to a column density of [2.5, 5, 10, ad 20] ×1020 atoms/cm2. The horizontal black bar is 1 kpc long, adopting the distances in Table 1. Right panel: HI velocity field. The beam size is also shown in the bottom right corner. North is up, and east is to the left. The HI data are from the VLA program 23A-195 (Cannon, Schisgal et al., in prep.). All three panels are exactly on the same scale.
Current usage metrics show cumulative count of Article Views (full-text article views including HTML views, PDF and ePub downloads, according to the available data) and Abstracts Views on Vision4Press platform.
Data correspond to usage on the plateform after 2015. The current usage metrics is available 48-96 hours after online publication and is updated daily on week days.
Initial download of the metrics may take a while.